Psicológica (2017), 39, 88-117. doi: 10.2478/psicolj-2018-0005
Recursive Partitioning Methods for Data Imputation in the Context of Item Response Theory: A Monte Carlo Simulation Julianne M. Edwards*1 & W. Holmes Finch2 1
Azusa Pacific University (USA) 2
Ball State University (USA)
Missing data is a common problem faced by psychometricians and measurement professionals. To address this issue, there are a number of techniques that have been proposed to handle missing data regarding Item Response Theory. These methods include several types of data imputation methods - corrected item mean substitution imputation, response function imputation, multiple imputation, and the EM algorithm, as well as approaches that do not rely on the imputation of missing values - treating the item as not presented, coding missing responses as incorrect, or as fractionally correct. Of these methods, even though multiple imputation has demonstrated the best performance in prior research, higher MAE was still present. Given this higher model parameter estimation MAE for even the best performing missing data methods, this simulation study’s goal was to explore the performance of a set of potentially promising data imputation methods based on recursive partitioning. Results of this study demonstrated that approaches that combine multivariate imputation by chained equations and recursive partitioning algorithms yield data with relatively low estimation MAE for both item difficulty and item discrimination. Implications of these findings are discussed.
The presence of missing data is a common phenomenon in measurement and psychometrics. For example, examinees might leave items unanswered due to time pressure, or because they did not know the correct response. Regardless of the reason for the presence of missing data, it must be handled in some fashion prior to the use of measurement tools, such as item response theory (IRT) modeling. Missing data is generally defined as coming from one of the following mechanisms: (1) missing completely at *
Corresponding author: Julianne M. Edwards, Department of Psychology, Azusa Pacific University, USA. Email:
[email protected].
© 2018 (Edwards & Holmes) This is an open access article licensed under the Creative Commons Attribution-NonCommercial-NoDerivs License (http://creativecommons.org/licenses/by-nc-nd/4.0/) Unauthenticated Download Date | 1/24/18 1:44 AM
Missing Data Imputation And Item Response Theory Parameter Estimation
89
random (MCAR), which occurs when there is no systematic cause for the missingness to have occurred (Schafer, 1997), (2) missing at random (MAR) in which the missing data mechanism is related to one or more measured variables, and (3) missing not at random (MNAR), which occurs when data are missing due to the value of the missing variable itself. The presence of missing item responses may be inevitable in many instances, and has been shown to have a deleterious impact on the estimation of IRT parameters if it is not handled properly (Andreis & Ferrari, 2012; Finch, 2008; Holman & Glas, 2005). This is particularly true for MNAR, and to a lesser degree MAR data. Due to the negative impact missing data can have, the goal of this study was to compare several missing data methods in the context of IRT modeling, in particular in the context of missing testing data. The focus within IRT was on the estimation of the item difficulty and discrimination parameters. Clearly, missing item response data can also be considered in terms of effective measures, questionnaires, or surveys, but these are beyond the purview of the current study. There are unique issues in the context of IRT modeling that need to be considered when missing data are present. For example, commonly recommended methods for dealing with the missing data (e.g., multiple imputation assuming a joint model) are based on assumptions about the distribution of the item responses or the IRT model underlying the data. In the case of dichotomous or polytomous item responses, common assumptions such as multivariate normality are unlikely to hold. In addition, when methods based on an underlying multivariate normal (or any continuous) distribution are used with IRT data, imputed values must be rounded prior to the model being fit. Finally, the mechanisms underlying missing item responses might frequently be based on the nature of the missing value itself. For example, individuals taking an academic achievement test may elect to leave an item unanswered rather than provide what they strongly believe will be an incorrect response. This type of missing data mechanism can be particularly problematic. The current study extends earlier research on missing data and IRT parameter estimation by investigating the performance of several data imputation methods, in particular, three that are based on recursive partitioning models. Such approaches may be especially promising for use with IRT data because they are nonparametric in nature, requiring no assumptions regarding the nature of the data distribution or the IRT model underlying the missing data process. Other missing data methods that have shown to be reasonably effective in some contexts in prior research do make such assumptions about either the data itself or the model underlying the missing data process. Therefore, effective approaches for dealing with missing data that do not require the researcher to know the joint data distribution, or the model underlying the
Unauthenticated Download Date | 1/24/18 1:44 AM
90
Julianne M. Edwards & W. Holmes Finch
likelihood of item responses being missing may be particularly valuable to practitioners. The recursive partitioning techniques that are the focus of the current study may fill this niche. Methods for dealing with missing data. As noted above, there exist a number of methods for dealing with missing data. Most of the commonly recommended approaches involve data imputation, with the exception of full information maximum likelihood (FIML). Data imputation techniques replace missing values with estimates of what the values might have been, using information from the non-missing observations of the variable itself, as well as from measured variables. For example, missing responses in a test are imputed from the examinee’s responses on non-missing items on the test, as well as other examinee’s responses to the items. In the next section, each method for dealing with missing data that will be included in this study is described briefly, after which prior research examining their performance is presented. Full Information Maximum Likelihood. As the name implies, Full Information Maximum Likelihood (FIML) estimates model parameters using a maximum likelihood fitting function with all of the data that are available. Thus, individuals who have missing data are included in parameter estimation using the complete information that they do have and ignoring them for the variables for which they have missing values. As is described in more detail below, FIML has been found to be an effective method for dealing with missing data in many situations involving latent variable models (Enders, 2001). FIML is also flexible regarding the types of models that can be fit, for example allowing the incorporation of covariates that are believed to be related to the missing data mechanism. In addition, as noted above, FIML does not involve imputation of missing values, making it somewhat less cumbersome to use than some of the other recommended approaches, particularly those based on data imputation. Finally, FIML is available in most statistical software for fitting latent variable models, including IRT, making it very convenient to use in practice. Multiple Imputation – Joint Modeling. Rubin (1987) first introduced multiple imputation - joint modeling (MIJM) as an alternative to the current single imputation techniques of the time (e.g., mean substitution, regressionbased imputation). Such single imputation techniques have been shown to be problematic in that they lead to underestimation of model parameter standard errors and in some cases biased parameter estimates (Schafer & Graham, 2002). In turn, these problems are associated with errors of inference in statistical models that use the imputed data. In contrast, MIJM creates multiple (m) imputed values for each missing value by developing a model for missingness that incorporates information from all of the measured
Unauthenticated Download Date | 1/24/18 1:44 AM
Missing Data Imputation And Item Response Theory Parameter Estimation
91
variables and makes draws from the distribution implied by this model to serve as the imputed values. As a result, MIJM provides greater accuracy in the imputation process than is true for the single imputation methods (Schafer & Graham, 2002). It should be noted that among the single imputation approaches, regression-based imputation is able to incorporate information about individuals and missing data as does MIJM, though it still suffers from the aforementioned problems associated with other single imputation approaches. Once the probability model for missingness is estimated, imputed values for each missing data point are drawn from the posterior distribution using Markov Chain Monte Carlo (MCMC). This process is repeated m times in order to create complete data sets that are used for the analysis of interest (Schafer & Olsen, 1998). Once the m imputed datasets are created, the analysis of interest (e.g., IRT) is used for each dataset, and the results of interest (e.g., item parameter estimates) are combined using rules provided by Rubin (1987). Multivariate Imputation by Chained Equations. Multivariate Imputation by Chained Equations (MICE), also known as fully conditional specification or sequential regression multiple imputation, is also a multiple imputation technique like MIJM (van Buuren & Oudshoorn, 1999; van Buuren & Groothuis-Oudshoorn, 2011). Unlike MIJM, however, MICE does not make assumptions regarding the joint probability distribution of the set of variables for which missing data is present (van Buuren & Oudshoorn, 1999). Rather, this approach relies on separate marginal distributions for each variable in the dataset, thereby offering greater flexibility than MIJM, particularly when a variety of data types are present among the variables. The specific distribution is selected that is appropriate for the type of variable (i.e., normal, binomial, multinomial, Poisson) that is being imputed. For example, if the variable is binary, a logistic regression model will be used, whereas if the variable is continuous the missing data might be modeled based on ordinary least squares regression. MICE is completed in a six-step process that is described by Azur et al. (2011). It is also important to note that MICE works under the assumption that the variables with missing data are MAR, and can lead to biased estimates when data are MNAR (Azur, Stuart, Frangakis, & Leaf, 2011). This is an assumption shared by each of the other approaches examined in the current study. Random Forest Imputation. Random Forest Imputation (RFI) stems from work by Breiman (2001), who developed a predictive modeling framework known as random forests. Random forest is an extension of a family of models that rely on recursive partitioning of the data in order to develop a prediction model for an outcome variable. This modeling approach
Unauthenticated Download Date | 1/24/18 1:44 AM
92
Julianne M. Edwards & W. Holmes Finch
is generally known as classification and regression trees (CART), which is the term that we will use for it in this paper. CART constructs predictive models for a dependent variable in the form of decision trees. These trees are created by repeatedly dividing the sample into increasingly homogeneous subgroups with respect to the dependent variable, using a set of predictors. For example, the dependent variable could be the response to a particular item on an assessment (scored as correct or incorrect in this example), with the predictors being the other items. In step 1 of the algorithm, CART searches all possible ways in which the sample can be divided based on the predictors, and chooses the split that minimizes homogeneity in the resulting groups (known as nodes) with respect to the dependent variable. Once this optimal split has been made and two nodes are created, CART searches across the predictor variables in order to find a split of individuals in the new nodes that yields the most homogeneous nodes with respect to the value of the dependent variable, as in step 1. Thus, from each of the two nodes created in step 1, new nodes are created based on the split described in step 2. This process continues until further splits do not result in sufficient gains in node homogeneity for the values of the dependent variable (when compared with a predetermined stopping value). In the context of this example, the predicted item response for an individual corresponds to the most common value of the dependent variable in their terminal (final) node. Thus, for example, individuals placed into a terminal node in which 80% of respondents answered the dependent variable item correctly will have as their predicted dependent variable item response the value correct. Random forest extends CART by creating a large number (e.g., 1000) of trees using bootstrap resampling of both observations and predictor variables from the original data set. For each of the B bootstrap samples, CART is conducted, and predicted values are obtained for each individual, as described above, creating B predictions for the target variable. In order to obtain a predicted value of the dependent variable for each individual in the sample using random forest, the results of these B CART trees are averaged. In the case of a binary outcome, such as an item response, the predicted value for an individual is the predicted value that was most common across the B CART analyses. Thus, an individual for whom 900 of 1000 CART trees predicted a correct response, would have as their predicted value correct. Random forest has shown to reduce the occurrence of unstable trees that can occur with CART, and to improve the generalizability of the solutions that are obtained (Bühlmann & Yu, 2002; Hastie, Tibshirani, & Friedman, 2001). Concerning missing data, RFI is similar to MICE in that no assumptions are made regarding the joint probability distribution of the set of variables. Indeed, unlike MICE (and MIJM) RFI is not based on any assumptions
Unauthenticated Download Date | 1/24/18 1:44 AM
Missing Data Imputation And Item Response Theory Parameter Estimation
93
regarding even the marginal probability distributions of the variables of interest, making it a truly nonparametric methodology. In other words, the outcome variables are not assumed to have any particular distributional form (and nor are the errors), and thus can be normal, nonnormal continuous, ordinal, dichotomous, nominal, or count, among others. RFI is conducted using a seven-step process that is outlined in Stekhoven & Bühlmann (2011) paper. MICE with Recursive Partitioning (MICE-CART). MICE-CART combines MICE and the CART methodology described above, in order to obtain imputations for missing data. Using CART for data imputation is a fairly new idea that has been investigated to some extent, although much of this earlier work focused on the use of recursive partitioning alone as a single imputation method (e.g., Iacus & Porro, 2007; Nonyane & Foulkes, 2007). Due to the shortcomings of using single imputation methods, Doove et al. (2014) proposed MICE-CART, which expanded on Burgette and Reiter (2010) work. Doove et al. (2014) argued that MICE-CART would improve upon the standard MICE approach by automatically accounting for interaction effects among the variables for which imputation is needed. MICE-CART is based on the MICE algorithm described previously, but replaces the regression model (e.g., logistic regression, ordinary least squares regression) with the CART algorithm described above, in order to obtain predicted values that serve as the imputations (Doove, Van Buuren, Dusseldorp, 2014). MICE and RFI. MICE-RFI is similar to MICE-CART, as this method uses RFI in place of the regression model in step 3 of the MICE algorithm in order to obtain predictions to serve as the imputed values. Theoretically, MICE-RFI has the same potential advantages as MICE-CART, in particular by being nonparametric in terms of the data distribution underlying the variables, as well as the model for the missing data. In addition, an advantage that MICE-RFI has over MICE-CART is that by creating multiple decision trees, it reduces the likelihood of unstable trees, and improves the generalizability of the results (Hastie, Tibshirani, & Friedman, 2001). As with MICE-CART, MICE-RFI replaces the regression model of the MICE algorithm with the RFI. Prior Research on MICE, RFI, MICE-CART, and MICE-RFI. Prior research examining the performance of recursive partitioning methods for data imputation, in general, is relatively sparse, though some work has been done (e.g., Iacus & Porro, 2007; Nonyane & Foulkes, 2007; Burgette & Reiter, 2010; Shah et al., 2014). While the research is somewhat limited, this approach to data imputation does show promise in the context of regression modeling. For example, prior studies have demonstrated that using MICE
Unauthenticated Download Date | 1/24/18 1:44 AM
94
Julianne M. Edwards & W. Holmes Finch
with recursive partitioning (i.e., MICE-CART and MICE-RFI), instead of traditional MICE, leads to less biased regression model parameter estimates (Burgette & Reiter, 2010; Doove, Van Buuren, Dusseldorp, 2014; Shah et al., 2014). Burgette and Reiter (2010) focused on comparing MICE with MICECART in the context of epidemiological studies with missing data as MAR, and found that MICE-CART was associated with lower regression model parameter estimation bias than MICE. Shah et., al. (2014) furthered this research by examining the effectiveness of using MICE-RFI compared to MICE in the presences of MAR data, and found that regression results based on MICE-RFI data exhibited less bias than did data associated with MICE only. Doove et al. (2014) further extended this research by comparing MICE, MICE-RFI, and MICE-CART in a single study, and finding that while both MICE-CART and MICE-RFI had low bias, MICE-CART had the least biased regression parameter estimates. Other researchers have focused on using RFI to impute missing data, though not in the context of IRT, which is the focus of the current work. This research has demonstrated both positive (Pantanowitz & Marwala, 2009; Stekhoven & Bühlmann, 2012) and mixed results when using RFI in simulation research (Eisemann, Waldmann, & Katalinic, 2011; Shah et al., 2014). Pantanowitz and Marwala (2009) conducted a simulation study comparing the accuracy of RFI along with four other missing data techniques in the context of the classification accuracy of several models. The results showed that imputed data based on the RFI approach yielded the most accurate predictions. While Pantanowitz and Marwala had positive results using RFI, Shah et al., (2014) found that when compared to MICE, and MICE-RFI, RFI yielded the most biased estimates for regression model parameters, and had the lowest coverage in confidence intervals. Shah et al., (2014) found that overall MICE-RFI was the better method for handling missing data. Prior research on missing data and IRT. Prior research has examined the performance of a number of techniques for handling missing data in the context of IRT. Among the methods that have been studied including listwise deletion (removing from the sample individuals who have missing item responses), scoring the missing responses as incorrect, and scoring the missing responses as fractionally correct, has shown to lead to biased item parameter estimates (e.g., Finch, 2008; De Ayala et al., 2001; Lord, 1974; Ludlow and O’leary, 1999). Other missing data approaches that were also examined in the context of IRT include: corrected item mean substitution imputation, response function imputation, and MIJM. Of these, MIJM has shown perhaps the most promise for use with IRT data, based on simulation research in multiple contexts within IRT (Wolkowitz & Skorupski, 2013;
Unauthenticated Download Date | 1/24/18 1:44 AM
Missing Data Imputation And Item Response Theory Parameter Estimation
95
Finch, 2008;). These studies revealed that imputed data based on MIJM exhibited the least amount of item difficulty and discrimination parameter estimation bias, particularly when the data were MAR (Finch, 2008). While MIJM appears to be promising for use with IRT data, there is evidence of some parameter estimation bias that is likely associated with the assumption of a multivariate normal joint probability distribution that underlays the MIJM algorithm, and is inappropriate for dichotomous and polytomous item responses (Finch, 2008). In addition, when MIJM is used with categorical item data, non-integer values must be rounded in order to match the measurement scale the actual data (i.e., ordinal or dichotomous; Ake, 2005; Schafer, 1997). This rounding appears to be associated with some IRT parameter estimation bias (Finch, 2008; Ake, 2005). Researchers have also investigated the performance of FIML in the context of latent variable models and found that it generally performs quite well. FIML is the default approach for dealing with missing data in many IRT software algorithms, and as such has the advantage of being relatively easy to implement for researchers. Prior research in the latent variable context has shown that when data are MCAR or MAR, FIML yields unbiased parameter estimates in the latent variable context (Graham, Olchowski, & Gilreath, 2007; Enders & Bandalos, 2001), but with categorical observed variables (such as item responses), the standard errors of the estimates can be somewhat negatively biased (Enders, 2001). Graham (2003) demonstrated how correlates of the missing data could be incorporated into the model with FIML fairly easily. One study that has examined the performance of MICE and RFI for missing data in the context of IRT was conducted by Andreis and Ferrari (2012). This work focused on missing item response data for MIRT models. The results showed that in terms of bias in item difficulty, parameter estimates when using RFI were generally the most accurate approach, whereas for estimating item discrimination values, both RFI and MICE were found to work well. Taken together, this prior work on missing data in the context of IRT modeling has revealed several findings of interest to practitioners in measurement. There are clearly multiple potential promising approaches for dealing with missing data, but none of these has been found to be universally effective. For example, both MIJM and the RFI modeling approaches demonstrated comparable levels of bias in item difficulty estimation, though the RFI approach was relatively more effective in the context of MNAR data. In addition, MICE and RFI appear to be effective in the IRT context as well, with RFI particularly promising as it yielded relatively low estimation bias for both item difficulty and discrimination. FIML has the advantage of ease
Unauthenticated Download Date | 1/24/18 1:44 AM
96
Julianne M. Edwards & W. Holmes Finch
of use (indeed it is essentially automatic with most IRT estimation software), and yields relatively low levels of parameter estimation bias for MAR data when the variables associated with the missing data mechanism are included in the model estimation. In summary, prior work would seem to suggest that FIML, MIJM, the RFI modeling approach, and perhaps MICE and RFI might be optimal for dealing with missing IRT data. However, there remain questions regarding the performance of these methods with IRT data and the assumptions upon which these approaches rest. FIML and MIJM both yield biased estimates when the data are MNAR, and rely on a joint probability distribution for the item responses. The RFI modeling approach shows promise for use with MNAR data, but relies on the researcher fitting an appropriate model for the missing data mechanism. In addition, MICE and RFI have not been included in many studies in which IRT parameter estimation was the focus. Given some of the disadvantages of the aforementioned approaches for handling missing data, and results of prior research external to IRT parameter estimation, MICE-RFI and MICE-CART may be useful alternatives in the context of IRT. MICE-RFI and MICE-CART have been shown to outperform both MICE and RFI in isolation for contexts other than IRT (Shah, et al., 2014; Doove, et al., 2014). Furthermore, the nonparametric nature of RFI and CART eliminates the need to assume a single joint probability distribution as is the case with MIJM, or even specific marginal distributions for the individual item responses. In addition, they do not require the researcher to identify and fit the appropriate model for the missing data mechanism (e.g., Rasch, 2PL) as in the case of the RFI method for dealing with missing data. Thus, given the promise of MICE-RFI and MICE-CART in areas outside of IRT, their flexibility in handling a variety of data distributions, and their relatively superior performance when compared with either RFI or MICE alone, it would seem that MICE-RFI and MICE-CART should be investigated in the context of IRT model parameter estimation in the presence of missing data. Study goals. Given the prior research on IRT parameter estimation and missing data, the current study seeks to add to the literature by investigating recursive partitioning based extensions of existing methods for data imputation, MICE-RFI and MICE-CART, and comparing them with several approaches that have been shown to be useful for this purpose, including FIML, MIJM, MICE, and RFI. In addition, the current study extends simulation conditions that have been used in prior work with the other methods studied here, including a wider range of percentage of missing data, and a wider array of methods for dealing with the missing data. The current study focused on the mean absolute estimation error and the empirical
Unauthenticated Download Date | 1/24/18 1:44 AM
Missing Data Imputation And Item Response Theory Parameter Estimation
97
standard errors of IRT model parameter estimates. Based on prior research, it is expected that for MAR data, MICE-RFI and MICE-CART will outperform MICE and RFI individually, as well as MIJM and FIML in terms of accuracy of item difficulty estimation. It is less clear, what is to be expected with MNAR data; however, given the little prior research that does exist in this area, it may be possible to hypothesize that all of the methods included here will yield greater bias in parameter estimates than will be the case with MAR data.
METHOD A simulation study was conducted in order to compare methods for handling missing data in the context of IRT. Data were generated and analyzed using the R software package, version 3.1 (R Core Development Team, 2014). For all combinations of the conditions described below, 1000 replications were used, and data were generated using a 2-parameter logistic model (2PL) for dichotomous data. Item parameters for the data generating model were taken from a calibration sample of a large national testing program. The item difficulty and discrimination parameters appear in Table 1. For the 20 item case (discussed below), the first 20 item parameters were used to generate the data, whereas all of the item parameter values were used for the 30 item case. All data were generated using the simIrt function in the catIrt package in R (Nydick, 2014). In addition to the 2PL model, data were also generated using the 3-parameter logistic (3PL) model, using the item difficulty and discrimination parameters in Table 1, and pseudo-chance parameter values of 0.2 for each item. Given space limitations, and the fact that the results for the 3PL simulations were generally similar to those of the 2PL model, the 3PL findings are presented in the appendix to this manuscript.
Unauthenticated Download Date | 1/24/18 1:44 AM
98
Julianne M. Edwards & W. Holmes Finch
Table 1. Data generating item difficulty discrimination parameter values for the two simulated assessments in the 30 items condition. Item Difficulty Discrimination 1 -1.92 1.07 2 -0.96 1.21 3 -0.55 0.74 4 -0.14 1.10 5 0.01 0.93 6 0.22 0.81 7 -0.41 0.94 8 0.59 1.40 9 -0.60 1.02 10 0.23 1.17 11 0.04 0.84 12 0.02 0.99 13 0.05 0.82 14 -0.02 0.98 15 0.24 1.31 16 0.41 1.05 17 0.02 1.12 18 1.15 1.27 19 1.96 0.81 20 0.77 0.79 21 0.81 0.88 22 0.92 1.24 23 -0.93 0.94 24 1.02 0.99 25 1.15 1.01 26 0.30 1.20 27 -1.37 1.03 28 -1.68 1.45 29 1.74 0.68 30 1.31 0.89 The manipulated study factors are described below. Sample size. The sample size conditions simulated in this study were 1000 and 2000. These sample sizes have been used in prior research with missing data and IRT parameter estimation, and reflect real data conditions used in IRT models. While sample sizes smaller than 1000 could have been
Unauthenticated Download Date | 1/24/18 1:44 AM
Missing Data Imputation And Item Response Theory Parameter Estimation
99
included in this study, previous studies have shown that larger sample sizes yield better performance with imputed data (Bernaards & Sijtsma, 2000; DeMars, 2002; Huisman & Molenaar, 2001; Finch, 2008). Given that the focus of this effort was on the comparison of methods that have not been used previously in the context of IRT, larger sample sizes were selected for this study. Number of Items and Percent Missing Data. Two conditions for number of items were included, 20 and 30. The percent of missing data was simulated using four conditions: 5%, 10%, 15%, and 30%. These conditions were selected, as prior research included missingness ranging from 1% to 50%, (e.g., Ake, 2005; Peng & Zhu, 2005; Leite and Beretvas, 2010; Andreis & Ferrari, 2012). Based on the findings of previous studies, a variety of statistical analyses yielded lower parameter estimation MAE and smaller standard errors in the presence of less missing data, thus leading to the inclusion of the 5% condition. In addition, it was of interest to ascertain how well the methods under study here performed when there were greater levels of missing data, ranging from relatively low (5%), to moderate (10%-15%) to very high in most testing situations (30%). This latter condition was included to assess the performance of each method in a relatively extreme case.. Type of Missing Data. Two types of missing data were simulated in the current study, MAR and MNAR. For MNAR data, the requisite proportion of missing values from the items were randomly selected from among those item responses that were simulated to be incorrect, using a method that is common in this literature (Andreis & Ferrari, 2012; Finch, 2008; de Ayala, 2001). This would correspond to the real world situation in which an individual did not respond to an item because the answer was unknown. In that case, the fact that the item response was missing had a direct relationship to the value that it would have been MNAR. MAR data were also simulated borrowing from approaches used in previous research (Finch, 2008; Enders, 2004; de Ayala, 2001). First, the number of correct item responses was calculated for each simulee across all items in the complete dataset. Second, the simulees were divided into four groups based on the number of correct items. So, for 20 items, these groups were those with scores of 0-3, 4-7, 8-11, 12-16, and 17-20. Third, the members of each group were assigned a probability of having a missing value, with higher probabilities being associated with lower scores on the test. In other words, individuals with lower ability levels were more likely to leave the target items unanswered. The average of these probabilities equaled the overall desired probability of a missing item response (e.g., 0.05, 0.10, 0.15, and 0.30). The determination of missing values was monitored so that the overall proportion in the MAR case equaled the desired probability (e.g., 0.05, etc.) across the items. These
Unauthenticated Download Date | 1/24/18 1:44 AM
100
Julianne M. Edwards & W. Holmes Finch
data were MAR because the missingness was associated with variables for which we have measurements; i.e. the responses to the non-missing items, in the form of the total raw test score. Methods for Dealing with Missing Data. This study focused on the following missing data methods: MIJM, MICE, RFI, MICE-RFI, MICECART, and FIML. All methods were performed using R statistical software (R Development Core Team, 2015). The following R packages were used in this study: MI package for MIJM (Gelman et al., 2015), MICE package for MICE, MICE-RFI and MICE-CART (van Buuren et al., 2014), and missForest for RFI (Stekhoven, 2013). In addition to the various missing data methods, the complete dataset without any missing values was also fit with the IRT model, the results of which are included below. For MIJM and the MICE methods, 40 imputations were created. MIJM imputations were fit using the marginal normal model, and values were rounded to the nearest integer value (0 or 1). With regard to MICE, a logistic model was specified for each item, involving all of the other items as predictors. For RFI and MICE-RFI, 100 trees per iteration were used, with a bootstrap sampling of 75% of the observations and 50% of the variables. Study Outcomes. From the simulations, the Mean Absolute Error (MAE) of the discrimination and difficulty parameter estimates for the simulated items was one of the primary outcome variables in this study, as was the case in previous similar work (e.g., Glas, Pimentel, & Lamers, 2015; Holman & Glas, 2005). In addition, because MAE is expressed in the original units of the population parameter, such as difficulty or discrimination, it provides a direct measure of the mean accuracy of the estimates that can be directly interpreted in the context of the parameter. MAE for the parameters, 𝜃, was defined as: 𝑅
𝐼
𝑀𝐴𝐸 = ∑ ∑|𝜃𝑟𝑖 − 𝜃𝑖 | 𝑟=1 𝑖=1
Where 𝜃𝑖 =Data generating parameter value for item i 𝜃𝑟𝑖 =Estimate of parameter for item i in replication r In addition to MAE, the empirical standard errors of the item parameter estimates also served as study outcomes. These standard errors were calculated as the standard deviation of the item parameter estimates taken across the replications. IRT parameter estimation for a 2PL model was conducted using the ltm package in R (Rizopoulos, 2013). In order to determine which of the
Unauthenticated Download Date | 1/24/18 1:44 AM
Missing Data Imputation And Item Response Theory Parameter Estimation
101
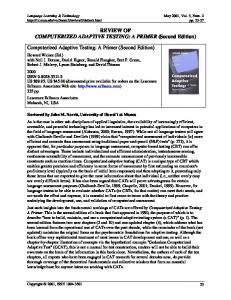
manipulated effects and their interactions were significantly related to the outcome variables, a repeated measures analysis of variance (ANOVA) was used, in which the within-subjects factor was a method for dealing with the missing data, and the between-subjects factors were the manipulated conditions described above. An effect was deemed to be important if it was both statistically significant, and had an 𝜂2 effect size of at least 0.1. This latter criterion was used in order to ensure that the main effect or interaction accounted for at least 10% of the variance in the study outcome. RESULTS Item Difficulty. The ANOVA for the MAE of item difficulty identified the 3-way interaction of missing data method by missing data type by percent of missing data as significantly related to the MAE across the items, 𝐹(14,75) = 3.781, 𝑝 < .001, 𝜂2 = 0.236). Figure 1 includes item difficulty estimate MAE by missing data method, percent missing data, and missing data type.
Figure 1: MAE of Item Difficulty Estimate by Missing Data Method, Percent Missing Data, and Missing Data Type: 2PL Model
Unauthenticated Download Date | 1/24/18 1:44 AM
102
Julianne M. Edwards & W. Holmes Finch
Figure 1 Continued: MAE of Item Difficulty Estimate by Missing Data Method, Percent Missing Data, and Missing Data Type: 2PL Model When no data were missing, MAE was never larger than 0.005, which would be expected given that the correct model was fit to the data. In the case of MAR (top panel of Figure 1), MAE increased for all methods concomitantly with a higher percentage of missing data. MICE-CART and MICE-RFI yielded the lowest MAE (other than the no missing data case), and MIJM yielded the largest MAE, followed by FIML. The greatest difference in item difficulty estimate MAE among the missing data methods for MAR data was approximately 0.08 between MIJM and MICE-RFI and MICECART for 30% missing data. From the perspective of actual item parameter estimates, these results indicate that with as much as 30% of the item responses missing due to a MAR process, item difficulty parameter estimates had higher MAE by no more than 0.1 in the worst case (MIJM), and by as little as 0.02 in the best case (MICE-RFI or MICE-CART). When data were MNAR, MAE for all methods was larger than for MAR (bottom panel of Figure 1). For MNAR data (as for MAR), the best performing methods MICE-RFI and MICE-CART, and the worst performers were FIML and MIJM. The significant 3-way interaction can be seen by examining both panels in Figure 1. For MAR data, MAE increased
Unauthenticated Download Date | 1/24/18 1:44 AM
Missing Data Imputation And Item Response Theory Parameter Estimation
103
concomitantly with higher percentages of missing data for all methods at roughly an equal rate. In contrast, under MNAR higher levels of missing data impacted the MAE of MICE-RFI and MICE-CART the least, and that of MIJM and FIML the most. With respect to the percent of missing observations, MICE and RFI performed similarly to one another in the MNAR case, with increases in MAE that were greater than those for MICERFI and MICE-CART, but not as severe as was the case for MIJM and FIML. Figure 2 contains the empirical standard errors of the item difficulty estimates for each method as a function of the percent of missing observations, the missing data method, and the type of missing data. Based upon the results in Figure 2, it is clear that the empirical standard errors of the item difficulty estimates were lower in the MAR than in the MNAR condition, for all of the methods. In addition, for each missing data method, the standard error increased concomitantly with increases in the percent of data that were simulated to be missing. The methods with the lowest empirical standard errors across both percent and type of missing data were both MICE-RFI and MICE-CART.
Figure 2: Empirical Standard Error of Item Difficulty Estimate by Missing Data Method, Percent Missing Data, and Missing Data Type: 2PL Model
Unauthenticated Download Date | 1/24/18 1:44 AM
104
Julianne M. Edwards & W. Holmes Finch
Figure 2 Continued: Empirical Standard Error of Item Difficulty Estimate by Missing Data Method, Percent Missing Data, and Missing Data Type: 2PL Model Item Discrimination. The ANOVA for MAE with respect to item discrimination parameter estimates identified the 3-way interaction of missing data method by missing data type by percent of missing data as statistically significant, F(14,75) = 5.004, 𝑝 < 0.001, 𝜂2 = 0.317). MAE values for the item discrimination estimate by missing data method, percent of missing data and missing data type appear in Figure 3.
Unauthenticated Download Date | 1/24/18 1:44 AM
Missing Data Imputation And Item Response Theory Parameter Estimation
105
Figure 3: MAE of Item Discrimination Estimate by Missing Data Method, Percent Missing Data, and Missing Data Type: 2PL Model
Unauthenticated Download Date | 1/24/18 1:44 AM
106
Julianne M. Edwards & W. Holmes Finch
Overall, the pattern of results here was very similar to that for the item difficulty estimates. MAE for item discrimination when no data were missing was very low, with values around 0.01. In addition, MAE increased for all methods when more missing data was present and was higher for MNAR versus MAR data. MICE-RFI and MICE-CART yielded lower MAE than did the other methods, regardless of the amount or type of missing data. The 3way interaction can be characterized by a more rapid increase in MAE for MIJM and FIML concomitant with an increasing percentage of missing data for MNAR than for MAR data. This differential impact of missing data type was present to a much lesser degree for the other approaches, particularly MICE-RFI and MICE-CART. As with item difficulty estimation, the best performers for both MAR and MNAR data were MICE-RFI and MICECART, and their advantage over the other methods was most evident with increasing rates of missing data in the MNAR condition. When the data were MAR, these two approaches also yielded the lowest MAE values for item discrimination, but the degree of difference between them and the other methods was less marked than for MNAR data. The empirical standard errors of the item discrimination parameter estimates by missing data method, percent and type of missing data appear in Figure 4.
Unauthenticated Download Date | 1/24/18 1:44 AM
Missing Data Imputation And Item Response Theory Parameter Estimation
107
Figure 4: Empirical Standard Error of Item Difficulty Estimate by Missing Data Method, Percent Missing Data, and Missing Data Type: 2PL Model
Unauthenticated Download Date | 1/24/18 1:44 AM
108
Julianne M. Edwards & W. Holmes Finch
As was the case for the item difficulty parameter estimates, the empirical standard errors for the item discrimination estimates were larger for higher levels of missing data, and for MNAR versus MAR data. The methods that yielded the lowest standard errors were MICE-RFI and MICE-CART, whereas the approaches with the highest standard errors were FIML and MIJM. DISCUSSION The goal of this study was to investigate the performance of recursive partitioning methods for dealing with missing data that have heretofore not been examined in the context of IRT model parameter estimation. Given the prior research, it was hypothesized that MICE-RFI and MICE-CART would be particularly useful when compared to FIML and MIJM, and indeed this is what the results presented above revealed. MICE-RFI and MICE-CART yielded the lowest MAE and empirical standard errors for both MAR and MNAR, and this superior performance was more marked with a higher percentage of missing data. When compared to one another, MICE-CART and MICE-RFI yielded very similar results across conditions when the data were MAR. The worst performers in this study were FIML and MIJM, both of which rely on fairly strong assumptions about the distribution of the item response data. The generally superior performance of MICE-CART and MICE-RFI in the current study was not a complete surprise, given that they have been shown to perform well in the context of regression modeling (Burgette and Reiter, 2010). This positive performance is very likely due to the fact that they borrow from the strengths of both MICE and recursive partitioning methodologies in creating imputed values for the missing data. MICE allows for separate probability models for each variable in the dataset, and provide multiple imputations for each missing value, thereby accounting for the uncertainty in the whole imputation process. CART and RFI are nonparametric in their estimation of missing values and allow for flexible estimation. Thus, taken together, MICE-CART and MICE-RFI yield multiple imputations for each missing value, thereby accounting for the uncertainty in the process, and do so without assuming any particular probability distribution underlying the variables. Finally, researchers using IRT in the context of missing data should expect relatively greater estimation MAE when data are MNAR, and when there is more missing data. However, the impact of these two factors was much smaller for MICE-CART and MICERFI.
Unauthenticated Download Date | 1/24/18 1:44 AM
Missing Data Imputation And Item Response Theory Parameter Estimation
109
Study limitations and directions for future research. While this research sought to fill a void in the literature on missing data and IRT estimation, with its focus on recursive partitioning imputation methods, there is still work that needs to be done. First, while the simulation conditions used were selected to represent what is seen in practice, and what has appeared in other similar simulation studies, there remains room for extensions. For example, the methods used to generate the MAR and MNAR data were only one set of such approaches. They were employed in the current study because they have been successfully used in prior research, and thus render the results of this study comparable to results from earlier work that has been published in this area. Nonetheless, other equally valid mechanisms for creating MAR missing data are available, such as linear relationships between the sum score and the probability of missingness, or linear relationships between the probability of missingness and an external variable. Future research should use one or more of these alternative approaches. Second, only models for dichotomous items were used to generate data for this study; future studies should investigate the performance of these methods for ordinal item IRT data, such as the partial credit, generalized partial credit, and graded response models. Third, interaction effects, such as those created by differential item functioning, were not included in this study. Theoretically, MICE-CART and MICE-RFI are better-equipped to handle interaction effects when compared with other methods (Doove, Van Buuren, & Dusseldorp, 2014). For this reason, future research should include such interaction effects in the context of IRT (e.g., differential item functioning). Finally, alternative methods for data imputation, including predictive mean matching (Schenker & Taylor, 1996), and the MIRT based approach described by Holman and Glas (2005) should also be considered in future research focused on missing data and IRT.
REFERENCES Ake, C. F. (2005, April). Rounding after multiple imputation with non-binary categorical covariates. Paper presented at the annual meeting of the SAS Users Group International, Philadelphia, PA. Andreis, F., & Ferrari, P. A. (2012). Missing data and parameters estimates in multidimensional item response model. Electronic Journal of Applied Statistical Analysis, 5(3), 431-437. doi: 10.1285/i20705948v5n3p431 Azur, M. J., Stuart, E. A., Frangakis, C., & Leaf, P. J. (2011). Multiple imputation by chained equations: What is it and how does it work? International Journal of Methods in Psychiatric Research, 20(1), 40-49. doi:10.1002/mpr.329 Bernaards, C. A., & Sijtsma, K. (2000). Influence of imputation and EM methods on factor analysis when item nonresponse in questionnaire data is nonignorable. Multivariate Behavioral Research, 35, 321–364. Breiman, L. (2001). Random forests. Machine Learning, 45(1), 5-32.
Unauthenticated Download Date | 1/24/18 1:44 AM
110
Julianne M. Edwards & W. Holmes Finch
Bühlmann, P., & Yu, B. (2002). Analyzing bagging. The Annals of Statistics, 30(4), 927-961. Burgette, L. F., & Reiter, J. P. (2010). Multiple imputation for missing data via sequential regression trees. American Journal of Epidemiology, 172(9), 1070-1076. doi: 10.1093/aje/kwq260 De Ayala, R. J., Plake, B. S., & Impara, J. C. (2001). The impact of omitted responses on the accuracy of ability estimation in item response theory. Journal of Educational Measurement, 38, 213–234. DeMars, C. (2002). Incomplete data and item parameter estimates under JMLE and MML estimation. Applied Measurement in Education, 15, 15–31. Doove, L. L., Van Buuren, S., Dusseldorp, E. (2014). Recursive partitioning for missing data imputation in the presence of interaction effects. Computational Statistics and Data Analysis, 72, 92 – 104. Eisemann, N., Waldmann, A., & Katalinic, A. (2011). Imputation of missing values of tumour stage in population-based cancer registration. BMC Medical Research Methodology, 11(129). doi:10.1186/1471-2288-11-129 Enders, C. K. (2001). A primer on maximum likelihood algorithms available for use with missing data. Structural Equation Modeling, 8(1), 128-141. Enders, C. K. (2004). The impact of missing data on sample reliability estimates: Implications for reliability reporting practices. Educational and Psychological Measurement, 64, 419–436. Enders, C. K., & Bandalos, D. L. (2001). The relative performance of full information maximum likelihood estimation for missing data in structural equation models. Structural Equation Modeling, 8(3), 430-457. Finch, H. (2008). Estimation of item response theory parameters in the presence of missing data. Journal of Educational Measurement, 45, 225-245. Gelman. A., Hill, J., Su, Y-S., Yajima, M., Pittau, M., Goodrich. B., …, Kropko, J. (2015). mi: Missing data imputation and model checking. R package version 1.0. Blas, C.A.W., Pimentel, J.L., & Lamers, S.M.A. (2015). Nonignoralbe data in IRT models: Polytomous Responses and Response Propsensity Models with Covariates. Psychological Test and Assessment Modeling, 57(4), 523-541. Glas, C. A. W., & Pimentel, J. (2008). Modeling nonignorable missing data in speeded tests. Educational and Psychological Measurement, 68, 907-922. Graham, J. W. (2003). Adding missing-data-relevant variables to FIML-based structural equation models. Structural Equation Modeling: A Multidisciplinary Journal, 10(1), 80-100. Graham, J. W., Olchowski, A. E., & Gilreath, T. D. (2007). How many imputations are really needed? Some practical clarifications of multiple imputation theory. Prevention Science, 8(3), 206-213. doi: 10.1007/s11121-007-0070-9 Hastie, T., Tibshirani, R., Friedman, J. (2001). The elements of statistical learning: data mining, inference and prediction. New York: Springer. Holman, R., & Glas, C. A. W. (2005). Modeling non-ignorable missing-data mechanisms with item response theory models. British Journal of Mathematical and Statistical Psychology, 58(1), 1-17. doi: 10.1111/j.2044-8317.2005.tb00312.x Huisman, M., & Molenaar, I. W. (2001). Imputation of missing scale data with item response models. In A. Boomsma, M. A. J. van Duijn, & T. A. B. Snijders (Eds.), Essays on item response theory (pp. 221–244). New York: Springer. Iacus, S. M., & Porro, G. (2007). Missing data imputation, maching and other application of random recursive partitioning. Computational Statistics and Data Analysis, 52, 773789.
Unauthenticated Download Date | 1/24/18 1:44 AM
Missing Data Imputation And Item Response Theory Parameter Estimation
111
Leite, W., Beretvas, S. N. (2010). The performance of multiple imputation for likert-type items with missing data, Journal of Modern Applied Statistical Methods, 9(1), 64-74. Lord, F. M. (1974). Estimation of latent ability and item parameters when there are omitted responses. Psychometrika, 39, 247-264. Ludlow, L. H., & O’Leary, M. (1999). Scoring omitted and not reached items: Practical data analysis implications. Educational and Psychological Measurement, 59, 615-630. Nonyane, B. A. S., & Foulkes, A. S. (2007). Multiple imputation and random forests (mirf) for unobservable, high dimensional data. The international Journal of Biostatistics, 3(1). doi: 10.2202/1557-4679.1049 Nydick, S.W. (2014). catIrt: An R package for simulating IRT-based computerized adaptive tests. R package, version 0.5-0. Pantanowitz, A., & Marwala, T. (2009). Evaluating the impact of missing data imputation. In Advanced data mining and applications (pp. 577-586). Springer Berlin Heidelberg. Peng, C.-Y. J., & Zhu, J. (2005, April). Comparison of two methods for handling missing covariates in logistic regression. Paper presented at the annual meeting of the American Educational Research Association, Montreal, PQ. R Development Core Team. (2015). R: A language and environment for statistical computing. Vienna, Austria: R Foundation for Statistical Computing. Rizopoulos, D. (2013). Ltm: Latent Trait Models under IRT. R package version 1.0-0. Rubin, D. B. (1987). Multiple imputation for nonresponse in surveys. New York: Wiley. Schafer, J. L. (1997). Analysis of incomplete multivariate data. Boca Raton, FL: Chapman and Hall/CRC. Schafer, J. L., & Graham, J. W. (2002). Missing data: Our view of the state of the art. Psychological Methods, 7, 147–177. Schafer, J. L., & Olsen, M. K. (1998). Multiple imputation for multivariate missing data problems: A data analyst’s perspective. Multivariate Behavioral Research, 33, 545– 571. Schenker, N. and Taylor, J.M.G. (1996). Partially Parametric Techniques for Multiple Imputation. Computational Statistics and Data Analysis, 22, 425-446. Shah, A. D., Bartlett, J. W., Carpenter, J., Nicholas, O., Hemingway, H. (2014). Comparison of random forest and parametric imputation models for imputing missing data using MICE: A CALIBER study. American Journal of Epidemiology, 179(6), 764-774. doi: 10.1093/aje/kwt312 Stekhoven, D. J. (2013). missForest: Nonparametric missing value imputation using random forest. R package version 1.4. Stekhoven, D. J., Bühlmann, P. (2011). MissForest – non-parametric missing value imputation for mixed-type data. Bioinformatics, 28(1), 112 – 118. doi:10.1093/bioinformatics/btr597. van Buuren, S., & Groothuis-Oudshoorn, K. (2011). mice: Multivariate imputation by chained equations in R. Journal of statistical software, 45(3), 1-67. van Buuren, S., & Oudshoorn, K. (1999). Flexible multivariate imputation by mice. Leiden, The Netherlands, TNO prevention and Health. TNO report PG/VGZ/99.054 Wolkowitz, A. A., Skorupski, W. P. (2013). A method for imputing response options for missing data on multiple-choice assessments. Educational and Psychological Measurement, 73(6), 1036 – 1053. doi: 10.1177/0013164413497016
Unauthenticated Download Date | 1/24/18 1:44 AM
112
Julianne M. Edwards & W. Holmes Finch
APPENDIX Item difficulty In addition to simulating data from the 2PL model, the 3PL model was also investigated in the current study. Given the general similarity of the results for this more complex model, and in the interest of limiting the length of the main body of the manuscript, a summary of the 3PL results is presented in this appendix. Figure A1 displays the MAE of the item difficulty estimates by the type of missing data, the percent of missing data, and the missing data method. As was true with the 2PL model, MAE increased in value for all of the methods along with increases in the percentage of missing data. In addition, MAE was larger when the data were MNAR than when they were MAR. Finally, the MICE-RFI and MICE-CART approaches were associated with the lowest MAE values, whereas FIML and MIJM were associated with the largest MAE. Finally, when compared with the MAE results for the 2PL model (Figure A1), it appears that across conditions there was somewhat greater MAE in the 3PL estimates, across simulated conditions.
Figure A1: MAE of Item Difficulty Estimate by Missing Data Method, Percent Missing Data, and Missing Data Type: 3PL Model
Unauthenticated Download Date | 1/24/18 1:44 AM
Missing Data Imputation And Item Response Theory Parameter Estimation
113
Figure A1 Continued: MAE of Item Difficulty Estimate by Missing Data Method, Percent Missing Data, and Missing Data Type: 3PL Model The empirical standard error of the item difficulty estimates by the percent and type of missing data, and the missing data methods appear in Figure A2. The standard errors of the item difficulty estimates were higher for the 3PL data than was the case for the 2PL model (Figure A2) across missing data methods. In other respects, the pattern of results for the 3PL model were very similar to those for the 2PL, with larger item difficulty estimate standard errors with greater missing data, and MNAR data. MICERFI and MICE-CART yielded the lowest standard errors of the missing data methods studied here.
Unauthenticated Download Date | 1/24/18 1:44 AM
114
Julianne M. Edwards & W. Holmes Finch
Figure A2: Empirical Standard Error of Item Difficulty Estimate by Missing Data Method, Percent Missing Data, and Missing Data Type: 3PL Model
Unauthenticated Download Date | 1/24/18 1:44 AM
Missing Data Imputation And Item Response Theory Parameter Estimation
115
Item discrimination The MAE of the item discrimination parameter estimates by type of missing data, percent missing data, and missing data method for the 3PL model appear in Figure A3. As was true for the item difficulty estimates, discrimination MAE values under the 3PL condition were higher than for 2PL data. In addition, MICE-CART and MICE-RFI exhibited lower MAE than did the other methods, with all techniques having greater values for more missing data, and for MNAR versus MAR data.
Figure A3: MAE of Item Discrimination Estimate by Missing Data Method, Percent Missing Data, and Missing Data Type: 3PL Model
Unauthenticated Download Date | 1/24/18 1:44 AM
116
Julianne M. Edwards & W. Holmes Finch
Figure A3 Continued: MAE of Item Discrimination Estimate by Missing Data Method, Percent Missing Data, and Missing Data Type: 3PL Model The empirical standard error of the item discrimination estimates for the 3PL data, by the missing data method, type of missing data, and percent of missing data appear in Figure A4. These results follow the same pattern as those that were in evidence for the 2PL data (Figure A4). Namely, larger percentages of missing data, and an underlying MNAR missing data mechanism were associated with larger standard errors. In addition, of the missing data methods studied here, MICE-RFI and MICE-CART yielded the lowest standard error values. Finally, the standard errors for the 3PL data were larger than those in the 2PL case across missing data methods.
Unauthenticated Download Date | 1/24/18 1:44 AM
Missing Data Imputation And Item Response Theory Parameter Estimation
117
Figure A4: Empirical Standard Error of Item Discrimination Estimates by Missing Data Method, Percent Missing Data, and Missing Data Type: 3PL Model Manuscript received: 9 June 2017; accepted: 6 December 2017)
Unauthenticated Download Date | 1/24/18 1:44 AM