c 2008 Institute for Scientific ° Computing and Information
INTERNATIONAL JOURNAL OF NUMERICAL ANALYSIS AND MODELING Volume 5, Supp , Pages 17–35
MULTISCALE FEATURE DETECTION IN UNSTEADY SEPARATED FLOWS GUONING CHEN, ZHONGZANG LIN, DANIEL MORSE, STEPHEN SNIDER, SOURABH APTE, JAMES LIBURDY, AND EUGENE ZHANG Abstract. Very complex flow structures occur during separation that can appear in a wide variety of applications involving flow over a bluff body. This study examines the ability to detect the dynamic interactions of vortical structures generated from a Helmholtz instability caused by separation over bluff bodies at large Reynolds number of approximately 104 based on a cross stream characteristic length of the geometry. Accordingly, two configurations, a thin airfoil with flow at an angle of attack of 200 and a square cylinder with normally incident flow are examined. A time-resolved, three-component PIV data set is collected in a symmetry plane for the airfoil, whereas direct numerical simulations are used to obtain flow over the square cylinder. The experimental data consists of the velocity field, whereas simulations provide both velocity and pressure-gradient fields. Two different approaches analyzing vector field and tensor field topologies are considered to identify vortical structures and local, swirl regions. The vector field topology uses (1) the Γ function that maps the degree of rotation rate (or pressure-gradients) to identify local swirl regions, and (2) Entity Connection Graph (ECG) that combines the Conley theory and Morse decomposition to identify vector field topology consisting of fixed points (sources, sinks, saddles) and periodic orbits, together with separatrices (links connecting them). The tensor field feature uses (1) the λ2 method that examines the gradient fields of velocity or pressure-gradient to identify local regions of pressure minima, and (2) tensor field feature that decomposes the velocity-gradient or pressure Hessian tensor into isotropic scaling, rotation, and anisotropic stretching parts to identify regions of high swirl. The vectorfield topology requires spatial integration of the velocity or pressure-gradient fields and represents a global descriptor of vortical structures. The tensor field feature, on the other hand, is based on gradients of the velocity of pressuregradient vectors and represents a local descriptor. A detailed comparison of these techniques is performed by applying them to velocity or pressure-based data and using spatial filtered data sets to identify the multiscale features of the flow. It is shown that various techniques provide useful information about the flow field at different scales that can be used for further analysis of many fluid engineering problems of practical interest. Key Words. Vortex detection, separated flows, multiscale feature detection, turbulence, LES/DNS, vector field topology, tensor field feature.
1. Introduction The ability to detect discrete flow structures in fluid flow environments is of growing interest to a wide variety of applications. For instance, large scale flow 17
18
G. CHEN, Z. LIN, D. MORSE, S. SNIDER, S. APTE, J. LIBURDY, AND E. ZHANG
structures such as swirling, high shear rates regions and vortical structures are thought to be controlling mechanisms for chaotic mixing, unsteady pressure fields that influence fluid-surface interactions, transport in multiphase flows, and a host of other applications. A robust means of developing an understanding of how these flow structures develop, evolve, decay, and interact is of fundamental importance. To achieve this goal there needs to be a quantitative measure of the relevant flow structures. This quantitative measure should also allow for spatial distinction among structures and a means of tracking such structures in the space and time domains. Since there may be many different views on what is a flow structure, there is a wide range of defining conditions for said structures. This results in a number of possible ways of detecting the desired flow structure. The unifying requirement of the detection schemes is that they provide a quantitative measure in a complex flow environment that defines the extent of the structure elements with an acceptable spatial and temporal resolution. In this study the goal is to identify flow structures that are generated as a result of flow separation that occurs during flow over a bluff body. Such flow separation is indicative of a Kelvin-Helmhotz shearing instability [1, 2, 3] which results in a rollup along a highly concentrated vortex sheet (or high shear region). Flows of this nature are extremely important in determining the dynamic loading on structures, in aerodynamic flight conditions, and drag forces on man-made vehicles or animals in motion. Presented are results for two such bodies, a thin airfoil at a high angle of attack (angle between the airfoil chord and flight direction is large causing leading edge flow separation) and a square cross section object with separation at both the front and trailing edges. The flow patterns associated with both bodies are illustrated later in this paper, but the common element of concern for these flows is that the flow separation generates large swirling flow structures that are convected downstream as they change in size, shape and intensity. 2. Related Work Traditionally, flow analysis involving turbulence and unsteady coherent structures that may be imbedded within the broad spectrum of turbulence has been based on collecting one-point and two-point statistics. However, there is a large and growing literature on swirl and vortical flow detection methods [4, 5, 6, 7]. Proper Orthogonal Decomposition (POD) [6], the λ2 (second eigenvalue) method [4, 8], and the Γ function [9, 7], among others, have been proposed and typically used for flow analysis. Specific identification of vortex structures (or pressure minima) [4, 8, 9] and correlating vortex shedding to leading edge separation [3], have been applied. In addition to these, novel approaches developed in the scientific visualization community based on vector and tensor field visualization and topology extraction provide an alternative means to extract flow structure features [10, 11]. Recent advances in vector field topology focus on features such as fixed points, periodic orbits, and separatrices [12, 13, 14, 15, 16] in two-dimensions, which have been extended to three-dimensional steady state [17, 18, 19], and time-dependent flows [20, 21, 22, 23], respectively. To address noise in the data sets, various flow simplification algorithms have been proposed that are either topology-based [14, 24, 16] or purely geometric [25]. Symmetric tensor field analysis has also been well investigated in two-dimensions [26]. The basic constituents of tensor field topology, the wedges and trisectors have been identified in 2D, symmetric, secondorder tensors. By tracking their evolution over time, these features can be combined to form more familiar field singularities (i.e. fixed points) such as saddles, nodes,
MULTISCALE FEATURE DETECTION
19
centers, or foci [26]. This work has been extended to three-dimensions [27, 28, 29] and to time-varying tensor fields [30]. Tensor field simplification techniques have also been developed [31, 32]. Analysis of asymmetric tensor fields such as the velocity gradient has been performed [33, 34]. Zhang et al. [34] propose to perform topological analysis on the eigenvalues and eigenvectors of the velocity gradient to explore flow features such as regions of compression, dilation, rotation, and stretching, which leads to tensor field feature extraction. In this work, the vector field topology and tensor field feature extraction techniques will be applied to flow data sets and compared with the traditional approaches based on the Γ and λ2 methods. Furthermore, comparison of velocity-based and pressure-gradient based data and application of various feature extraction methods is performed to illustrate the potential of each technique when applied to different data sets.
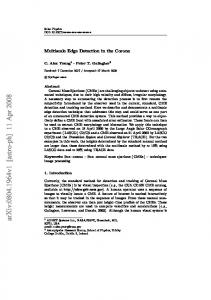
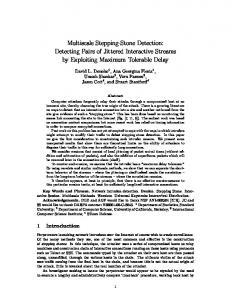
Figure 1. Time-resolved PIV data in the symmetry plane obtained at the OSU wind tunnel. (a) A close up view of the flow separation near the leading edge at 200 angle of attack, (b-c) time history of axial and vertical velocity signals, respectively, at x = 17.1 and y = 15 mm, (d-e) the corresponding power density spectra showing a broadband spectrum and time scales. In this study two data sets have been selected to explore the capabilities of flow structure detection during separation, shown in Figures 1–2. Figure 1 shows experimentally obtained velocity components in a two dimensional plane along the centerline of a wing in a moderate Reynolds number (Re = 6 × 10⁴ based on the chord length). This data set was obtained using particle image velocimetry and represents a snapshot of the velocity field with a vector resolution of 0.684mm in a total field of field of 54 mm×47 mm. The wing is at a 200 angle of attack (chord line relative to flow direction) and as such experiences a leading edge separation. The flow structures developing from this separation are of interest as they are convected downstream. The energy spectrum associated with the leading edge region shows a broadband spectrum and is typical of these separated flows. Figure 2 shows a snapshot of a computational simulation of flow over a square cylinder at Re ≈ 10, 000 based on the inlet velocity (U∞ = 1.5 m/s), the cube size (L = 0.1 m and the fluid kinematic viscosity (ν = 15 × 10−6 m2 /s). A threedimensional simulation is performed with Dirichlet conditions at the inlet, a slip condition at the top and bottom surfaces, periodic conditions in the spanwise direction, and a convective boundary condition for the outlet. The direct numerical simulation is performed based on a colocated grid, fractional step algorithm [35, 36, 37] to collect the velocity and pressure data in space and time. The flow solver has been validated with available experimental data for a variety of flow configurations involving separated turbulent flows and swirling regions [38, 39, 36, 37]. Also shown
20
G. CHEN, Z. LIN, D. MORSE, S. SNIDER, S. APTE, J. LIBURDY, AND E. ZHANG
in Figure 2 are the variations of mean axial velocity and turbulent kinetic energy in the vertical directions at three different sections. The flow separates at the leading edge corners and forms an oscillatory wake downstream giving rise to large scale vortical structures containing large levels of turbulent kinetic energy.
Figure 2. Direct numerical simulation of flow over a square cylinder at Re = 10, 000. (a) the velocity vector field in the symmetry plane, (b) mean axial velocity variation in y-direction at midpoint of the top surface of the cylinder (c), one-length and (d) two-length downstream from the trailing edge, (e-g) the turbulent kinetic energy variations in the y-direction at corresponding sections. These two data sets were selected for a number of reasons. They both represent leading edge flow separation with significant vortical flow structure development. Both flows are at a reasonably high Reynolds number to assure a range of scales of motion and energy. Consequently, the robust nature of the vortex detection scheme can be evaluated for these multiscale flow fields. In addition, in order to determine the ability to extract those vortical scales within a specified size or energy range a high, low or band pass filtering can be applied to the data set. Here we illustrate this by using a Gaussian filter to generate both a high and low pass filtered data set which is then analyzed using the various detection schemes. Also, there is a fundamental difference between experimentally and computationally obtained data sets. In general the computational simulation will contain both velocity and pressure field results over the full extent of the field of interest, while the experimental set will be limited to a velocity vector field (usually in two dimensions, and rarely more than two components). Consequently, experimental data sets lack the ability to use the pressure and/or the full dimensional field and its possible gradients as an indicator variable, or feature descriptor. As discussed below, several indicator variables are explored in this paper to assess the ability and distinctions of different variables to detect vortical flow structures. The paper is arranged as follows. In the following section, the various flow analysis techniques are described in detail. These include both the vector field (velocity or pressure gradient) and tensor field (velocity gradient or Hessian of pressure) analyses. These techniques are then applied to the airfoil and square cylinder data sets and compared to assess the similarities and differences of all detection schemes in identifying vortical flow features. In addition, flow structures associated with scale separation are investigated by applying high and low-pass
MULTISCALE FEATURE DETECTION
21
filters to the original data sets. The computational data set is used to compare velocity-based and pressure-gradient based data. 3. Flow Analysis Techniques In this section, we describe a number of existing flow descriptors and compare their effectiveness in multi-scale analysis of flows with separation and vortices. These descriptors can be roughly divided into two categories: global and local, based on the techniques used to compute them. The global descriptors include the Γ-function and Entity Connection Graph (ECG) [16], both of which are derived from a vector field (velocity or pressure gradient) and requires integration over a region surrounding the point of interest. In contrast, the local descriptors, such as the λ2 method and eigenvalue and eigenvector topology [34], are based on the gradient of a vector field. 3.1. Global Descriptors. In the following subsections, global descriptors based on a vector field such as the velocity or pressure-gradient are described. 3.1.1. The Γ-Function. A Γ function [9] has been proposed as a swirl strength parameter and used by one of the co-authors [7] to study pulsed jet in crossbow. This method is based on a direct measure of the local swirl tendency of the flow field by calculating the vector orientation of the feature descriptor relative to a local radius vector at a given point within the flow field. Using the velocity vector U M in the x − y plane as the feature descriptor the swirl strength, Γ, is determined within a local grid area AM by: ¡ ¢ Z b P M × U M · ZdA 1 ¡ ¢ (1) Γ(x, y) = AM AM kP M kkU M k where Zb is a unit vector pointing out of the (x, y)-plane, and P M is the position vector of point M within the integration stencil and the point P . This is equivalent to the summation of the sine of the angle between the velocity vector at points within the area AM and the position vector from these points to the position (x, y). Consequently, it is a measure of the local swirl strength filtered by the selection of the area AM . Because of the local normalization, the swirl can be detected within regions of large dynamic range of velocity, which is advantageous in a separated flow region. Note that the traditional definition of Γ function is based on the velocity vector. In order to define a similar feature detector based on the pressure-gradient vector, a new function denoted as Γp is defined as: ³ ´ 0 Z b P M × P · ZdA M 1 ³ ´ (2) Γp (x, y) = 0 AM AM kP M kkP k M
0
where P M = −(∇p)⊥ is the pressure gradient field rotated by 900 in the anticlockwise direction. The pressure gradient normal to the radial vector centered at a given point within the flow is used, and is integrated about area Am in a similar manner as shown above for the velocity vector. In this case the swirl indication is based on a local low pressure region which is scaled by the area averaged pressure gradient aligned toward a specific location within the flow. The area of integration is selected based on the spatial scale of interest.
22
G. CHEN, Z. LIN, D. MORSE, S. SNIDER, S. APTE, J. LIBURDY, AND E. ZHANG
3.1.2. Entity Connection Graph (ECG). Vector field topology in two-dimensions consists of fixed points (sources, sinks, saddles) and periodic orbits, Figure 3), together with separatrices (links connecting them). The fixed points identify specific flow features and the separatrices provide possible paths and correlations between spatially varying structures. These entities and their interconnection can be represented by a graph called Entity Connection Graph (ECG) [16]. Note that the fixed points and periodic orbits are the nodes in the ECG and separatrices are the edges. In addition, a periodic orbit can be connected directly to a source, sink, or another periodic orbit. The ECGs of vector fields (for example, velocity and pressure gradient) can be used to identify specific flow features (such as vortex centers etc.).
Figure 3. Schematic of vector field topology: (a) source, (b) sink, (c) saddle, (d) attracting and (e) repelling periodic orbits. Mathematically, a vector field can be expressed in terms of a differential equation x˙ = V (x). The set of solutions to it gives rise to a flow on the underlying domain M ; that is a continuous function ϕ : R × M → M satisfying ϕ(0, x) = x, for all x ∈ M , and (3)
ϕ(t, ϕ(s, x)) = ϕ(t + s, x)
for all x ∈ M and t, s ∈ R. Given x ∈ M , its trajectory is (4)
ϕ(R, x) := ∪t∈R ϕ(t, x).
S ⊂ M is an invariant set if ϕ(t, S) = S for all t ∈ R. Observe that for every x ∈ M , its trajectory is an invariant set. Other simple examples of invariant sets include the following. A point x ∈ M is a fixed point if ϕ(t, x) = x for all t ∈ R. More generally, x is a periodic point if there exists T > 0 such that ϕ(T, x) = x. The trajectory of a periodic point is called a periodic orbit. Consideration of the important qualitative structures associated with vector fields on a surface requires familiarity with hyperbolic fixed points, period orbits and separatrices. Let x0 be a fixed point of a vector field x˙ = V (x); that is V (x0 ) = 0. The linearization of V about x0 , results in a 2 × 2 matrix Df (x0 ) which has two (potentially complex) eigenvalues σ1 + iµ1 and σ2 + iµ2 . If σ1 6= 0 6= σ2 , then x0 is called a hyperbolic fixed point. Observe that on a surface there are three types of hyperbolic fixed points: sinks σ1 , σ2 < 0, saddles σ1 < 0 < σ2 , and sources 0 < σ1 , σ2 . Systems with invariant sets such as periodic orbits are considered and the definition of the limit of a solution with respect to time is non-trivial. The alpha and omega limit sets of x ∈ M are α(x) := ∩t0 cl(ϕ((t, ∞), x))
MULTISCALE FEATURE DETECTION
23
respectively. A periodic orbit O is attracting if there exists ² > 0 such that for every x which lies within a distance ² of O, ω(x) = O. A repelling periodic orbit can be similarly defined (α(x) = O)). Finally, given a point x0 ∈ M , its trajectory is a separatrix if the pair of limit sets (α(x), ω(x)) consist of a saddle fixed point and another object that can be a source, a sink, or a periodic orbit. Figure 4 provides an example vector field (left). Fixed points are highlighted by colored dots (sources: green; sinks: red; saddles: blue). Periodic orbits are colored in green if repelling and in red if attracting. Separatrices that terminate in a source or a repelling periodic orbit are shown in green and those terminate in a sink or an attracting periodic orbit are colored in red.
Figure 4. An example vector field (left) and its ECG [16] (right). The vector field contains a source (green), three sinks (red), three saddles (blue), a repelling periodic orbit (green), and two attracting periodic orbits (red). Separatrices that connect a saddle to a repeller (a source or a periodic orbit) are colored in green, and to an attractor (a sink or a periodic orbit) are colored in red. The fixed points and periodic orbits are the nodes in the ECG and separatrices are the edges.
3.2. Local Descriptors. The gradient of a vector field is an asymmetric tensor field, and the topological and geometric analysis of the vector gradient can provide additional insights to the understanding of the vector field itself. Here a wellknown technique, the λ2 method, as well as a newly developed descriptor based on the eigenvalue topology [34] are applied to the experimental and numerical data sets. 3.2.1. The λ2 Method. The local swirl within a flow can be determined based on a local pressure minimum by assessing the gradient fields of either velocity or pressure, this is designated as the λ2 method. Jeong and Hussain [4] provide a thorough discussion of the various criteria and argue that the Hessian of pressure be used to identify local pressure minima, and hence the vortex core. The equations of motion for an incompressible, Newtonian fluid with constant viscosity are given by the Navier-Stokes equations: (5)
∂ ∂ui + (ui uj ) = ∂t ∂xj
−
1 ∂P ∂ 2 ui +ν ρ ∂xi ∂xj ∂xj
24
G. CHEN, Z. LIN, D. MORSE, S. SNIDER, S. APTE, J. LIBURDY, AND E. ZHANG
where ui represents the components of the velocity vector, P the pressure field, and ν the kinematic viscosity. In addition, the velocity field must satisfy the divergence free constraint uj,j = 0 for an incompressible fluid. Taking the gradient of the Navier-Stokes equation results in the relationship shown below between the pressure Hessian and the velocity gradient tensor separated into its symmetric and antisymmetric parts, Sij and Ωij , respectively, · ¸ · ¸ DSij DΩij 1 (6) + Sik Skj + Ωik Ωkj + + Ωik Skj + Sik Ωkj = − P,ij +νui,jkk , Dt Dt ρ | {z } | {z } symmetric
antisymmetric
where Sij = (ui,j + uj,i )/2 and Ωij = (ui,j − uj,i )/2. A direct measure of the local pressure minimum can be obtained by evaluation of the eigenvalues of the pressure Hessian (P,ij ). Upon ordering the eigenvalues, a positive second eigenvalue, denoted here as λ2,p expresses a local minimum. AlterDS natively, if the advective ( Dtij ) and viscous terms (νui,jkk ) of the above gradient equation are assumed small, the strain and rotation tensors, Sij and Ωij , can be used to relate the effects of the local pressure minimum. Noting that the second bracket of the equation is identically zero (it is the well-known vorticity transport equation [4]), this method examines the eigenvalues of the remaining terms on the left hand side by using the velocity gradient fields and represents an estimation of the pressure Hessian (P,ij ). This is denoted as λ2 . The majority of the works in turbulent, separated flow use the λ2 method mainly because the velocity field can be directly measured in laboratories and hence its gradients can be obtained. However, detailed measurement of the pressure field in a region is usually not performed. In numerical simulations, both the velocity and pressure fields are computed and allows computation of different measures of swirl strengths. By examining the results using both the λ2 and λ2,p it is possible to assess the detection sensitivities based on the velocity-based versus pressuregradient based fields. In this case the exclusion of the convective and viscous terms can be evaluated. 3.2.2. Tensor Field Feature: The Eigenvalue Manifold (EM). The feature of an asymmetric tensor field consists of the features of its eigenvalues and eigenvectors. In two-dimensional cases, Zhang et al. [34] define the concepts of Eigenvalue Manifold and Eigenvector Manifold, which allow the topological characterization of an arbitrary tensor field T . In the present work, we only focus on the eigenvalue feature of the velocity gradient tensor and the Hessian of the pressure. This characterization is based on the following reparameterization of the set of all 2 × 2 tensors, (7)
µ ¶ µ a b 1 = γd c d 0
¶ µ 0 0 + γr 1 1
¶ µ −1 cos θ + γs 0 sin θ
sin θ − cos θ
where p (a − d)2 + (b + c)2 c−b a+d , γr = γs = (8) γd = 2 2 2 are the strengths of isotropic scaling, rotation, and anisotropic stretching, respectively. For unit tensors, i.e., γd2 + γr2 + γs2 = 1, the eigenvalue manifold is defined as
MULTISCALE FEATURE DETECTION
(9)
25
{(γd , γr , γs )|γd2 + γr2 + γs2 = 1 and γs ≥ 0}
Notice that if the tensor T is the velocity gradient ui,j , then the strengths of the tensor fields become: µ ¶ µ ¶ 1 ∂v ∂u 1 ∂u ∂v + ; γr = − γd = 2 ∂x ∂y 2 ∂x ∂y sµ ¶2 µ ¶2 1 ∂u ∂v ∂u ∂v − + + , γs = 2 ∂x ∂y ∂y ∂x where u and v are the velocity components in the x and y directions, respectively. In a two-dimensional flow, γd is identically zero for an incompressible fluid due to the divergence-free constraint on the velocity field, whereas for a three-dimensional flow γd = −1/2 (∂w/∂z) and represents the mass flux in the z direction. The positive and negative values of the isotropic scaling thus represent expansion and contraction of fluid elements in the other direction. Similarly, γr represents the vorticity in the z-direction. The anisotropic stretching strength γs represents the rate of angular deformation and is related to regions of high shear. By decomposing the tensor into isotropic scaling, rotation, and anisotropic stretching parts, it is possible to identify regions of high swirl.
Figure 5. Representative flows corresponding to special scenarios on the eigenvalue manifold.
Figure 6. Schematic of the five extremal situations in the Eigenvalue manifold of a tensor. In general, there are five special points in the Eigenvalue manifold that represent the extremal situations: (1) positive scaling (γd = 1, γr = γs = 0), (2) negative scaling (γd = −1, γr = γs = 0), (3) counterclockwise rotation (γr = 1, γd = γs = 0), (4) clockwise rotation (γr = −1, γd = γs = 0), and (5) anisotropic stretching (γs = 1, γd = γr = 0). These are shown in the Figure 5.
26
G. CHEN, Z. LIN, D. MORSE, S. SNIDER, S. APTE, J. LIBURDY, AND E. ZHANG
Figure 6a illustrates the eigenvalue manifold along with the aforementioned special configurations. These configurations lead to a partition of the Eigenvalue manifold based on the spherical geodesic distance. Given two unit vectors v1 and v2 , the spherical geodesic distance between them is the dot product 1 − v1 · v2 . The partition of the Eigenvalue manifold in turn leads to segmentation of the domain into five types of regions: (1) Counter-clockwise rotation dominated region: CCW R = {(x, y)|γr > max(γs , |γd |)} (2) Clockwise rotation dominated region: CW R = {(x, y)|−γr > max(γs , |γd |)} (3) Positive isotropic scaling dominated region: P ISR = {(x, y)|γd > max(γs , |γr |)} (4) Negative isotropic scaling dominated region: N ISR = {(x, y)| − γd > max(γs , |γr |)} (5) Anisotropic stretching dominated region: ASR = {(x, y)|γs > max(|γd |, |γr |)} The resulting diagram is illustrated in Figure 6b, in which the boundaries of these regions are highlighted in magenta. The feature of a tensor field with respect to eigenvalues consists of points in the domain whose tensor values map to the boundaries between the Voronoi cells in the eigenvalue manifold. 4. Computation of Local and Global Descriptors Computation of the global descriptors such as Γ & Γp and local descriptors such as λ2 and λ2,p is fairly straightforward for both experimental and computational data sets. Once the velocity and pressure gradient fields are obtained these descriptors are extracted at each data-points and can be applied to multiple frames to evaluate the temporal evolution. In this study, data analysis is shown for only one particular time instant. Evaluation of the vector field topology (ECG) and the tensor field feature needs description. The data sets provided by the experiments or simulation at particular grid nodes are first triangulated. The feature extraction domain is a triangular mesh in either a planar domain or a curved surface. The vector or tensor field is defined at the vertices only. To obtain values at a point on the edge or inside a triangle, a piecewise interpolation scheme is used. For planar domains, this is the well known piecewise linear interpolation scheme [30]. On surfaces, the scheme of Zhang et al. [24, 32] that ensures vector and tensor field continuity in spite of the discontinuity in the surface normal is used. 4.1. Extracting ECG (or vector field topology). Vector field topology for two-dimensional flows consists of fixed points, periodic orbits, and separatrices. An ECG is used to represent vector field topology [16]. To construct an ECG for a vector field represented on a triangular mesh, fixed points such as sources, sink, and saddles are first located and classified based on linearization inside each triangle. Next, periodic orbits are extracted by identifying regions of recurrence in the flow. In the third step, separatrices are computed by tracing streamlines from the saddles in their respective incoming and outgoing directions. This provides edges in the ECG that connect saddles to sources, sinks, and periodic orbits. Finally, edges in the ECG that directly connect between sources, sinks, and periodic orbits are determined by following the forward and reverse directions near periodic orbits that have not been reached by any separatrices. See Chen et al. [16] for details. 4.2. Extracting tensor field feature (Eigenvalue Manifold (EM)). Tensor field feature is computed according to the algorithm of Zhang et al. [34]. Given a tensor field T , the following computation is first performed for every vertex.
MULTISCALE FEATURE DETECTION
27
(1) Repamaterization, in which γd , γr , γs , and θ are computed. (2) Normalization, in which γd , γr , and γs are scaled to ensure γd2 +γr2 +γds = 1. (3) Eigen-analysis, in which the eigenvalues and eigenvectors are computed. Next, the feature of the tensor field with respect to the eigenvalues is extracted. This is done by visiting every edge in the mesh to locate possible intersection points with the boundary curves of the Voronoi cells shown in Figure 6. The intersection points are then connected whenever appropriate. The current implementation of the tensor field feature extraction is on a single processor and is memory and computation intensive. However, parallelization of the approach is possible and straightforward. 5. Results The results of the flow detection schemes described previously were evaluated for the two data sets: (i) experimentally obtained two dimensional velocity field around a thin wing at a fixed angle of attack, and (ii) data in the symmetry plane from direct numerical simulation of the velocity and pressure fields for flow around a square cylinder. Both vector and tensor field topologies are extracted from the data set. The experimental data is limited to velocity field, and comparison of the vector (Γ and ECG) and tensor field topologies (λ2 and eigenvalue manifold) are performed. In addition, the original data set is analyzed using low-pass and highpass filtering to extract features at different scales. Accordingly, any flow variable f can be written as f = f˜ + f 0 , where f˜ and f 0 represent the low-pass and highpass filtered data, respectively. A Gaussian filtering operation is used to obtain the low-pass data: µ 2 ¶ Z 1 x + y2 (10) f˜(x, y) = (f · G) dA; G(x, y) = exp − 2πσ 2 2σ 2 A where σ represents the filter width. In this work, the filtered width used is four times the local grid resolution. The DNS data set for flow over a square cylinder was evaluated using velocity-based and pressure-gradient based feature extraction techniques. The original data was filtered using the same filtering operation and only the low-pass filtered data is analyzed and presented here. This data set is used to compare the vector and tensor-field topologies based on the velocity and pressure-gradient fields. 5.1. Airfoil Data. The wing flow field analysis is shown in Figure 7, where each row shows the flow features obtained from Γ, ECG, λ2 , and tensor-field eigenvalue topology, respectively. Each column represents the same feature extraction techniques applied to the original, low-pass and high-pass filtered data sets. Γ Function: The Γ function results (Figure 7a-c) illustrate the detection of well defined swirl that are separated into two main regions, the upper region is a clockwise (negative values) rotating stream that begins at the leading edge of the wing. This represents a flow instability that is generated by this localized separation which is then convected downstream. Below this region, very near the wing surface is a companion region of counterclockwise (positive values) rotating flow. Taken together these regions form a stream of clearly identified counter rotating vortices. The low pass filtered data (Figure 7b) shows apparent smoothing and the stream boundaries are well defined. The high pass filtered data (Figure 7c), on the other hand, shows discrete swirling flow regions of small spatial extent with a much more irregular pattern. Also, remnants of the two main counter rotating streams can be
28
G. CHEN, Z. LIN, D. MORSE, S. SNIDER, S. APTE, J. LIBURDY, AND E. ZHANG
determined amongst the more randomly positioned swirling vortical flow elements. This shows that the filtered data analysis is capable of detecting smaller scale swirl contained within the larger flow structures. Note that the Γ-function is obtained by performing spatial integration of the flow quantities (equation 1) at each grid location and represents a global detector. However, by separating the length scales over which the velocity field changes (high and low-pass filter), the small scale and large-scale vortical features can be captured. By varying the filter width, a correlation between the flow feature and the filterwidth can be obtained to identify the multiscale nature of the turbulent fluid flow.
40
0.4
35
40
40 0.3
35
0.2
0.2 30
0.1
30
0.8 35
0.6
30
0.4
0 25
0
25
−0.1
25
20
−0.2
20
−0.2
20
0.2 0 −0.2
−0.3 15
15
−0.4
−0.4 10 5
−0.5
10 −0.6 5
10
15
20
25
30
35
40
45
50
15
−0.4
10
−0.6 −0.8
−0.6 5
5
10
15
20
25
30
35
40
45
5
50
5
10
15
20
25
30
35
40
45
50
(a) Γ (original)
(b) Γ (low pass)
(c) Γ (high pass)
(d) ECG of u (original)
(e) ECG (low pass)
(f ) ECG (high pass)
40
2000
35
40
300
40
35
250
35
500
400
1500
30
30
30 200
25
25 150 20
20
200
100
15
500
10 5
300
25
1000 20
5
10
15
20
25
30
35
40
45
50
0
15
15 100
10
50
10
5
0
5
5
10
15
20
25
30
35
40
45
50
5
10
15
20
25
30
35
40
45
50
(g) λ2 (original)
(h) λ2 (low pass)
(i) λ2 (high pass)
(j) EM of ui,j (original)
(k) EM (low pass)
(`) EM (high pass)
Figure 7. A comparison of various techniques for feature extraction applied to the experimental data set of flow over an airfoil with 200 angle of attack.
0
MULTISCALE FEATURE DETECTION
29
ECG: Figures 7d–f show the vector field topology (ECG) for the original and filtered data sets. The ECGs are shown on top of the flow textures [40] derived from the data sets. For the ECGs shown, sources are represented as green dots, sinks red dots, and saddles blue dots. The separatrices are the colored curves connecting the fixed points (green line connects a saddle to a source, and red line connects the saddle to a sink). For the time-instant shown, no periodic orbits are visible. The connectivity between the fixed points indicate the spatial extent of the various flow events and their interactions. For example, in Figure 7d the two saddles (blue) near the leading edge show connection with the sources (green) on the downstream surface of the wing. This indicates how the flow patterns stretch and evolve through the flow and how surface effects are correlated to flow events far from the surface. For this flow data, the low-pass filtered ECG does not show any sources, saddles or periodic orbits. One sink is detected in the downstream region. On the other hand, the high-pass filtered data shows a number of fixed points inside and outside the separated flow region. The separatrices show the link between the fixed points. It is observed that inside the separated flow region, the extent of the separatrices is large, indicating that the fixed points detected are correlated with distant flow events. However, outside the separated region (in the free-stream), the flow features are closely correlated by more local events. This vector-field based feature extraction technique shows similar vortical features as the Γ function. This connectivity information is crucial for multiscale energy cascade mechanisms observed in many turbulent flows. By investigating the statistical nature of fixed points and their correlations, the path associated with energy transfer from large-scale to small scale flow structures can be identified. λ2 Method: Figures 7g–i show the tensor field feature as detected by the λ2 method. As described in the previous section, the λ2 method is associated with gradient of the vector-field (velocity in this case) and identifies local effects. Consequently, the original data set indicates clockwise rotating flow away from the airfoil surface, similar to the Γ-function. However, it is clear that the Γ-function is able to display well defined swirl flow pattern. While the λ2 method does detect the strong clockwise rotating flow stream, it only weakly detects the counterclockwise rotation near the surface. Furthermore, the high pass filtered data set does indicate the clockwise stream as a series of small vortical flow elements, in contrast to the high pass data analysis using the Γ function which shows this stream as a nearly continuous region (blue streak) in Figure 7c. These small vortical flow elements seem to be similar to the fixed points identified by the high-pass filtered ECG technique. Eigenvalue Manifold (EM):. Figures 7j–` show the eigenvalue feature for the original, low-pass and high-pass filtered data sets. Results show strong clockwise rotation (green) along the same region as that detected in the Γ and λ2 methods. In addition, the near surface region shows a strong counterclockwise rotation (red) coupled with positive isotropic scaling (yellow). This is consistent with the previous methods with essentially the same spatial distribution. It is apparent that the flow over the airfoil is dominated by rotation. Note that the flow is three-dimensional, although the data analyzed is 2D in the x − y plane. Accordingly, as shown earlier, the positive and negative scaling represent mass-flux through the x − y plane. The blue and yellow regions of the tensor field feature thus indicate that strong flux in the z-direction. It can be seen that the clockwise and counterclockwise
30
G. CHEN, Z. LIN, D. MORSE, S. SNIDER, S. APTE, J. LIBURDY, AND E. ZHANG
rotation regions are separated by positive or negative scaling, representing local three-dimensional effects. The low pass data sets show that the main swirling streams are well detected providing information on the larger flow structures. The high pass filtered data, as in the case of the λ2 method, now indicate the small scale flow features with only a slight trace of the larger events. In general, the high pass filtering process allows the detection of the smaller and usually weaker flow events and provides, in this case, a means of examining the extent of low energy background flow events. 5.2. Square Cylinder Data. Figures 8a–h indicate the vector and tensor field feature techniques applied to the planar data for flow over a square cylinder obtained from the direct numerical simulations. Note that the actual computations are full three-dimensional, however, only the two-dimensional data in the symmetry plane is analyzed. For the square cylinder, only the low-pass filtered data is shown. The goal of this analysis is to compare the various techniques when applied to the velocity-based and pressure-gradient based data sets. Γ and Γp : Figures 8a–b compare the Γ and Γp contours for the square cylinder. Both techniques identify the flow separation and swirling regions clearly. The flow separates at the corners of the leading edge. The top corner creates clockwise rotation whereas the bottom-one shows counter-clockwise rotation. The separated flow evolves over the cube surface and a strong wake region is visible downstream of the cylinder. Both techniques identify a strong, clockwise rotation in the wake of the cylinder. It is apparent that the pressure-gradient based Γp identifies more features than the velocity based Γ contours. This may be attributed to the fact that Γp is based on (−∇P ), and thus can capture the variations in flow velocity on a smaller scale (local grid size) compared to the velocity vector-based topology. ECG: Figure 8c–d compares the vector field topology as obtained from the velocity and pressure-gradient fields, respectively. Again, similar swirling patterns as observed by the Γ and Γp contours are visible. In this data set sources (green), sinks (red), saddles (blue) and periodic orbits (attracting are red circles) are clearly visible. In addition, the separatrices connecting the fixed points are also shown. Again, the pressure-gradient based topology identifies more fixed points than the velocity field. However, the main vortical structures are identified by both. For example, the large circulation in the wake region (just behind the cylinder) is identified by green dots (source). For the velocity-based ECG, the separatrices show circular paths spiraling around the source. The pressure-gradient based ECG, however, shows lines emanating from the source. This can be explained by considering a simple case of Rankine vortex (a combination of forced and free vortices): ½ ¾ ωa2c vθ = ωr, r ≤ ac ; , r > ac , r where ac is the radius of the core of the vortex, ω is the angular rotation associated with the vortex, r is the radial direction, and vθ is the tangential velocity. The pressure gradient field inside the vortex core is simply given as ∂p/∂r = ρω 2 r. The pressure thus increases with increase in r and the gradient is truly radial. Thus, in a pure vortical flow, the pressure gradient lines are perpendicular to the velocity vector. The separatrices obtained from the pressure-gradient based ECG are seen to be approximately perpendicular to those obtained from the velocity-based ECG
MULTISCALE FEATURE DETECTION
(a) Γ
(b) Γp
(c) ECG of u
(d) ECG of (∇p)
31
400 343
0.1
286 229 171
0
114 57 0
-0.1 -0.6
-0.5
-0.4
-0.3
-0.2
(e) λ2
(f ) λ2,p
(g) EM of ui,j
(h) EM of P,ij
Figure 8. Comparison of the velocity-based and pressuregradient based flow descriptors for flow over a square cylinder simulated using direct numerical simulation. Shown is the symmetry plane with a close-up view of the flow field near the square.
(see for example in the wake region). This is indicative of a strong vortical region. The extent of the separatrices roughly scales with the size of the vortical structure.
32
G. CHEN, Z. LIN, D. MORSE, S. SNIDER, S. APTE, J. LIBURDY, AND E. ZHANG
λ2 and λ2,p : Figures 8e–f show the λ2 contours obtained based on the velocitygradient and pressure-Hessian tensors. As mentioned earlier, these tensor field topologies identify locally, strong regions of swirl. Accordingly, strong swirl regions are obtained near the leading edge corners and also in the wake regions. The pressure Hessian based λ2,p shows similar regions of swirl. The contours are more spotty owing to the fact that the topology obtained is based on second derivatives of the pressure. As discussed in the previous sections, the λ2 contours try to find pressure minima based on the velocity-gradient based tensor. The temporal, convective, and viscous effects are assumed small to approximately locate the pressure minima. In the λ2,p approach, all effects are retained and consequently can locate the vortical regions more accurately. Eigenvalue Manifold (EM):. Finally, Figures 8g–h show the tensor field topologies obtained from the velocity gradient and pressure Hessian tensors, respectively. The velocity-gradient eigenvalue manifold shows clockwise rotation (green) and counterclockwise rotation (red) regions on the top and bottom surfaces of the cylinder. The wake of the cylinder is dominated by rotation. At the center of the leading edge of the cylinder is a stagnation point representing strong deceleration of the flow, represented by anisotropic stretching. Similarly, outside region of the separated flow is also dominated by anisotropic stretching. The tensor feature shows small regions of positive and negative scaling (blue and yellow regions) and indicate that the flow is mostly two-dimensional. The eigenvalue manifold of pressure Hessian is shown in Figure 8h. Note that pressure Hessian (P,ij ) is analyzed, whereas, (−P,ij ) appears in the equation 6. Accordingly, regions of positive scalings (yellow) in the pressure Hessian correspond to low-pressure regions. This is because in the vicinity of a local minimum of the pressure, the pressure gradient is pointing away from the minimum thus making the minimum a source in the pressure gradient. The flow field, however, is driven by −∇P and is towards the vortex center. Similarly, a local maximum in the pressure corresponds to a sink in the pressure gradient (the stagnation point on the leading edge), which resides inside regions of negative scalings (blue). 6. Conclusion In this work, various techniques, based on vector and tensor fields, to identify multiscale features in turbulent, separated flows were analyzed in detail. These techniques are classified into global and local flow descriptors. The global descriptors are based on spatial integration of flow parameters and thus extract large-scale features. The local techniques are based on the spatial derivatives of flow parameters and identify flow features on the scale of the grid size used to define the flow field. These flow feature extraction techniques were applied to two data sets: (i) experimental velocity field data of flow over a thin airfoil at 200 angle of attack, and (ii) direct numerical simulation based data of velocity and pressure-gradient fields for flow over a square cylinder. Both data sets were obtained at flow Reynolds number on the order of 104 based on the characteristic size of the bluff body. At these Reynolds numbers, the flow separates and large vortical structures are obtained that convect downstream. The goal of this work was to detect these structures at different scales and compare various techniques. Two different flow parameters were analyzed. The velocity and pressure-gradient fields were used to obtain the vector field topologies. Two techniques called the
MULTISCALE FEATURE DETECTION
33
Γ function and the Entity Connection Graph (ECG) were used to deduce the vector field topology. The Γ function maps the degree of rotation rate (or pressuregradients) to identify local swirl regions, and the ECG combines the Conley theory and Morse decomposition to identify vector field topology consisting of fixed points, periodic orbits, and separatrices connecting them. For both data sets the two techniques detected similar flow features. The Γ function was able to provide the strength associated with the vortical structure. The ECG identified recurrent flow features (i.e. fixed points and periodic orbits) in the flow and the separatrices showed the links between these features. The extent of a separatrix connecting two features was found to be roughly proportional to the scale of the vortex. From the numerical simulations, the pressure-gradient based topology was obtained and indicated more flow features compared to the velocity-based analysis. The connectivity information between fixed points or vortex centers as provided by the separatrices is an important feature that can be further used to analyze the multiscale energy cascade mechanisms observed in many turbulent flows. For tensor-field feature the velocity-gradient and pressure Hessian were analyzed. The λ2 and eigenvalue manifold based techniques were applied to identify the swirling regions. It was observed that the tensor-field feature was capturing vortical structures on the small scale, whereas the extent of the vortices and large-scale features were observed in the vector field topology (Γ and ECG). The eigenvalue manifold decomposed the tensor field into rotation, isotropic scaling, and anisotropic stretching regions indicative of the local flow characteristics. By identifying these regions, it is possible to better understand the dynamics of the separated flows. Future work will investigate the temporal evolution of the flow features in detail. Acknowledgments This work represents a collaborative effort at OSU between the experimental and computational analysis of fluid flow in Mechanical Engineering and scientific visualization in Computer Science. The work is partially supported by NSF, AFOSR, and ONR. James Liburdy and Daniel Morse thank AFOSR for partial support under the grant FA-9550-05-0041. Sourabh Apte and Stephen Snider thank ONR and Dr. Ki-Han Kim for partial support under the grant N000140610697. Eugene Zhang, Guoning Chen, and Zhongzang Lin thank NSF for the partial support under the NSF CAREER grant CCF-0546881. Computations were performed on the San Diego Supercomputing Center’s Datastar machine. References [1] Y. Hoarau, M. Braza, Y. Ventikos, D. Faghani, and G. Tzabiras, Organized modes and the three dimensional transition to turbulence in the incompressible flow around a NACA0012 wing, J. Fluid Mech., vol. 496, pp. 63–72, 2003. [2] H. Nishimura and Y. Taniike, Aerodynamic characteristics of fluctuating forces on a circular cylinder, J. Wind Eng., Ind. Aerodynamics, vol. 89, pp. 713–723, 2001. [3] C. Sicot, S. Auburn, S. Loyer, and P. Devinant, Unsteady characteristics of the static stall of an airfoil subjected to freestream turbulence level up to 16%, Exp. in Fluids, vol. 41, pp. 641–648, 2006. [4] J. Jeong and F. Hussain, On the identification of a vortex, J. Fluid Mech., vol. 285, pp. 69–94, 1995. [5] S. Burgmann and C. Brucker and W. Schroder, Scanning PIV measurements of a laminar separation bubble, Exp. Fluids, vol. 41, pp. 319–326, 2006. [6] C. Weiland and P. Vlachos, Analysis of the Parallel Blade Vortex Interaction with Leading Edge Blowing Flow Control Using the Proper Orthogonal Decompositions, Proceedings FEDSM2007, Joint ASME/JSME Fluids Engineering Conf. July, San Diego, 2007.
34
G. CHEN, Z. LIN, D. MORSE, S. SNIDER, S. APTE, J. LIBURDY, AND E. ZHANG
[7] B. Dano and J. Liburdy, Vortical structures of a 450 inclined pulsed jet in crossflow, AIAA 2006-3542, Fluid Dynamics Conf., San Francisco, CA, 2006. [8] R. Adrian and K. Christiansen and Z. Liu, Analysis and interpretation of instantaneous velocity fields, Exp. Fluids, vol. 41, pp. 319–326, 2000. [9] L. Graftieaux and M. Michard and N. Grosjean, Combining PIV, POD and vortex identification algorithms for the study of unsteady turbulent swirling flows, Meas. Sci. Tech., vol. 12, pp. 1422–1429, 2001. [10] R. S. Laramee, H. Hauser, H. Doleisch, F. H. Post, B. Vrolijk, and D. Weiskopf, The State of the Art in Flow Visualization: Dense and Texture-Based Techniques, Computer Graphics Forum, vol. 23, no. 2, pp. 203–221, 2004. [11] R. S. Laramee, H. Hauser, L. Zhao, F. H. Post, Topology Based Flow Visualization: The State of the Art, The Topology-Based Methods in Visualization Workshop (TopoInVis 2005), 2006. [12] J. L. Helman and L. Hesselink, Visualizing Vector Field Topology in Fluid Flows, IEEE Computer Graphics and Applications, vol. 11, no. 3, pp. 36–46, 1991. uger and M. Menzel and A. P. Rockwood, Visualizing Nonlinear [13] G. Scheuermann and H. Kr¨ Vector Field Topology, IEEE Transactions on Visualization and Computer Graphics, vol. 4, no. 2, pp. 109–116, 1998. [14] X. Tricoche and G. Scheuermann, “Continuous Topology Simplification of Planar Vector Fields,” Proceedings IEEE Visualization 2001, pp. 159–166, 2001. [15] Konrad Polthier and Eike Preuß, 2003, Identifying Vector Fields Singularities using a Discrete Hodge Decomposition, Mathematical Visualization III, Ed: H.C. Hege, K. Polthier, Springer Verlag, pp 112-134. [16] G. Chen, K. Mischaikow, R. S. Laramee, P. Pilarczyk, and E. Zhang, Vector Field Editing and Periodic Orbit Extraction Using Morse Decomposition, IEEE Transactions on Visualization and Computer Graphics, vol. 13, no. 4, pp. 769–785, 2007. [17] A. Globus and C. Levit and T. Lasinski, A Tool for Visualizing the Topology of ThreeDimensional Vector Fields, Proceedings IEEE Visualization ’91, pp. 33–40, 1991. [18] H. Theisel, T. Weinkauf, H.-C. Hege, and H.-P. Seidel, Saddle Connectors–An Approach to Visualizing the Topological Skeleton of Complex 3D Vector Fields, Proceedings IEEE Visualization 2003, pp. 225–232, 2003. [19] K. Mahrous, J. C. Bennett, G. Scheuermann, B. Hamann, and K. I. Joy, “Topological segmentation in three-dimensional vector fields,” IEEE Transactions on Visualization and Computer Graphics, vol. 10(2), pp. 198–205, 2004. [20] X. Tricoche and T. Wischgoll and G. Scheuermann and H. Hagen, Topology Tracking for the Visualization of Time-Dependent Two-Dimensional Flows, Computers & Graphics, vol. 26, no. 2, pp. 249–257, 2002. [21] H. Theisel and H.-P. Seidel, “Feature Flow Fields,” in Proceedings of the Joint Eurographics - IEEE TCVG Symposium on Visualization (VisSym 03), pp. 141–148, 2003. [22] H. Theisel, T. Weinkauf, H.-C. Hege, and H.-P. Seidel, “Stream Line and Path Line Oriented Topology for 2D Time-Dependent Vector Fields,” Proceedings IEEE Visualization 2004, pp. 321–328, 2004. [23] C. Garth, X. Tricoche, and G. Scheuermann, Tracking of Vector Field Singularities in Unstructured 3D Time-Dependent Datasets, Proceedings IEEE Visualization 2004, pp. 329–335, 2004. [24] E. Zhang, K. Mischaikow, and G. Turk, Vector Field Design on Surfaces, ACM Transactions on Graphics, vol. 25, no. 4, pp. 1294–1326, 2006. [25] Y. Tong, S. Lombeyda, A. Hirani, and M. Desbrun, Discrete Multiscale Vector Field Decomposition, ACM Transactions on Graphics (SIGGRAPH 2003), vol. 22, no. 3, pp. 445–452, 2003. [26] T. Delmarcelle and L. Hesselink, The Topology of Symmetric, Second-Order Tensor Fields, Proceedings IEEE Visualization ’94, 1994. [27] L. Hesselink, Y. Levy and Y. Lavin, The Topology of Symmetric, Second-Order 3D Tensor Fields, IEEE Transactions on Visualization and Computer Graphics, vol. 3, no. 1, pp. 1–11, 1997. [28] X. Zheng and A. Pang, Topological Lines in 3D Tensor Fields, Proceedings IEEE Visualization ’04, pp. 313–320, 2004. [29] X. Zheng and B. Parlett and A. Pang, Topological Structures of 3D Tensor Fields, Proceedings IEEE Visualization 2005, pp. 551–558, 2005.
MULTISCALE FEATURE DETECTION
35
[30] X. Tricoche, G. Scheuermann, and H. Hagen, Tensor Topology Tracking: a Visualization Method for Time-Dependent 2D Symmetric Tensor Fields,” in Computer Graphics Forum 20(3) (Eurographics 2001), Sept. 2001, pp. 461–470. [31] X. Tricoche, G. Scheuermann, and H. Hagen, Topology Simplification of Symmetric, SecondOrder 2D Tensor Fields, Hierarchical and Geometrical Methods, Springer, 2003. [32] E. Zhang, J. Hays, and G. Turk, Interactive Tensor Field Design and Visualization on Surfaces, IEEE Transactions on Visualization and Computer Graphics, vol. 13, no. 1, pp. 94–107, 2007. [33] X. Zheng and A. Pang, 2D Asymmetric Tensor Analysis, IEEE Proceedings on Visualization, pp. 3–10, Oct 2005. [34] E. Zhang, H. Yeh, Z. Lin, and R. S. Laramee, Asymmetric Tensor Analysis for Flow Visualization, IEEE Transactions on Visualization and Computer Graphics, to appear, http://web.engr.orst.edu/∼zhange/images/asymtend.pdf. [35] K. Mahesh, G. Constantinescu, and P. Moin, A new time-accurate finite-volume fractionalstep algorithm for prediction of turbulent flows on unstructured hybrid meshes, J. Comp. Phy., vol. 197, pp. 215–240, 2004. [36] K. Mahesh, G. Constantinescu, S. Apte, G. Iaccarino, F. Ham, and P. Moin, Large-eddy simulation of reacting turbulent flows in complex geometries, ASME J. App. Mech., vol. 438, pp. 101–128, 2006. [37] P. Moin and S. Apte, Large eddy simulation of multiphase reacting flows in complex combustors, AIAA J. (special issue on ‘Combustion Modeling and LES: Development and Validation Needs for Gas Turbine Combustors), vol. 44, pp. 698–710, 2006. [38] Apte, S. V., Mahesh, K., Moin, P., & Oefelein, J.C., 2003a, Large-eddy simulation of swirling particle-laden flows in a coaxial-jet combustor. Int. J. Mult. Flow 29, 1311-1331. [39] Apte, S.V., Mahesh, K., & Lundgren T., 2007 Accounting for Finite-Size Effects in Simulations of Two-Phase Flows Int. J. Multiphase Flow accepted for publication. [40] J. J. van Wijk, Image based flow visualization, in ACM Transactions on Graphics (SIGGRAPH 02), vol. 21, no. 3, Jul 2002, pp. 745–754. School of Electrical Engineering and Computer Science Oregon State University Corvallis, OR 97331 E-mail:
[email protected] URL: http://oregonstate.edu/∼cheng/ School of Electrical Engineering and Computer Science Oregon State University Corvallis, OR 97331 E-mail:
[email protected] School of Mechanical, Industrial, & Manufacturing Engineering Oregon State University Corvallis, OR 97331 E-mail:
[email protected] School of Mechanical, Industrial, & Manufacturing Engineering Oregon State University Corvallis, OR 97331 E-mail:
[email protected] School of Mechanical, Industrial, & Manufacturing Engineering Oregon State University Corvallis, OR 97331 E-mail:
[email protected] URL: http://me.oregonstate.edu/people/faculty/therm fluid/apte.html School of Mechanical, Industrial, & Manufacturing Engineering Oregon State University Corvallis, OR 97331 E-mail:
[email protected] URL: http://web.engr.oregonstate.edu/∼liburdy/ School of Electrical Engineering and Computer Science Oregon State University Corvallis, OR 97331 E-mail:
[email protected] URL: http://web.engr.orst.edu/∼zhange