extrapolated from the solution of the microscale model at these points and significant .... by Sulsky and co-workers for solid mechanics problems based on the ...
9 Multiscale Particle-In-Cell Method: From Fluid to Solid Mechanics Alireza Asgari1 and Louis Moresi2
2School
1School
of Engineering, Deakin University, of Mathematical Sciences, Monash University, Australia
1. Introduction In this chapter, a novel multiscale method is presented that is based upon the Particle-InCell (PIC) finite element approach. The particle method, which is primarily used for fluid mechanics applications, is generalized and combined with a homogenization technique. The resulting technique can take us from fluid mechanics simulations seamlessly into solid mechanics. Here, large deformations are dealt with seamlessly, and material deformation is easily followed by the Lagrangian particles in an Eulerian grid. Using this method, solid materials can be modeled at both micro and macro scales where large strains and large displacements are expected. In a multiscale simulation, the continuum material points at the macroscopic scale are history and scale dependent. When conventional Finite Elements are used for multiscale modeling, microscale models are assigned to each integration point; with these integration points usually placed at Gaussian positions. Macroscale stresses are extrapolated from the solution of the microscale model at these points and significant loss of information occurs whenever re-meshing is performed. In addition, in the case of higherorder formulations, the choice of element type becomes critical as it can dictate the performance, efficiency and stability of the multiscale modeling scheme. Higher-order elements that provide better accuracy lead to systems of equations that are significantly larger than the system of equations from linear elements. The PIC method, on the other hand, avoids all of the problems that arise from element layout and topology because every material point carries material history information regardless of the mesh connectivity. Material points are not restricted to Gaussian positions and can be dispersed in the domain randomly, or with a controlled population and dispersion. Therefore, in analogy to Finite Element Method (FEM) mesh refinement, parts of the domain that might experience localization can have a higher number of material points representing the continuum macroscale in more detail. Similar to the FEM multiscale approach, each material point has a microscale model assigned and information passing between the macro and micro scales is carried out in a conventional form using homogenization formulations. In essence, the homogenization formulation is based on finding the solution of two boundary value problems at the micro and macro scales with information passing between scales. Another advantage of using the particle method is that each particle can represent an individual material property, thus in the microscale phase, interfaces can be followed without the
186
Advanced Methods for Practical Applications in Fluid Mechanics
numerical overhead associated with the contact algorithms while material points move. Moreover, the PIC method in the macro and microscale tracks material discontinuities and can model highly distorted material flows. Here we aim to build and investigate the applicability of the PIC method in a multiscale framework. Three examples that showcase a fluid approach to model solid deformation are presented. The first numerical experiment uses a viscoelastic-plastic material that undergoes high strains in shear. The material is considered to be in a periodic domain. The initial orientation, the high-strain configuration and the softening of the shear bands are studied with very high resolutions using PIC method. This is a situation where a conventional FE approach could be very expensive and problematic. The second example is the simulation of the global system of tectonic plates that form the cool upper boundary layer of deep planetary convection cells. Creeping flow in the mantle drives the plates and helps to cool the Earth. This is an unusual mode of convection, not only because it takes place in a solid silicate shell, but also because a significant fraction of the thickness of the cold boundary layer (the lithosphere) behaves elastically with a relaxation time comparable to the overturn time of the system (Watts et al. 1980). In modeling this system, we need to account for Maxwell viscoelastic behavior in the lithosphere as it is recycled into the Earth’s interior. The lithosphere undergoes bending, unbending, and buckling during this process, all the while being heated and subjected to stress by the mantle flow. A Maxwell material has a constitutive relationship which depends upon both the stress and the stress rate. The stress rate involves the history of the stress tensor along particle trajectories. PIC approaches are an ideal way to approach this problem. For a full discussion, see (Moresi et al. 2003). The last example presented in this chapter is on the simulation of forming process of Advanced High Strength Steels (AHSS). These are materials with multiphase microstructure in which microstructure has a pronounced effect on the forming and spring-back of the material. The contribution of this chapter is on the illustration of the PIC method in solid mechanics through examples that include large strain deformation of viscoelastic-plastic materials as well as multiscale deformation of elastoplastic materials.
2. Particle-based method: An alternate to FE method Particle methods are result of attempts to partially or completely remove the need for a mesh. In these methods, an approximation to the solution is constructed strictly in terms of nodal point unknowns (Belytschko et al. 1996). The domain of interest is discretized by a set of nodes or particles. Similar to FEM, a shape function is defined for each node. The region in the function’s support, usually a disc or rectangle, is called the domain of influence of the node (Belytschko et al. 1996). The shape function typically has two parameters, providing the ability to translate and dilate the domain of influence of a shape function. The translation parameter allows the function to move around the domain, replacing the elements in a meshed method. The dilation parameter changes the size of the domain of influence of the shape function, controlling the number of calculations necessary to find a solution. As the dilation parameter becomes larger, larger time steps can be taken. A set of basis functions also needs to be defined for a given problem. The principle advantage of a particle method is that the particles are not treated as a mesh with a prescribed connectivity. Therefore, mesh entanglement is not a problem and large deformations can be treated easily with these methods. Creating new meshes and mapping between meshes is eliminated. Refinement can be obtained by simply adding points in the
Multiscale Particle-In-Cell Method: From Fluid to Solid Mechanics
187
region of interest (Liu et al. 2004). It should be noted that most of these methods use a mesh to perform integration. However, this mesh can be simpler than would be needed for standard element-based solutions. Another advantage of the particle method is that there is no need to track material interfaces, since each particle has its own constitutive properties (Benson 1992). There are also difficulties in using particle methods. One of the major disadvantages of these methods is their relatively high computational cost, particularly in the formation of the stiffness matrix. The support of a shape function generally overlaps surrounding points unlike standard FE shape functions. In fact, the support of the kernel function must cover a minimum number particles for the method to be stable (Chen et al. 1998). The bandwidth of the stiffness matrix is increased by the wider interaction between nodes. There is a more irregular pattern of the sparsity, since the number of neighbors of a given point can vary from point to point. Thus, the number of numerical operations in the formation and application of these matrices increases. Additionally, higher-order shape and basis functions are usually used, with the result that higher-order integrations are required. Construction of these shape functions is also costly (Chen et al. 1998). Another problem is that overlapping shape functions are not interpolants (Belytschko et al. 2001); even the value of a function at a nodal point must be computed from the contributing neighbors. This requirement makes essential boundary conditions more difficult to apply. Some techniques that have been developed to address this problem are Lagrange multipliers, modified variational principles, penalty methods and coupling to FEMs (Belytschko et al. 2001). However, there can also be difficulties with using these techniques. For example, the Lagrange multiplier method requires solution of an even larger system of equations. In addition, Lagrangian multipliers tend to destroy any structure, such as being banded or positive definite, that the system might exhibit (Belytschko et al. 2001). The modified variational approach applies boundary conditions of a lower order of accuracy. Coupling to FEMs by using particle methods only in regions with large deformations and FEMs elsewhere in the problem can reduce the cost of the solution. However, the shape functions at the interface become quite complicated and require a higher order of quadrature (Belytschko et al. 2001). Another method (Chen et al. 1998) first uses the map from nodal values to the function space to get nodal values of the function, then applies the boundary conditions, and then transforms back to nodal values. Many of these codes have been restricted to static problems. Chen has developed a dynamic code, but all of the basis functions are constructed in the original configuration (Chen et al. 1998). Like their meshed counterparts, particle methods are useful for certain types of problems. However, because of their higher computational cost, they are not the method of choice for some types of problems. The PIC method, also known as Material Point Method (MPM), combines some aspects of both meshed and meshless methods. This method was developed by Sulsky and co-workers for solid mechanics problems based on the Fluid-Impact-Particle (FLIP) code, which itself was a computational fluid dynamics code (Sulsky et al. 1995). Sulsky et al. (Sulsky et al. 1995) initially considered application of MPM to 2D impact problems and demonstrated the potential of MPM. Later in 1996, Sulsky and Schreyer (Sulsky and Schreyer 1996) gave a more general description of MPM, along with special considerations relevant to axisymmetric problems. The method utilizes a material or Lagrangian mesh defined on the body under investigation, and a spatial or Eulerian mesh defined over the computational domain. The advantage here is that the set of material
188
Advanced Methods for Practical Applications in Fluid Mechanics
points making up the material mesh is tracked throughout the deformation history of the body, and these points carry with them a representation of the solution in a Lagrangian frame. Interactions among these material points are computed by projecting information they carry onto a background FE mesh where equations of motion are solved. Furthermore, the MPM does not exhibit locking or an overly stiff response in simulations of upsetting (Sulsky and Schreyer 1996). In MPM, a solid body is discretized into a collection of material points, which together represent the body. As the dynamic analysis proceeds, the solution is tracked on the material points by updating all required properties, such as position, velocity, acceleration, stress, and temperature. At each time step, the material point information is extrapolated to a background grid, which serves as a computational scratch pad to solve the equilibrium equations. The solution on the grid-nodes is transferred using FE shape functions, on the material points, to update their values. This combination of Lagrangian and Eulerian methods has proven useful for solving solid mechanics problems involving materials with history dependent properties, such as plasticity or viscoelastic effects. The key difference between The PIC method developed by Moresi et al. and the classical MPM is the computation of updated particle weights which differ from the initial particle mass. This gives much improved accuracy in the fluid-deformation limits especially for incompressible flows (Moresi et al. 2003). This method is amendable to efficient parallel computation and can handle large deformation for viscoelastic materials. In the next section, we explain how this method is combined with the localization and homogenization routines to build a multiscale PIC method suitable solid mechanics applications.
3. Numerical formulation 3.1 Incremental iterative algorithm The stiffness matrix term is assembled over all cells ( = stiffness matrix of each cell is =
) in the model where the
Ω
(1)
In equation (1) is a fourth order tensor that must be calculated by the appropriate constitutive equations at the particle level. In calculation of the global stiffness matrix, the effect of initial stresses (or nonlinear geometrical effects) must be considered. This is achieved by selecting a proper reference frame and adding nonlinear strain-displacement terms to the calculation of equation (1). We choose to use an Updated Lagrangian reference frame to build the global stiffness matrix. For simplicity, a quasi-static condition is considered. Therefore, the linearized system of equations takes the following form (
) =
+
−
(2)
Similar to FEM matrix and vector assembly, Equation (2) in extended form can be written as
υ+
υ u=
−
υ
(3)
In equation (3), and are linear and nonlinear strain-displacement matrices and the external forces are contributions of body forces and tractions
189
Multiscale Particle-In-Cell Method: From Fluid to Solid Mechanics
=
s+
υ
(4)
In Equations (2)-(4), terms are referenced to time t and t+∆t, whereas if the Total Lagrangian frame were in use, terms with reference to time zero and should have been taken into account. Similarly, the global internal force vector is assembled over all cells (Δ = Δ ). The difference between the internal and external force vectors is the residual, or out-of-balance, term: =Δ
−Δ
(5)
then the current increment ( + 1) is in equilibrium and the simulation If < can move forward to the next increment, otherwise the system of linear equation is modified such that iterative displacements can be found from = .
(6)
With each new iterative displacement solution , the above procedure is repeated until the is satisfied (convergence is achieved). The preceding algorithm is the criteria of < standard incremental-iterative algorithm, which can be used for both macro and micro scale simulation. The important factor to consider in the multiscale PIC is the coupling between these two scales and the constitutive relations at each scale. Constitutive equations of different phases at the microscale are defined using a conventional continuum mechanics approach for elastoplastic materials. 3.2 Integration using particles Following the works of Moresi et al. (2003), the sampling points for integration of field variables in our multiscale PIC method are matched with the material points embedded in the macro scale model. These integration points are not fixed like Gauss points. Therefore, their positions are not known in advance and an adaptive scheme with the procedure outlined in the numerical implementation of Moresi et al. (2003) is used. The integral in Equation (1) results in a system of linear equations with unknown displacements on nodes with the element stiffness matrix =∑
(
)
(
)
(7)
where is the number of particles with weight in a cell. is the usual linear straindisplacement tensor in FE. The fourth order tensor is the stiffness matrix of the material at any arbitrary point P. The core significance of the multiscale PIC method lies in the way is calculated and obtained. In single scale methods, the constitutive equations are used to build this matrix. However, we use microscale homogenization, also known as multi level FE, to build this tensor as described shortly. An incremental iterative solution strategy of full Newton-Raphson (N-R) is used to solve the linearized equations of motion for nodal data in an implicit manner (Guilkey and Weiss 2003). The effect of initial stress and nonlinear geometric effect (e.g. due to mismatch between material properties of particles) is taken into account by addition of a nonlinear term to the stiffness matrix in equation (7). In all of the analyses, a quasi-static situation is assumed and all body and surface forces are represented by the external loads. After finding the incremental displacement, the strain and deformation gradient for each particle are calculated and used for the macro-micro coupling.
190
Advanced Methods for Practical Applications in Fluid Mechanics
3.3 Elastoplastic solid deformation In continuum and fluid mechanics, the underlying microscopic mechanisms are complex but simplified at the macroscale level. In multiscale PIC, classical elastoplasticity is used as the constitutive relations for the microscale phases. Transformation from the undeformed configuration at pseudo time to the current configuration at pseudo time is described by a deformation gradient tensor . The total deformation is multiplicatively decomposed into elastic and plastic parts. The decomposition is unique with the common assumption that the plastic rotation rate during the current increment is zero. Therefore, material rotations are fully represented in the elastic part of the deformation gradient tensor. The von Mises yield criterion defined by ,
( , ̅ )=
:
,
−
( ̅ )
(8)
is used, where the effective plastic strain is ̅ = Hydrostatic stresses
,
:
(9)
are calculated using mean stress
,
=
=
−
(10)
is related to the stress During the elastoplastic deformation, the plastic deformation rate by the normality rule. The direction of is perpendicular to the yield surface in the stress space, and the length of , which is unknown at the current increment, is characterized by the plastic multiplier . The value of the plastic multiplier is found from the consistency equation so that the stress state always resides on the yield surface during elastoplastic deformation. When the plastic multiplier is calculated, the constitutive relation between the objective rate of the Cauchy stress tensor and the deformation rate tensor is determined using the Prandtl-Reuss equation. Besides the constitutive equation for the stress state, the effective plastic strain is updated to keep track of the plastic evolution. 3.4 Viscoelastic fluid deformation For the viscoelastic deformation, we begin our analysis from the momentum conservation equation of an incompressible, Maxwell viscoelastic fluid having infinite Prandtl number (i.e. all inertial terms can be neglected), and driven by buoyancy forces. ,
where is the stress tensor and an isotropic pressure, ,
(11)
a force term. The stress consists of a deviatoric part, , and =
where
=
= is the identity tensor.
−
(12)
191
Multiscale Particle-In-Cell Method: From Fluid to Solid Mechanics
The Maxwell model assumes that the strain rate tensor, , defined as: =
+
(13)
is the sum of an elastic strain rate tensor and a viscous strain rate tensor . The velocity vector, , is the fundamental unknown of our problem and all these entities are expressed in the fixed reference frame . In an incompressible material, these strain rates are, by definition, devatoric tensors. The viscous and elastic constitutive laws in terms of the strain rate are, respectively =2
; τ = 2
(14)
where is shear viscosity, is the shear modulus, and τ is an objective material derivative of the deviatoric stress. The viscous and elastic constitutive laws are combined by summing each contribution to the strain rate tensor =
+
=
+
(15)
Writing the stress derivative as the difference, in the limit of small − Δ , between the current stress solution at , and the stress at an earlier time, − Δ gives τ ( , ) = lim
( , )
( ,
, , ( , ))
(16)
→
Where ̂ indicates a stress history tensor which has been transported to the current location by the time-dependent velocity field from its position at the earlier time, − Δ . For each point in the domain, , this stress history is dependent upon the velocity history, which determines the path taken by the material to reach the point, , and any rotation of the tensor along the path. A common choice for τ is the following: τ =
+
(17)
where is the instantaneous rate of change in the stress tensor, related to the spatial part of the Eulerian derivative and associated with the transport, rotation and stretching by fluid motion. = Here
+
−
+ (
+
is a parameter that can take values between -1 and 1, and =
−
)
(18)
is the spin tensor, (19)
When = 0, τ is known as the Jaumann derivative, and when = 1 or = −1 it is known as the upper- or lower-convected Maxwell derivative, respectively. In our implementation, we choose = 0. This choice greatly simplifies the formulation as it ensures that τ is deviatoric when is deviatoric.
192
Advanced Methods for Practical Applications in Fluid Mechanics
Numerically, with the PIC formulation, it is more convenient to compute ̂ directly than to attempt to compute the derivatives in . ̂ is the stress tensor stored at a material point accounting for rotation along the path. This gives the following form of the constitutive relationship.
=2
+
(20)
If we now write
=
(21)
=
+ =2
−
(22) (23)
It is clear that the introduction of viscoelastic terms into a fluid dynamics code is merely a question of being able to compute ̂ accurately; a simple task when particles are available. An important feature of this formulation is the fact that we have specified an independent elastic time step, Δt which is not explicitly related to the relaxation time of the material or the timestep mandated by the Courant stability criterion. The use of an independent step is appropriate because there is a large variation of relaxation time within the lithosphere due to temperature dependence of viscosity exhibited by mantle rocks (Karato 1993). While the near surface has a relaxation time comparable to the overturn time, the deeper, warmer parts of the lithosphere have a relaxation time several orders of magnitude less than this — and elasticity may be ignored altogether. If Δt is chosen to resolve elastic effects at the relaxation time of the cool part of the boundary layer, then, for regions where the relaxation time is much smaller, the elastic term simply becomes negligibly small and viscous behavior is recovered. In (Moresi et al. 2003), we describe the manner in which the stress tensor can be averaged over a moving window to ensure that the storage of only one history value is required to recover ̂ at − Δt .
4. Multiscale formulation To perform multiscale simulation, a Representative Volume Element (RVE) is assigned to each material point. Instead of constitutive relations at the macroscale level, the microstructural material properties and morphologies are assumed to be known a priori. The realization of the RVE in terms of size and representativeness is an important factor. At the RVE level, the macroscale deformation gradient is used to impose boundary conditions on the RVE. After solving the microscale problem using a stand-alone multiscale PIC model, the stresses and tangent stiffness matrix are averaged and returned to the macroscale material point. The localization and homogenization (or commonly known the multilevel FEM) approaches explained here are mainly inspired by the works of Smit et al. (1998) and Kouznetsova et al. (2001).
193
Multiscale Particle-In-Cell Method: From Fluid to Solid Mechanics
After performing the homogenization, the residual forces at the material points are calculated. Then convergence of the macroscale iteration is checked. If convergence is achieved, the solver proceeds to the next increment; otherwise, the microscale solution is initiated to obtain the corrective stress vector. The material tangent-stiffness matrix and the averaged stress vector are evaluated for the corresponding material point. 4.1 Localization During this phase, Boundary Conditions (BCs) are applied on the RVE model. BCs can be imposed in three ways: a) by prescribed displacement, b) by prescribed traction, or c) by periodic boundary conditions. The following formulation covers the prescribed displacement and periodic BC cases. The formulation for traction BC is outside the scope of our multiscale PIC code because it is fundamentally a displacement driven code. The macroscale deformation gradient is used as a mapping tensor on boundaries of the RVE, = ⋅ where refers to deformed and to undeformed position vectors of the points along the boundary. The most reasonable estimation of the averaged properties are obtained with periodic BCs (Smit et al. 1998). The periodic BCs are enforced using symmetric displacement and antisymmetric traction BCs along opposite edges of the boundary Γ (Kouznetsova et al. 2001). 4.2 Homogenization The coupling of the macro and micro scales is performed during the homogenization phase. In this phase of solution, the averaged stress and consistent tangent stiffness matrix are calculated for the multiscale constitutive relations using the computational homogenization method outline by Kouznetsova (Kouznetsova 2002; Kouznetsova et al. 2004). The macroscale deformation gradient and 1st PK stress are volume averages of their microscale counterparts. =
(24)
=
(26)
where
is the traction or force. After the RVE microscale problem is solved, the values of are known, and one can perform the integration in equation (26) and return macroscale stresses to the corresponding material point. In the following, the gradient operator ∇ is taken with respect to reference configuration while ∇ is the gradient operator with respect to the current configuration. With account for microscale equilibrium ∇ ⋅ = 0 and the equality of ∇ ⋅ = the following relation holds = (∇
) +P
⋅P
(∇
⋅ )=∇
(P
⋅ )
substitution of equation (27) into (26) and application of the divergence theorem ( Ω= ⋅ Γ) and the definition of the first PK stress vector ( = ⋅ ) gives =
∇
⋅(
)
=
⋅
Γ
(27) ∇⋅
(28)
194
Advanced Methods for Practical Applications in Fluid Mechanics
where and are the normal vectors in initial (Γ) and current (Γ ) RVE boundaries, respectively. The integration in equation (28) can be simplified for prescribed displacement BC and a periodic BC. The consistent tangent stiffness matrix can also be calculated using the RVE equilibrium equation and the relation between averaged RVE stress and its averaged work conjugate quantity. Next, macroscale stress and stiffness matrix calculations are treated separately for the prescribed displacement BC and periodic BC. 4.3 Prescribed displacement BC The macroscale deformation gradient is used as a mapping tensor on the boundaries of the RVE: =
⋅ with X on Γ
(29)
where refers to deformed and to undeformed position vectors of the points along the boundary, Γ is the initial undeformed boundary points of the RVE. For the case of prescribed displacement BC, integration of equation (26) simply leads to the following summation =
∑
() ()
=
∑
() ()
(30)
where ( ) are the resulting external forces at the boundary nodes (that are caused by stress on these nodes). In the preceding equation, ( ) is the position vector of the i-th node along the undeformed boundary Γ of RVE. The macroscale 1st PK stress in equation (30) is a non-symmetric second-order tensor, and in component form for two dimensions it can be written as follows =
∑ ∑
() ()
()
∑
()
()
()
∑
()
()
(31)
where scalar values ( ) and ( ) are resulting external forces in basis direction one and two, respectively. Similarly, scalar values ( ) and ( ) refer to the initial position vector in directions one and two. The subscript index (i) indicates the quantity is on the i-th node along the boundary. Multiscale constitutive relations are required to determine the macroscale consistent stiffness matrix at = + 1. The components of this matrix are the derivative of the macroscale 1st PK stress with respect to its corresponding work conjugate, macroscale deformation gradient =
(32)
where is the fourth-order tensor of the macroscale consistent stiffness moduli. In the incremental iterative solver, the above derivative can be rewritten in terms of iterative variations of 1st PK stress and deformation gradients = Equation (31) can be used to find variations of 1st PK stress
(33)
195
Multiscale Particle-In-Cell Method: From Fluid to Solid Mechanics
∑
=
()
∑
To find variations in external forces in matrix notation as
()
()
()
∑
()
()
()
∑
()
()
(34)
one can use the RVE equilibrium equation written
=
(35)
where subscript b refers to degrees of freedom of the boundary points and subscript d refers to degrees of freedom of internal points in the RVE domain. After solution of the RVE model, Equation (35) can be reduced to find the stiffness matrix that corresponds only to the prescribed degrees of freedom on the boundary points −
(
)
=
(36)
where the left hand side term in the bracket is stiffness matrix rewritten in tensor notation. ∑
−
(
)
( )
( )
_
=
()
. Equation (36) may be
(37)
Subscripts i and j refer to nodes on the boundary Γ of the RVE where the displacement is prescribed. Now by substitution of equation (37) into equation (34) the numerator term in (33) is found as =
∑ ∑
( )
_
− )⋅ On prescribed nodes, the displacement is ( ) = ( simply ( ) = ( ) ⋅ . Hence, equation (38) simplifies to ∑ ∑
=
( ) ( )
(38)
( ) ()
( ):
_
( ),
and their variation is
(39)
Comparing equation (39) and (33), the macroscale consistent tangent stiffness matrix is found from the right hand side of equation (39) to be =
∑ ∑
( ) ( )
_
(40)
()
where each component of the matrix on the right hand side is a [2x2] matrix itself. In other words, ( ) _ is the same as a [2x2] matrix found from the global microscale stiffness matrix at rows and columns of degrees of freedom i and j. 4.4 Periodic BC The macroscale deformation gradient is used as a mapping tensor on opposite boundaries of the RVE such that the undeformed and deformed shapes of opposite edges of the RVE are always the same and the stresses are equal but in an opposite direction. −
=
⋅(
−
)and
=
(41)
196
Advanced Methods for Practical Applications in Fluid Mechanics
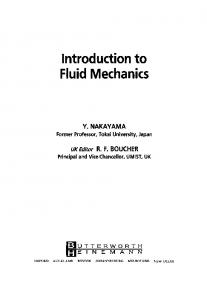
is the traction related to the 1st PK stress tensor and normal with where = ⋅ reference to the initial configuration of the RVE. Some writers have modified the periodic BC of equations (41) to simple relations between top-bottom and right-left edges of an initially square shape two-dimensional RVE, shown in Figure 1 (Kouznetsova et al. 2001; Smit et al. 1999). The choice of periodic boundary conditions has been proven to give a more reasonable estimation of the averaged properties, even when the microstructure is not regularly periodic (Kouznetsova et al. 2001; Smit et al. 1999; Van der Sluis et al. 2001). The periodic boundary condition implies that kinematic (or essential) boundary conditions are periodic and natural boundary conditions are antiperiodic. The latter is to maintain the stress continuity across the boundaries. The spatial periodicity of is enforced by the following kinematic boundary constraints (
)+ (
−
)+
(
− −
−
) = 0 for
(
) = 0 for
(
) for
=
(42)
=
and natural boundary constraints (
⋅ ⋅
)=− ⋅ (
)=− ⋅
(
) for
= =
(43)
where on the ij-th boundary, and are local coordinates of nodes on the top-bottom and left-right edges, respectively, as shown in Figure 1. Assuming that point C1 is located on the origin of the rectangular Cartesian coordinate system of ( , ), vertex 1 is fully fixed to eliminate rigid body rotation of the RVE. The kinematic boundary condition (or prescribed displacement due to the macroscale deformation gradient) acts only on the three corner nodes C1, C2 and C4. =(
− ) for = 1, 2 and 4
(44)
Using equations (41)-(44) one can fully define the boundary value problem of the RVE model. Because in a displacement-based code, stress periodicity will be approximately satisfied due to the displacement periodicity induced by constraints of equation (42), the periodicity condition may be recast in terms of displacement constraints only. = =
− −
+ +
(45)
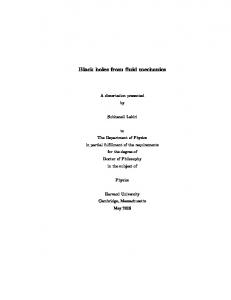
Equations (44) and (45) provide a link between degrees of freedom of top-bottom and rightleft boundaries of the RVE in the microscale global stiffness matrix. For the periodic boundary condition, the calculation of the macroscale stress follows that of the prescribed displacement case and is found by equation (34). The only difference is that subscript i refer to the three prescribed corner nodes of C1, C2 and C4. Similarly, the macroscale consistent tangent moduli is found by equation (40) whereas again subscripts i and j correspond only to corner nodes 1, 2 and 4. Furthermore, as shown in Figure 2, the global stiffness matrix for the microscale is partitioned to points on corners
197
Multiscale Particle-In-Cell Method: From Fluid to Solid Mechanics
(indicated by subscript c), points on positive (subscript p) and negative (subscript n) edges, as well as points inside the domain of the RVE model (subscript d)
=
(46)
= 0.
where the external force vector of points inside the RVE domain satisfies
h
sTop
C4
C3
a
s Right
s Left
x C1
s Bottom
C2 a
Fig. 1. Typical square shape RVE in undeformed configuration +h
d (internal in domain) p (positive edge)
-x
+x n (negative edge) c (corners)
-h
Fig. 2. Partitioning of global stiffness matrix of microscale with reference to position of material points in an RVE with periodic boundary conditions
198
Advanced Methods for Practical Applications in Fluid Mechanics
The periodic boundary condition then implies that on the microscale = − , = = 0. The rest of the procedure to calculate the consistent tangent stiffness matrix for and the macroscale material point is similar to calculations described in previous section for the prescribed BC.
5. Numerical models The multiscale PIC method developed in the previous sections was applied to a series of case studies to assess its efficiency and accuracy compared to traditional fluid mechanics or solid mechanics modeling and simulation methods. Two examples are presented that employ the PIC method, without any multiscale effect, to showcase the differences between conventional FE approach and PIC method. These examples are followed by some more examples of metal forming processes modeled using the multiscale PIC method described in previous section. 5.1 Shear banding of viscoelastic plastic material under incompressible viscous flows This example is a 2D numerical experiment of a strain-softening viscoelastic-plastic material undergoing simple shear in a periodic domain. We anticipate the development of strong shear banding in this situation. Our interest lies in understanding 1) the initial orientation of the shear bands as they develop from a random distribution of initial softening, 2) the high-strain configuration of the shear bands, and how deformation is accommodated after the shear bands become fully softened. This experiment is similar to the ones described in Lemiale et al. (2008); here we use simple-shear boundary conditions and very high resolution to study several generations of shear bands. The sample material is confined between two plates of viscous material with "teeth" which prevent shear-banding from simply following the material boundaries. A small plug of non-softening material is applied at each end of the domain to minimize the effect of shear bands communicating across the wrap-around boundary. The example shown in Figures 3 and 4 are of a material with 20% cohesion softening and a friction coefficient of 0.3 (which remains constant through the experiment). The material properties of the sample are: viscosity = 100, elastic shear modulus = 106, cohesion = 50. This ensures that the material begins to yield in the first few steps after the experiment is started. A large number of shear bands initiate from the randomly distributed weak seeds in two conjugate directions in equal proportions. These two orientations are: 1) approximately 5 degrees to the maximum velocity gradient (horizontal) and 2) the conjugate to this direction which lies at 5 degrees to the vertical. These orientations are highlighted in Figure 3a which is a snapshot taken at a strain of 0.6%. As the strain increases to 3% (Figure 3.b), the initial shear bands coalesce into structures with a scale comparable to the sample width. The orientation of the largest shear bands in the interior of the sample is predominantly at 10 degrees to the horizontal. This angle creates a secondary shear orientation, and further, smaller shear bands are seen branching from the major shear bands. At total strain between 100% and 130%, the shear bands have begun to reorganize again into structures sub-parallel to the maximum velocity gradient. Softening has concentrated the deformation into very narrow shear bands which can be seen in Figure 3c and 3d. Although the total strain is of order unity, the maximum strain in the shear bands is higher by nearly two orders of magnitude. Further deformation of the sample produces almost no deformation in the bulk of the material; all subsequent deformation occurs on the shear bands (Figure 3c evolving to Figure 3d).
Multiscale Particle-In-Cell Method: From Fluid to Solid Mechanics
199
The progression of the experiment from onset to a total shear across the sample of 130% is shown in Figure 3. The plot is of plastic strain overlain with material markers. Figures 4a and 4b are the full-size experiments from which Figure 3a and 3b were taken. Figures 4(e,f) are the full-size images of Figure 3(c,d). Although this experiment represents solid deformation, the extremely high-strains present in the shear bands warrant the formulation of the problem using a fluid approach.
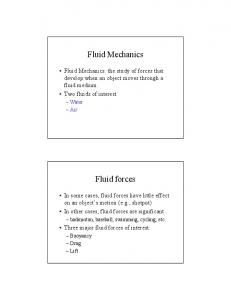
Fig. 3. A viscoplastic material with a strain-softening Drucker-Prager yield criterion is subjected to a simple shear boundary condition which gives a velocity gradient of 1 across the sample. The resolution is 1024x256 elements in domain of 8.0 x 2.0 in size. The strain rate is shown in (a,b) for an applied strain of 0.6% and 3% respectively. The scale is logarithmic varying from light blue (strain rates < 0.01) to dark red (strain rates > 5.0). The average shear strain rate applied to the experiment is 1.0. Shear bands are fully developed at 1-2% strain. At high strains of 100% and 130%, shown in (c,d), almost all deformation occurs in the shear bands. In these examples we have included light-coloured stripes, initially vertical, which mark the strain. The shear bands are visualized by applying dark colouring to material which reaches the maximum plastic strain of 1.0.
200
Advanced Methods for Practical Applications in Fluid Mechanics
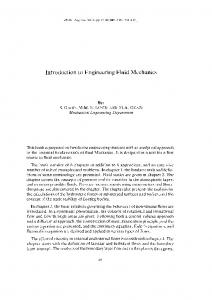
Fig. 4. The evolution of the shear experiment from 0.6% applied strain (a) through to 130% strain (f). The intermediate values of strain are 3% (b), 33% (c), 66% (d) and 100% (e). The resolution is 1024x256 elements in domain of 8.0 x 2.0 in size; strain markers and shear bands are visualized as in Fig. 3c,d.
Multiscale Particle-In-Cell Method: From Fluid to Solid Mechanics
201
5.2 Viscoelasticity in subduction models The model in which we demonstrate the importance of viscoelastic effects in subduction is one in which an isolated oceanic plate founders into the mantle. Although this model is not a faithful representation of a subduction zone, it is well understood, and different regimes of behavior have been observed and interpreted in a geological context for purely viscous plates (OzBench et al. 2008). The model has a viscoelastic inner core with viscoplastic outer layers. The lithosphere undergoes significant strain as it traverses the fluid (mantle) layer. Figure 5 shows subduction models in which ranges across 3 orders of magnitude with a constant value of the viscosity contrast between the core of the slab and the background mantle material of Δ = 2 × 10 , resulting in relaxation times from 20,000 years through to 2 million years. Contour lines of viscosity are included to differentiate between the upper mantle, outer plastic lithosphere and slab core.
Fig. 5. Weissenberg number for free slab models at steady state with increasing elasticity. The models represent the outer 670km of the Earth. The models are run in a domain of aspect ratio 6; the images are then translated to show the hinge at the same position in the diagram for each of the cases. This steady state snapshot is taken when the subduction rate reaches a constant value and with the slab fully supported by the lower mantle. (a) Viscous only core = 2 × 10 . Viscoelastic core models have Δ = 2 × 10 with a scaled observation time (Δ ) of 2 × 10 yrs for all models and elastic modulus varying as (b) = 2 × 10 Pa ( = 21 Myr) (c) = 8 × 10 Pa ( = 108 Myr) (d) = 4 × 10 Pa ( = 194 Myr) (e) = 8 × 10 Pa ( = 1080 Myr) (f) = 4 × 10 Pa ( = 2160 Myr) The coloring indicates the Weissenberg number: a measure of the relaxation time to the local characteristic time of the system (here defined by the strain rate). In regions where this value is close to unity, the role of elasticity dominates the observed deformation. The increase in
202
Advanced Methods for Practical Applications in Fluid Mechanics
Weissenberg number highlights the change in slab morphology during steady state subduction as elasticity is increased with a fold and retreat mode observed for the viscous core model (a) and models (b-d). As decreases, the elastic stresses increase, producing in a strongly retreating lithosphere for low values of . In Figure 6, we show the stress orientations associated with the viscosity-dominated and elasticity-dominated models. The stress distribution and orientation each influence seismicity and focal mechanisms of earthquakes. Although the near-surface morphology of the lithosphere is quite similar in each case, the distinct patterns of stress distribution and the difference in stress orientation during bending indicate very different balances of forces. Viscoelastic effects are clearly important in developing models of the lithospheric deformation at subduction zones. Particle based methods such as ours allow the modeling not only of the viscoelastic slab, but the continuous transition through the thermal boundary layer, to the surrounding viscous mantle. This makes it possible to study, for example, the interaction of multiple slabs in close proximity, or slabs tearing during continental collision.
Fig. 6. The dimensionless deviatoric stress invariant and stress orientation within the core showing extension (red) and compression (blue) axes at the steady state time step shown in Figure 5 for a relaxation time of (a) 21 k yr – viscosity dominated and (b) 2,160 k yr – elasticity playing a dominant role in the hinge region. The eigenvectors are plotted using the same scale for both (a) and (b). The reference stress value is 48 MPa.
Multiscale Particle-In-Cell Method: From Fluid to Solid Mechanics
203
5.3 Multiscale modeling of AHSS Advanced High Strength Steels such as Dual Phase (DP) and Transformation Induced Plasticity (TRIP) steels have a multiphase microstructure that strongly affects their forming behavior and mechanical properties. DP steel’s microstructure consists of hard martensite inclusions in a ferrite matrix. TRIP steel has a similar microstructure with addition of retained austenite which then potentially transforms into martensite during deformation. The result of this transformation is better combination of ductility and strength. The multiphase nature of the DP and TRIP steels’ microstructure is the focus of modeling with multiscale PIC method as well as with conventional FE method (Asgari et al. 2008). One of the difficulties with FEM micromechanical models is the requirement for mesh refinement. Our multiscale PIC method benefits from the h-type of refinement similar to the one traditionally used in FEM. Using this approach, it is possible to increase the number of background cells as if the cells were elements in a FE model. This enrichment in the multiscale PIC model is schematically shown in Figure 7 for a three phase (TRIP steel) microscale model. Accordingly, convergence tests were used to certify that the solution was not altered by the increasing number of background cells.
Fig. 7. The multiscale PIC enrichment similar to the idea of h-refinement in FEM With the aid of background cell enrichment, an important feature of the multiscale PIC method is also visualised in Figure 7. This feature is demonstrated in the capability of the multiscale PIC method to represent two or three (or even more) material properties within a single background cell; for example in Figure 7a, the lower left hand side cell contains three different material points. Such representation in FE method needs at least three elements with three different material properties. This advantage of PIC method was carried over into the refined models as shown in Figure 7(b,c). In these cases, the phase interfaces and background cell boundaries never disturbed each other and are independent. The simplified unit cell configuration was used in microscale analyses of DP and TRIP steels, as shown in Figure 8. In addition to simplified unit cell representation, it is possible to use realistic microstructure of these steels in the simulations. For further details on
204
Advanced Methods for Practical Applications in Fluid Mechanics
strength to realistic microstructure see Asgari et al. (Asgari et al. 2009). The two phases in the DP microscale models and the three phases in the TRIP microscale models obeyed the J2 theory of deformation. For these constituent phases being isotropic elastoplastic, only two elastic constants were necessary to describe the elastic behavior, and Swift hardening was assumed (
)=
(1 +
)
(47)
Where is the accumulated plastic strain. was considered to be 500, 780 and 2550 MPa for ferrite, austenite and martensite, respectively. The hardening factor and hardening exponent ( , ) were taken to be (93 MPa, 0.21) for ferrite, (50 MPa, 0.22) for austenite and (800 MPa, 0.2) for martensite. These material properties can be obtained by a combination of neutron diffraction, nano-indentation and microstructural imaging described by Jacques et al. (Jacques et al. 2007).
Fig. 8. Geometrical representation of the simplified unit cells for a) DP steel with 76.76% ferrite (grey) and 23.24% martensite (black) and b) TRIP steel with 77.12% ferrite (Gray), 14.75% austenite (black) and 8.13% martensite (white); and the von Mises stress distribution for c) DP steel and d) TRIP steel The PIC method was quantitatively stiffer than FEM at the peak stress, although in some local regions around corners of the microscale unit cell boundary, FEM occasionally showed more stiffness than PIC. The effective plastic stress and strain predicted from the simplified unit cells were calculated using the volume averaging homogenization technique. These are
Multiscale Particle-In-Cell Method: From Fluid to Solid Mechanics
205
plotted in Figures 9(a,b) for the DP and TRIP steel, respectively. The effective stress predicted from simplified regular unit cells showed up to 10% error using the FE method and up to 6% error using the Multiscale PIC method, which does not prove to be significantly more accurate than FE method. An interesting observation made from the macroscale effective stress of simplified unit cells was the prediction of the yield point using FE and multiscale PIC method. In the case of the DP steel, both methods were able to predict the yield stress quite accurately. However, in the case of the TRIP steel, the multiscale PIC method produced more error compared to the FE results. The increased error occurs because in multiscale PIC method the location of integration points are not at the optimal locations as the FE integration points are. Therefore, there might be some loss of accuracy due to integrations performed in this method. This loss of accuracy balances out with the improved accuracy obtained from the smoother interpolation of the field variables (especially on and around the phase interfaces) after a certain strain values. Therefore, the error in the FE method continued increasing while that of the multiscale PIC method reached a plateau, and might have even decreased if deformed towards much larger strains.
Fig. 9. The effective plastic macro stress from simplified regular unit cell models of a) DP steel and b) TRIP steel, showing comparison between FE method (FEM), multiscale PIC (MPIC) and experimental stress strain data.
206
Advanced Methods for Practical Applications in Fluid Mechanics
6. Conclusion The examples of large strain deformation of viscoelastic-plastic material and tectonic plates shows that PIC method is very suitable for solid mechanics problems where large deformations are encountered. However, the last example showed that the multiscale PIC method does not have any significant advantage over FE method in small strains for solid mechanic formulation. In such cases, the maturity of the FE method dominates the minimal accuracy benefits that could be obtained by using material particles instead of integration points.
7. Acknowledgement Authors would like to acknowledge funding and support from Institute for Technology, Research and Innovation (ITRI) and Victorian Partnership for Advanced Computing (VPAC). Code development was partly supported by AuScope, a capability of the National Collaborative Research Infrastructure Strategy (NCRIS).
8. References Asgari, S. A., Hodgson, P. D., Lemiale, V., Yang, C. & Rolfe, B. F. (2008). Multiscale ParticleIn-Cell modelling for Advanced High Strength Steels. Advanced Materials Research, Vol. 32, No. 1, pp. 285-288 Asgari, S. A., Hodgson, P. D. & Rolfe, B. F. (2009). Modelling of Advanced High Strength Steels with the realistic microstructure-strength relationships. Computational Materials Science, Vol. 45, No. 4, pp. 860-886 Belytschko, T., Krongauz, Y., Organ, D., Fleming, M. C. & Krysl, P. (1996). Meshless methods: An overview and recent developments. Comput. Methods Appl. Mech. Engrg., Vol. 139, No., pp. 3-47 Belytschko, T., Liu, W. K. & Moran, B. (2001). Nonlinear FEs for continua and structures John Wiley & Sons Inc., West Sussex Benson, D. (1992). Computational methods in Lagrangian and Eulerian hydrocodes. Comput. Methods Appl. Mech. Engrg., Vol. 99, No., pp. 235-394 Chen, J. S., Pan, C., Roque, C. M. O. L. & Wang, H. P. (1998). A Lagrangian reproducing kernel particle method for metal forming analysis. Computational Mechanics, Vol. 22, No., pp. 289-307 Guilkey, J. E. & Weiss, J. A. (2003). Implicit time integration for the material point method: Quantitative and algorithmic comparisons with the finite element method. International Journal for Numerical Methods in Engineering, Vol. 57, No., pp. 13231338 Jacques, P. J., Furnemont, Q., Lani, F., Pardoen, T. & Delannay, F. (2007). Multiscale mechanics of TRIP-assisted multiphase steels: I. Characterization and mechanical testing. Acta Materialia, Vol. 55, No., pp. 3681-3693 Karato, S. (1993). Rheology of the upper mantle - a synthesis. Science, Vol. 260, No., pp. 771778
Multiscale Particle-In-Cell Method: From Fluid to Solid Mechanics
207
Kouznetsova, V. (2002). Computational homogenization for the multi-scale analysis of multi-phase materials. Department of Mechanical Engineering. pp. 120, Eindhoven University of Technology, Eindhoven Kouznetsova, V., Brekelmans, W. A. M. & Baaijens, F. P. T. (2001). An approach to micromacro modeling of heterogeneous materials. Computational Mechanics, Vol. 27, No., pp. 37-48 Kouznetsova, V., Geers, M. G. D. & Brekelmans, W. A. M. (2004). Size of a Representative Volume Element in a second-order computational homogenization framework. International Journal for Multiscale Computational Engineering, Vol. 2, No. 4, pp. 575598 Lemiale, V., Muhlhaus, H. B., Moresi, L. & Stafford, J. (2008). Shear banding analysis of plastic models formulated for incompressible viscous flows. Physics of the Earth and Planetary Interiors, Vol. 171, No. 1-4, pp. 177-186 Liu, W. K., Karpov, E. G., Zhang, S. & Park, H. S. (2004). An introduction to computational nanomechanics and materials. Comput. Methods Appl. Mech. Engrg., Vol. 193, No., pp. 1529-1578 Moresi, L., Dufour, F. & Muhlhaus, H. B. (2003). A lagrangian integration point finite element method for large deformation modeling of viscoelastic geomaterials. J. Comp. Physics, Vol. 184, No., pp. 476-497 OzBench, M., Regenauer-Lieb, K., Stegman, D. R., Morra, G., Farrington, R., Hale, A., May, D. A., Freeman, J., Bourgouin, L., Muhlhaus, H. B. & Moresi, L. (2008). A model comparison study of large-scale mantle-lithosphere dynamics driven by subduction. Physics of the Earth and Planetary Interiors, Vol. 171, No. 1-4, pp. 224234 Smit, R. J. M., Brekelmans, W. A. M. & Meijer, H. E. H. (1998). Prediction of the mechanical behavior of nonlinear heterogeneous systems by multi-level finite element modeling. Comput. Methods Appl. Mech. Engrg., Vol. 155, No., pp. 191192 Smit, R. J. M., Brekelmans, W. A. M. & Meijer, H. E. H. (1999). Prediction of the largestrain mechanical response of heterogeneous polymer systems: local and global deformation behaviour of a representative volume element of voided polycarbonate. Journal of the Mechanics and Physics of Solids, Vol. 47, No., pp. 201221 Sulsky, D. & Schreyer, H. L. (1996). Axisymmetric form of the material point method with applications to upsetting and Taylor impact problems. Comput. Methods Appl. Mech. Engrg., Vol. 139, No., pp. 409-429 Sulsky, D., Zhou, S. J. & Schreyer, H. L. (1995). Application of a particle-in-cell method to solid mechanics. Computer Physics Communications, Vol. 87, No., pp. 236252 Van der Sluis, O., Schreurs, P. J. G. & Meijer, H. E. H. (2001). Homogenisation of structured elastoviscoplastic solids at finite strains. Mechanics of Materials, Vol. 33, No., pp. 499-522
208
Advanced Methods for Practical Applications in Fluid Mechanics
Watts, A. B., Bodine, J. H. & Ribe, N. M. (1980). Observations of flexure and the geological evolution of the pacific basin. Nature, Vol. 283, No., pp. 532-537