MULTISENSOR DATA FUSION FOR ABOVEGROUND CARBON ESTIMATION David G. Goodenough(1), Hao Chen(2), Andrew Dyk(3), Tian Han(4) and Jingyang Li(5) (1)
Pacific Forestry Centre, Natural Resources Canada, 506 West Burnside Road, Victoria, BC, Canada V8Z 1M5 and Computer Science, University of Victoria, Victoria, BC, Email:
[email protected] (2) Pacific Forestry Centre, Natural Resources Canada,. Email:
[email protected] (3) As (2) above. Email:
[email protected] (4) As (1) above. Email:
[email protected] (5) Computer Science, University of Victoria, Victoria, BC. Email:
[email protected]
ABSTRACT Canada contains 418 million hectares of forested land. As part of its international commitments, Canada needs to report on the spatial distribution of carbon in its forests. This requires determining the spatial distribution of forest types (conifer, deciduous and mixed) and forest species [1]. Secondly, it is necessary to know the amount of forest aboveground. This can be estimated through several methods with the goal being the spatial distribution of forest timber volume. Previously we developed a system for producing aboveground carbon maps based on multitemporal Landsat data. This system was called the Kyoto Protocol Advanced Classification System (KPACS) [2] and was applied to Landsat data collected over a test site near Hinton, Alberta. A variety of sensor data have been acquired over our test sites. These data include hyperspectral data from Hyperion, ASAR radar data, Advanced Land Imager data from the EO-1 satellite, Quickbird imagery, and airborne AVIRIS data at 20 m and 4 m resolutions. Methods have been developed for determining major forest species distribution and through unmixing the fractional abundances of these species. Experiments have been conducted to estimate biomass and timber volume over these sites. This paper reports on the fusion of these various data sets and demonstrates that remote sensing can provide accurate measurements of aboveground carbon in Canadian forests. INTRODUCTION Forests are one of the major carbon sinks in global carbon cycle. To characterize over decades the forest contribution to the global carbon balance at large spatial scales, satellite remote sensing, and particularly multi-spectral remote sensing with wide swath, is an appropriate means. However, accurate estimation of forest carbon stocks is a challenge for remote sensing measures, because of complex forest structures and variable topology. Above ground forest biomass estimates from remote sensing can be performed by fusion of a variety of data sets. We have demonstrated in two of our study areas, the Greater Victoria Watershed district (GVWD) and Hinton Alberta, various methods to obtain biomass from both passive and active remote sensing sensors. STUDY SITES Two study sites were used for this research. The Greater Victoria Watershed District (GVWD) is located northwest of Victoria on Vancouver Island, British Columbia, Canada. The forest cover is comprised predominately of Coastal Douglas-fir (Pseudotsuga menziesii var. Menziesii) and Western Hemlock (Tsuga heterophylla) with salal as the dominant understory. Our second study site was in Hinton, Alberta, Canada, which was about 285 km west of Edmonton and 85 km east of the town of Jasper. The size of the study area for this project was approximately 800 km2. The forest stands were dominated by lodgepole pine (Pinus contorta Dougl. var. latifolia Engelm.) and white spruce (Picea glauca (Moench) Voss) in upper foothills. The ages of the mature dominant species varied between 80 and 110 years and stand heights ranged from 11 to 21+ meters. Low to medium crown closure dominated most of the study area [3]. MULTISENSORS AND METHODS OF ABOVEGROUND CARBON ESTIMATION Hyperspectral (GVWD) While there have been some successful applications of carbon estimation with multi-spectral remote sensing data, improvements in accuracy are still needed for reducing estimation uncertainties. Forest carbon estimation and mapping
using multi-spectral data are usually based on establishing relationships between carbon and either radiance or reflectance on forest inventory plots by multiple linear regressions. Considering that hyperspectral remote sensing has more variables (bands) than multi-spectral remote sensing for the plot spectral description, it is possible that we can obtain more accurate carbon results with hyperspectral data. In this study, we investigated the possibility of using AVIRIS data for forest carbon estimation and mapping. This study is part of the project HERO Utility Development for Forestry and Environment Monitoring Activities (HUDFEMA), which is part of the Canadian Space Agency’s hyperspectral satellite program. The Kyoto Protocol requires the establishment of methodologies for estimating the carbon stocks of forests [4]. We expect that the technique proposed in this study to be complementary to existing carbon estimation methodologies based on modeling. Clear AVIRIS images used for this study were acquired over GVWD on September 10th, 2001 (20m pixels) and August 10th, 2002, (4m). The forest carbon stock estimation was conducted using Partial Least Squares (PLS) to relate the plot carbon numbers to the corresponding plot spectra extracted from the GVWD AVIRIS image. Forest cover information at 33 plots was extracted from GIS data, including species, tree height, site index, and age. Based on the extracted forest cover information, the Variable Density Yield Prediction (VDYP) model [5] was employed to calculate biomass and then the carbon numbers at these plots. The plot carbon numbers were used to establish the forest carbon statistical model based on Partial Least Squares regression. Landsat (Hinton) Multitemporal Landsat images were collected and used to compute aboveground forest biomass and carbon. The method for estimating forest biomass and carbon with Landsat data was published in [1]. Relating field information about stand composition and structure to image data such as vegetation indices was the approach for developing the biomass relationship, which was a function of remote sensing vegetation indices, forest class, site index, and age class. At the coarse bandwidths of Landsat, [6] found good correlations between vegetation indices and fractional cover. Their volume function provided a simplified measure of stand volume from Landsat. Volume (m3/ha) = - 478.58 + 4.5041 × ND45 (1) where ND45 is the vegetation index, averaged over an 11×11 pixel window: ND45 = 128 × [(TM4 - TM5) / (TM4 + TM5)] + 128 (2) where TM4 and TM5 are LANDSAT spectral channels calibrated for TM Band-4 and 5. The forest carbon was calculated with the function in (3): Carbon (kg/ha) = Volume × Density × 0.5 (3) where the density value used for the dominant species was: lodgepole pine (409 kg/m3) [7]. The conversion factor used to convert biomass to forest carbon was 0.5 - biomass was approximately 50% carbon [8, 9]. The procedure for calculating Landsat aboveground carbon in forested areas is summarized as follow: Orthorectify multitemporal Landsat images; Classify Landsat images and obtain forested areas for each image; Normalize level-1 Landsat Band 4 and 5 to the base image for radiometric correction; Calculate multitemporal ND45 in forested areas; Apply 11×11 average filter to ND45; Compute aboveground forest biomass based on ND45; Compute aboveground forest carbon; and Compare multitemporal carbon results. Modeled Volume vs. ND45 The Forest Reflectance and Transmittance (FRT) model [10] was used to simulate the relationship between ND(4,5) and timber biomass. FRT incorporates the modified leaf optics models PROSPECT and LIBERTY, atmosphere radiative transfer model 6S [11], and the homogeneous two-layer canopy reflectance model MCRM2 for understorey. We simulated canopy reflectance for a range of stem densities with tree height fixed and then integrated the reflectance into TM bands using the spectral response functions of Landsat-5. The relationships between stand density SD and DBH were derived from the data in a report for Lodgepole pine [12]. Advanced Land Imager (ALI) (Hinton) The Advanced Land Imager (ALI) had three more additional channels than Landsat and offered better data quantization and higher signal to noise ratio. To avoid atmospheric water absorption, ALI used Band-4 (0.775 – 0.805 µm) and 4p (0.845 – 0.89 µm) instead of Band-4 in Landsat ETM+ (0.78 – 0.90 µm). In our study, an averaged ALI Band-4 was created by (12): Average ALI Band-4 = (ALI Band-4 + ALI Band-4p) / 2 (12). The averaged ALI Band-4 was later used for ALI ND45 calculation. Other computation procedures for aboveground forest carbon were the same as for earlier Landsat satellites. Envisat ASAR (Hinton) With the availability of Envisat Advanced SAR (ASAR), C-band alternating polarization (AP) data were collected to exploit the alternating polarization feature (“dual-pol") of ASAR. HH, HV, VH, and VV data were calibrated with SARSIGM, one of the SAR radar analysis packages offered by PCI Geomatica.
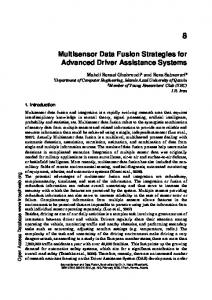
The backscatter coefficient σ˚, retrieved from various permanent sample plots (PSP) at HH, HV, VH, and VV, were used to investigate relationships with aboveground carbon in forested areas. RESULTS Greater Victoria Watershed District The Partial Least Squares (PLS) regression algorithm was selected and implemented to establish the relationship between the plot carbon numbers and the corresponding plot spectra. Compared with other linear regression methods, such as Multiple Linear Regression (MLR) and Principle Fig. 1 Relationship between ND45 modeled by FRT Component Analysis (PCA), PLS has the advantage of and timber biomass exploiting the intrinsic relationship between predicting (reflectance) variable and predicted variable (carbon), while avoiding the multi-co-linearity resulting from the high correlation between hyperspectral bands. A cross validation scheme was used with one third of these 33 pseudo plots held back for checking for over fitting. To derive regression coefficients for stable and robust carbon prediction, fourteen types of spectral transforms were tested on plot spectral data before the regression was conducted. Experiments showed that the spectral transform 7 - two-point 2nd derivative of reflectance, gave the best result in terms of R2 (0.67). To prevent over-fitting, a cross-validation scheme was employed, which revealed that only the first three latent variables were required for this regression. The spectral transform of two-point 2nd derivative produced the best regression, and was selected for forest carbon prediction in this study. Predicted biomass agreed with VDYP biomass for AVIRIS 2001 20m data with an R2=0.92. Hinton The FRT results (Fig. 1) show that ND45 and timber biomass have strong linear correlation over all three types of stand heights with low biomass. As the biomass increases, ND45 will eventually saturate. In 30 m stands, ND45 saturates when biomass is more than 300 t/ha and LAI is > 9.0. The relationship between ND45 and biomass also depends on tree height. Therefore, it may cause errors in estimating biomass from ND45 for stands mixed with a large range in tree heights. For the Hinton study site, biomass levels were below ND45 saturation. The theoretical relationships from the model confirmed the validity of the vegetation indices used for biomass estimation in the Hinton study site. Multitemporal Landsat TM/ETM+ images were acquired in 1985, 1990, 1996, and 2001. Landsat data were all collected during the month of July at the same stage of vegetative phonology. The 2001 Landsat image was from ETM+ and others from TM. One ALI image was collected on the same date as the 2001 Landsat ETM+ image. In our previous studies [2], [14], we performed spatial-based maximum likelihood classification of segments on Landsat and ALI images with KPACS to get the estimates of forested areas for each image. The classification results ranged from 83.4% to 91.2% correct. The aboveground carbon was measured in the no-change forested areas during the time span from 1985 to 2001. The carbon figures from Landsat were consistent over a 16 year period. The standard deviation of the four-date normalized carbon results was 0.06 Mt. The total Landsat aboveground carbon was compared with the carbon estimates from the Canadian National Forest Inventory (CanFI). CanFI was based on the forest inventory summary statistics provided by the Canadian provinces and territories. The total carbon for Hinton from both sources were in good agreement. However, the average of the Landsat forested areas was 1.67 times larger than the forested areas in the 2001 CanFI database. CanFI summarized commercial forests, whereas Landsat measured all forested areas. The average of the Landsat biomass was also about 50% lower than the biomass from CanFI. The Landsat estimates showed temporally a decrease in the forest areas and aboveground carbon. CanFI data indicated increased forested areas and decreased aboveground carbon over the period from 1985 to 2001. The 2001 ALI image was used to follow the Landsat image classification procedure and ND45 estimation to understand sensor impacts on our carbon analysis methods. The classification comparison was performed over the overlapping area between the ALI and Landsat ETM+ images [14]. The average classification accuracies for the 2001 ALI data were 94.3%, approximately 4% higher than the Landsat ETM+ classification results with better discrimination between scrub coniferous and scrub deciduous. The ALI Band-5 and averaged Band-4 were used to calculate ND45. The radiometric relationship between ALI ND45 and Landsat ETM+ ND45 was: Landsat_ND45 = 1.76*(ALI_ND45) -1.25 (13). The
correlation coefficient was 0.65. Radiometric normalization will be required if ALI data is used as the data source for carbon estimation. The ASAR response was extracted from twenty-one PSP plots. The incidence angle range was between 42.5˚ to 45.2˚. The normalized ASAR backscatter coefficient was used to against biomass volume in PSP. In all polarization cases (HH, HV, VH, and VV), the correlations were quite poor. Although HV had the best R2 in all, the HV R2 was only 0.26. New methods need to be developed to obtain much higher correlations with biomass, such as using fully polarimetric SAR and multiple frequencies. CONCLUSIONS It has been demonstrated that remote sensing data can provide accurate forest classifications and aboveground estimates of biomass, resulting in valuable measurements of aboveground carbon in forests. Hyperspectral AVIRIS data provided biomass estimates in GVWD’s dense coastal forests using PLS with a R2 of 0.82 to 0.92, and forest classifications to the species level better than 90% correct. Landsat data were used to classify accurately the Hinton forests into forest types (coniferous, deciduous and mixed), and to estimate biomass through a ND45 vegetation index. The FRT model was used to provide a theoretical basis for this approach. Carbon results from Landsat were compared with existing national forest inventories. Landsat results were consistent over a 16 year period. We obtained poor results from ASAR for biomass estimates using dual polarization, and are presently investigating polarimetric methods with airborne SAR. ACKNOWLEDGEMENTS The authors acknowledge the European Space Agency for providing Envisat ASAR data to Canadian Forest Service under the Category-1 Project 2481. We are grateful for support from the Canadian Space Agency, Natural Resources Canada, the University of Victoria, and the Natural Sciences and Engineering Research Council. We thank NASA and the JPL team for acquiring AVIRIS data over the GVWD test site. REFERENCES 1. 2. 3. 4. 5. 6. 7. 8. 9. 10. 11. 12. 13. 14.
D. G. Goodenough, A. S. Bhogal, H. Chen, and A. Dyk, "Comparison of Methods for Estimation of Kyoto Protocol Products of Forests from Multitemporal Landsat," presented at IGARSS 2001, Sydney, Australia, 2001. H. Chen, "An Advanced Classification System for Processing Multitemporal Landsat Imagery and Producing Kyoto Protocol Products," in M.Sc. Thesis in Computer Science. Victoria: University of Victoria, 2004, pp. 99. R. J. Hall, "Alberta - Foothills Model Forest," vol. 2003. Edmonton: Natural Resources Canada, 2003. United Nations, "Kyoto Protocol to the United Nations Framework Convention on Climate Change - Article 5," 1997. BC Ministry of Forests, "Variable Density Yield Prediction (VDYP) Batch Application User Guide," Ministry of Forests, Resources Inventory Branch: Victoria, BC 1996. F. M. Gemmell and D. G. Goodenough, "Estimating Timber Volume from TM Data: The Importance of Scale and Accuracy of Forest Cover Data," presented at 18th Annual Conference of the Remote Sensing Society, University of Dundee, Scotland, 1992. R. W. Nielson, J. Dobie, and D. M. Wright, "Conversion factors for the forest products industry in Western Canada," Forintek Canada Corporation Special Publication, vol. SP-24R, 1985. W. A. Kurz and M. J. Apps, "A 70-year retrospective analysis of carbon fluxes in the Canadian forest sector," Ecological Applications, vol. 9, pp. 526-547, 1999. S. Linder and B. Axelsson, "Changes in C uptake and allocation patterns as a result of irrigation and fertilization in a young it Pinus sylvestris stand," presented at IUFRO Workshop, Oregon State University, Corvallis, 1982. A. Kuusk and T. Nilson, "A directional multispectral forest reflectance model," Remote Sensing of Environment, vol. 72, pp. 244–252, 2000. E. F. Vermote, D. Tanre, J. L. Deuze, M. Herman, and J. J. Morcrette, "Second simulation of the satellite signal in the solar spectrum, 6S - An overview," IEEE Trans. Geosci. Remote Sens., vol. 35, pp. 675-686, 1997. J. W. Goudie, K. J. Mitchell, and K. R. Polsson, "Managed stand yield and product tables for interior Lodgepole pine: initial density and precommercial thinning," B.C. Ministry of Forests Research Branch 1990. T. Nilson, "Forest reflectance model as an interface between satellite images and forestry databases," presented at Rogow99, Rogow, Poland, 1999. H. Chen, D. G. Goodenough, A. Dyk, S. McDonald, and T. Han, "Change Detection with ALI and Landsat Satellite Data," Proc. Analysis of Multi-temporal Remote Sensing Images, vol. 3, pp. 89-97, Joint Research Centre, Ispra, Italy, 2003.