Multispectral and Texture Feature Application in Mapping Summer Vegetation for Marco Polo Argali in Eastern Tajikistan Pamirs Eric Ariel L. Salas (
[email protected]), Kenneth Boykin (
[email protected]) and Raul Valdez (
[email protected]) Department of Fish, Wildlife and Conservation Ecology, New Mexico State University, Las Cruces, New Mexico, USA, 88003-8003 Overview
MD Framework and Performance Explained
We created and tested our own Moment Distance Index (MDI) in combination with texture features for the summer vegetation mapping in the eastern Pamir Mountains, Tajikistan using the 2014 Landsat OLI (Operational Land Imager) image. The five major classes identified were sparse vegetation, medium-dense vegetation, dense vegetation, barren land, and water bodies. By utilizing object features in a random forest (RF) classifier, the overall classification accuracy of the land cover maps were 92% using a set of variables including texture features and MDI, and 84% using a set of variables including texture but without MDI. A decrease of the Kappa statistics, from 0.89 to 0.79, was observed when MDI was removed from the set of predictor variables. McNemar’s test showed that the increase in the classification accuracy due to the addition of MDI was statistically significant (p < 0.05). The proposed method provides an effective way of discriminating sparse vegetation from barren land in an arid environment, such as the Pamir Mountains.
Study Area
𝜆𝑅𝑃
𝑀𝐷𝐿𝑃 =
𝑖=𝜆𝐿𝑃 𝜆𝐿𝑃
𝑀𝐷𝑅𝑃 =
𝑖=𝜆𝑅𝑃
𝜌𝑖 2 + 𝑖 − 𝜆𝐿𝑃
2
𝜌𝑖 2 + 𝜆𝑅𝑃 − 𝑖
2
𝑀𝐷𝐼 = 𝑀𝐷𝑅𝑃 − 𝑀𝐷𝐿𝑃
Set 1 (with MDI)
Class
Area (ha) Dense Vegetation
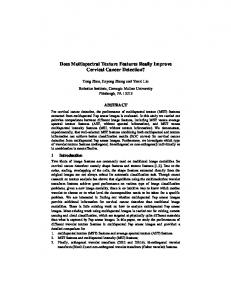
Figure 1: Location of the study area in the southeastern region of Tajikistan, based on a single Landsat 8 OLI scene from 15 July 2014.
Methods and Data
Figure 2: Schematic diagram of MDI applied on a sample spectral reflectance curve of a green vegetation. Set 2 (without MDI) Share Area (ha) (%)
Share (%)
3902.03
Figure 3: Sample illustrations of MDI applied to the reflectance responses of: (a) dense vegetation; (b) medium dense vegetation; (c) sparse vegetation; and (d) barren land.
1.62
2697.12
Set 1 (with MDI)
Set of Variables
Class
PA (%)
UA (%)
OA (%)
Set 2 (without MDI) Kappa Stats
PA (%)
UA (%)
95.9 94.7
93.4 91.2
3.93
Medium Dense Vegetation
86.3 88.0
75.9 79.0
220951.70
91.93
Sparse Vegetation
0.19
618.60
0.26
Barren Land
95.8 91.3
86.9 79.3
100.0
240354.09
100.0
Water Bodies
100
96.1 100
11676.41
Sparse Vegetation
20121.37
8.37
9452.93
Barren Land
204208.17
84.96
Water Bodies
446.11
Total
240354.09
4.86
6633.74
Kappa Stats
1.12 Dense Vegetation
Medium Dense Vegetation
OA (%)
2.76
83.2 89.0 92.1
100
0.89
68.5 76.0 84.0
0.79
Mosaic of different scenes
1 Predictor Variables No.
Variables
Data Sources
1
Normalized Difference Vegetation Index (NDVI)
Landsat 8
2
Digital Elevation Model (DEM)
Shuttle Radar Topography Mission (SRTM)
3
Modified Soil-adjusted Vegetation Index (MSAVI)
Landsat 8
4
Band 2 Blue (480 nm)
Landsat 8
5
Band 3 Green (560 nm)
Landsat 8
6
Band 4 Red (660 nm)
Landsat 8
7
Band 5 NIR (870 nm)
Landsat 8
8
Band 6 SWIR 1 (1610 nm)
Landsat 8
Band 7 SWIR 2 (2200 nm)
Image Preprocessing
3
Texture used: homogeneity, second moment, dissimilarity, entropy, contrast, mean, variance, and correlation
Texture Images Derived
0
Landsat 8
10
Slope
DEM
11
Aspect
DEM
12
MDI
Landsat 8
Algorithm was applied for cloud and shadow removal, snow removal
2
Object Features
9
Landsat 8 OLI image (July 2014) Download
4
Normalized Variable Importance 0.2 0.4 0.6
NDVI @ 30 MDI @ 40 DEM @ 30 MDI @ 30 NDVI @ 40 NDVI @ 10 NDVI @ 20 NDVI @ 50 DEM @ 40 MDI @ 20
9
Variables Important for Classification
5 6
0.8
7
8 Conclusion Landsat image plus a variety of ancillary data satisfactorily classified the five landcover classes analyzed in this study.
Image Segmentation The inclusion of texture images and the MDI variable in mapping the arid environment of our study area has shown to significantly increase the mapping accuracy than just using spectral information. We ran 312 input variables for two data sets.
Fieldwork geotagging of vegetation communities
Random Forest Classifier
(a) dense (b) medium dense and (c) sparse
Overall, our method and results not only provide a better understanding of the spatial distribution of the summer vegetation resources in the study area, but also demonstrate the relevance of specific variables in the classification process with Landsat data. Acknowledgement: This research was supported by Safari Club International Foundation (SCIF) Central Asia Program. Special thanks to Hosmer, President, and Mathew Eckert, Deputy Director of Conservation of SCIF. Article citation: http://www.mdpi.com/2072-4292/8/1/78/htm