Feb 9, 2011 - analysis. This means we have addressed pre-processing of the data, ... Multivariate statistics is simply the statistical analysis of more than one ...
Multivariate methods used in metabolomics; from pre-processing to dimension reduction and statistical analysis Kristian Hovde Liland 9th February 2011
Department of Chemistry, Biotechnology and Food Sciences The Norwegian University of Life Sciences
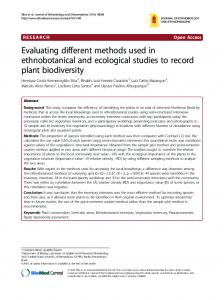
Abstract In this paper we present some of the multivariate methods used in metabolomics. The paper addresses many of the data types and associated analyses of current instrumentation and applications seen from a data analytical point of view. We have tried to cover most of the statistical pipeline from pre-processing to the final results of the statistical analysis. This means we have addressed pre-processing of the data, regression, classification, clustering, validation and related subjects. Emphasis is mostly on descriptions of the methods in addition to their advantages and weaknesses and usefulness in metabolomics. The selection of presented methods is of course not an exhaustive representation of the field, but should shed some light on a portion of the more popular and relevant methods.
1
Introduction
In modern biology there is a hierarchy of ’omics’ terms dividing research into areas that can both be studied separately and as interacting phenomena. The basic research field with longest history of using the ’omics’ term in this sense is genomics. This is the study of the genome with all its genes, functions, pathways, feedbacks and so on. Another of the large ’omics’ fields is proteomics, dealing with large scale studies of proteins, their structures and functions. In between these there is transcriptomics dealing with the set of all RNA molecules produced in a population of cells. In addition to these there are a lot of fields that have adapted the ’omics’ term, among which we find metabolomics. Even though an essential part of the study of organisms, their functions, potentials, weaknesses, diseases and so on, metabolomics is often not included in the hierarchy of genomics, transcriptomics, proteomics (and metabolomics). From the many variations of definitions of metabolomics, one which is straight to the point and quite general is: “Metabolomics is the ’systematic study of the unique chemical fingerprints that specific cellular processes leave behind’ specifically, the study of their small-molecule metabolite profiles [1]”. Even though it does not capture the subtle differences between metabolomics, metabonomics, metabolic fingerprinting, metabolic profiling, metabolic footprinting, 1
metabolite target analysis and other related concepts, it is easily understood for non-experts. To be more precise one could define metabolomics as “(Non-biased) identification and quantification of all metabolites in a biological system [2]”, as opposed to more targeted analysis of known and selected metabolites. When trying to record the metabolic state of a biological system the most common tools are nuclear magnetic resonance spectroscopy (NMR) and mass spectrometry (MS), sometimes combined with some sort of chromatographic spearation. Common for all methods is that they produce a vast amount of data which only rarely can be handled completely manually and without the use of statistics. As the spectra recorded are highly multivariate it is natural to apply multivariate methods, dealing with a large number of variables simultaneously, when analysing them instead of traditional statistical methods dealing with single variables or small groups of variables.
2
Metabolomic data
Both NMR and MS come in a vast array of different versions and set-ups, either as standalone instruments or combined with separation instruments like gas chromatography (GC), liquid chromatograhpy (LC), or capillary electrophoresis (CE). Some popular variants and combinations are different versions of 2D NMR, MS-MS, GC-MS and LC-MS, but also GC-NMR, LC-NMR, GC-GC-MS, coupling with spectroscopic instruments and other combinations are used. This results in data having one or more dimensions per observation (from vectors up to multi-way arrays). Spectra from NMR can contain information on abundance, location and function of element in molecules (e.g. Figure 5). The most studied elements in metabolomics are 1 H and 13 C, though a dozen or so other elements are common in high-field NMR and more than fifty additional elements are used in some studies. Small samples can be liquid or solid and are placed in stationary tubes, rotating tubes or continuous flow systems. Larger samples can also include humans and other living organisms, as in hospital MR scanners. The most common type of raw NMR signal is a free induction decay that must be Fourier Transformed from its time-domain to its frequency-domain before analysis. Spectra from MS show the masses of analysed compounds or their fragments, typically measured by their time-offlight when exposed to an electrical field. When coupled with separation instruments there will be one or more retention/elution time dimensions giving a series of repeated mass spectra (e.g. Figure 9). If one sums or integrates away the MS dimension, one typically is left with the total ion chromatogram (TIC) which is sometimes used alone in analyses, though the information in the MS dimension is usually invaluable.
3
Multivariate statistics
Multivariate statistics is simply the statistical analysis of more than one statistical variable simultaneously. That being said, multivariate statistics is a large discipline with too many general and specialised methods to go into details about in this paper. Instead we will focus on some of the more interesting when dealing with metabolomic data. Figure 1 shows one suggestion by Ebbels et al. [3] of the steps of statistical analyses of NMR metabolic profiles (which is more specialised than general metabolomics). The main focus in this paper will be on pre-processing, explorative data analysis using unsupervised and supervised methods, prediction, visualisation and validation.
2
Figure 1 A schematic diagram of the steps involved and information recovered in the statistical analysis of NMR metabolic profiles (Diagram copied from Ebbels et al. [3])
3.1
Planning experiments
Good planning of experiments is of paramount importance for obtaining high quality data that are relevant for the problem one wants to assess, be it in metabolomics or any other discipline. The simplest and most effective way of limiting bias from different sources, e.g. instrumental drift, metabolite decay or researcher effects, is to randomise everything that is feasible to randomise in the experiments. Possible targets for randomisation could be the order in which samples are prepared, which samples are handled by which researcher, the order of analysis in the instruments and so on. Needless to say, the randomisations should be made by software and not ad hoc human randomisation. In addition to randomising, experimental designs are of high importance to ensure that as much information as possible is collected with as little effort as possible while minimising random variation and bias. Many designs exist for different purposes like mixture designs, factorial designs, central composite designs and a variety of optimal designs [4], but this is a subject large enough for a paper of its own, even when only considering metabolomic applications.
3.2
Pre-processing
Pre-processing and pre-treatment of the data are two terms that are used differently in various fields of science. Ebbels et al. [3] refer to pre-processing as phasing of Fourier Transforms in NMR, deconvolution of overlapping metabolites in LC/MS / GC/MS and other techniques used either when extracting the data or when preparing the dataset for analysis. They reserve pre-treatment for normalisation, scaling, baseline correction and other methods used on the dataset to make samples analysable and comparable. In chemometrics and applied statistics pre-processing is used as a common term covering all editing of the data up to point of starting the statistical analysis. We will cover briefly some of the pre-processing techniques associated with multivariate analysis in the following. The order of execution is open for debate and sometimes more governed by practical considerations than optimal statistical analysis. Binning When continuous spectra are recorded by NMR or other techniques producing tens or hundreds of thousands of measurements per spectrum, binning can sometimes be smart. Here binning (also called bucketing) means dividing your spectrum into a desired number of bins, the same way as for histograms, and summing all measurements inside each bin to form new spectra with fewer variables. There are several reasons for doing this, and the way it is done will affect the results of the analysis. The simplest reason for binning is that the number of variables can be too high for handling of the problem in ordinary computer memory. More interesting is the implicit smoothing of the spectra achieved by 3
the binning and the potential for correcting small peak shifts. Both can be harmful if left untreated when sensitive multivariate analysis techniques are used later, making it more likely that these analyses will be affected by spurious correlations in the noise. Another aspect is the resolution of the information that one can hope to achieve by the instrument at hand and the informative resolution of the metabolites being analysed. There is no extra information gain from having a spectral resolution much higher than the physical peak resolution of the compounds generating the spectra. If the volume and uniqueness of a peak can be described by three numbers, there is no reason for including another twenty numbers to describe its shape if we are only interested in the volume and uniqueness. Bad placing of the bins can also remove information or produce false information. If the bins are too wide they may cover more than one real peak and thus lowering the information content. If a peak is slightly shifted, its top may fall into the wrong bin, add to a neighbouring peak’s volume or be split over two bins, which all would make a subsequent statistical analysis less precise. In Figure 2 (a) we see an example of binning (wide bins) where some peak tops are close to the bin borders so that minor shifts will move the top to another bin. In part (b) of the figure we see two spectra that would have had some of their peak tops assigned to different bins using the same bin widths as in (a). Figure 2 Example of binning (very coarse for this example) and two spectra in need of peak alignment (NMR spectra). A slight shift in peaks or bins in Figure a) will alter the resulting spectrum as peaks are assigned partially or fully to a neighbouring bin. (a) Binning −3
x 10 10 8 6 4 2 0
3.3
3.28
3.26
3.24
3.22
3.2
(b) Need for alignment 0.035 0.03 0.025 0.02 0.015 0.01 0.005 0
3.29
3.28
3.27
3.26
3.25
3.24
3.23
3.22
3.21
3.2
Peak alignment Both in chromatography and NMR, and to smaller extents in MS, peaks can be shifted, e.g. due to instrumental variations or interferents in the analysis. This means that the elution time, retention time, ppm or other measures are not uniquely defined for each metabolite across instruments, across experiments or even across samples in an experiment. Such shifts need to be corrected for before statistical analyses so that each metabolite appears where one would expect it. Figure 2 (b) shows parts of two NMR spectra that are in need of alignment. The simplest form of peak alignment is to divide the spectra at hand into a number of local windows where peaks are shifted to match across spectra. This is fast since everything is done locally, but may lead to mis-alignment when peaks fall into the wrong local window or are split into two windows, just as when binning. One of the more robust peak alignment procedures originally made for chromatographic data is called correlation 4
optimised warping (COW) [5]. It uses two parameters; section length and flexibility, to control how spectra can be warped towards a reference spectrum. The section length is used to divide the spectra into sections that can be stretched and compressed as much as the flexibility parameter allows by moving the endpoints of the sections. This means rigid local windows are avoided, and no single peaks are moved independently of their respective neighbourhoods. Since the optimality criterion is based on correlation, COW does not rely on baseline correction before being used. COW has showed great potential on several types of data, but as pointed out by Tomasi et al. [6] it should be handled with great care and applied with rigid settings to avoid mis-alignments. A newer and much quicker method employing Fast Fourier Transforms is the icoshift procedure [7]. Baseline correction Raw data from GC-MS, LC-MS and other instrumental measurements often have an unwanted linear or non-linear addition along the spectra. These elevations can come from varying sources such as column bleed in chromatography, non-linearities in detectors, accumulation of less abundant compounds and other instrumental or sample specific sources. Most statistical analysis techniques are not able to distinguish between baselines and signal and therefore will be affected by such distortions. Baseline elevations will also affect quantification of metabolites when true zero values are shifted upwards so that peak volumes are increased. The free induction decay signal of NMR is baseline corrected through phase corrections and other techniques, but further improvements in predictions from frequency domain spectra can sometimes be achieved through baseline correction as described here. There is a vast number of baseline correction methods available, but the most popular category by far is the family of polynomial fitting baselines, e.g. Lieber and Mahadevan-Jansen’s [8] iterative polynomial fitting. However, restricting the shape of the baseline to a polynomial is not always the best choice. Methods like asymmetric least squares (ALS) [9] and robust baseline estimation (RBE) [10] use other constraints on the shape of the baseline that often give more sense. The former fits a regression curve under the spectrum, weighting down positive residuals and using a second derivative constraint to control the rigidity of the baseline as shown in Figure 3 (a). This is quite intuitive and often yields more robust estimates of the baselines without strange artifacts at the ends of the spectra, which sometimes occur with polynomials. A procedure for choosing baseline algorithms and their parameters objectively is described in Liland et al. [11]. Normalisation Samples containing metabolites can have varying concentrations of the analysed compounds from subject to subject. Spectra from MS can also vary in intensity due to differing amounts of metabolites reaching the detectors. These types of variations are more or less global across the spectrum, meaning that a common scaling of all variables based on some common measure will make the samples comparable despite intensity variations in the raw spectra. Some of the more common measures used for normalisations are the mean, the median, the total standard deviation, the total area under the curve (Figure 3 (b)) and the length of the spectrum vector. Depending on the application and the known variations between samples, the choice of normalisation will differ. The median can sometimes be more robust than the mean when the number of peaks varies a lot from sample to sample, and the total area under the curve is usually only p times the mean, where p is the number of variables. If a stable standard has been added to the sample, e.g. TSP or TMS in NMR or another compound of known concentration or peak height, this can be a good choice to normalise with respect to if the absolute concentration in each sample is most interesting. Using a standard means the normalisation measure is not affected by the number of peaks or other interfering phenomena, and thus quantification of metabolites in different samples may be more precise. Scaling A much more risky business than normalisation is individual scaling of variables. In samples where variables are 5
Figure 3 Example of baseline estimation and total area under the curve normalisation (NMR spectrum) (a) Baseline estimation 0.02
0.015
0.01
0.005
0
4.5
4
3.5
3
2.5
2
1.5
1
(b) Total area under the curve normalised (same spectrum, different yscale) −3
2
x 10
1.5
1
0.5
0
4.5
4
3.5
3
2.5
2
1.5
1
measured on different scales, e.g. meters and grams, scaling by the standard deviation is usually done by default to make the variables somewhat comparable. Scaling of spectra usually has other motives like reducing the influence of highly inconsistent variables. The noise increases with the intensity in most types of spectra, e.g. in time-of-flight (TOF) MS where the ion count can be seen as a Poisson process giving a linear increase in variance with intensity. By scaling down variables with high variation we often scale down the peaks and scale up the baseline. This effect will be even worse if there are large differences between samples so that the peaks holding the most information about sample differences are scaled down even more. Some sources include mean centring as a scaling technique since it is done per variable across samples. However, this is usually done explicitly or implicitly in the statistical analysis later instead. Mean centring is a more stable technique, than scaling by for instance standard deviations, that emphasises the differences between samples, e.g. different metabolite concentrations. It is important to keep in mind that the mean centring performed on a calibration data set in a statistical analysis has to be stored and reused on future data that should be predicted or compared by models based on the calibration data. Data transformations can also be put into the group of scaling. The Poisson nature of TOF MS means a square root transformation is often used (as in Figure 4 (a)) resulting in a re-interpretation of the spectra from mass-to-charge to √ time-of-flight times a common constant: xi = ti × k 0 [12]. If metabolites are present in very different concentrations one might need to do a transformation like the fourth root or logarithm to reduce the chance of having the statistical analysis only focusing on the higher concentration metabolites. The downside of all the mentioned transformations is that they also inflate the noise, at least if performed directly on the spectra without any prior peak detection, giving more of a challenge to the statistical analysis. Smoothing If the signal-to-noise ratio is high or the subsequent analysis methods are very sensitive to noise, smoothing of the spectra may help, both for visual interpretation and robustness of the analysis. Again there are many ways of smoothing, e.g. by applying local medians, fitting curves with second derivative constraints (see Figure 4 (b)), applying locally weighted scatterplot smoothers or using wavelets. The trick is to smooth enough to reduce the noise while retaining as 6
Figure 4 Example of square root transformation followed by smoothing by applying a 2nd derivative constraint (the same NMR spectrum as Figure 3 is used for comparison, even though the square root is usually not applied to NMR spectra) (a) Square root transformation 0.14 0.12 0.1 0.08 0.06 0.04 0.02 0 −0.02
4.5
4
3.5
3
2.5
2
1.5
1
3.5
3
2.5
2
1.5
1
(b) Smoothing 0.14 0.12 0.1 0.08 0.06 0.04 0.02 0 −0.02
4.5
4
much as possible of the peaks, especially the small ones. To estimate the amount of smoothing needed one can for instance calculate the standard deviation in an area of the spectrum not containing peaks or use some kind of comparison of smoothed and original spectra to check if too much or to little has been removed. A family of undecimated discrete wavelet transforms with Daubechies filters [13] (found in the Rice Wavelet Tools for MATLAB) enables quite heavy smoothing while usually capturing the full height and volume of the peaks. Also smoothing by the use of a weighting function can help in applying the correct amount of smoothing to the different parts of the spectra. Order of execution As mentioned earlier, the order of the pre-processing steps is not always obvious. The square root transformation should strictly seen be done on the raw data for the Poisson assumptions to hold, and therefore be done before any baseline correction and normalisation. On the other hand, the desired effect of the log transformation might be best achieved if done after normalisations and baseline corrections. If smoothing is wanted this might best be performed before any log transformation so that the noise is smoothed out as much as possible before it is inflated. It may also be useful to perform the smoothing before the baseline correction to ensure that true zero values are as close to zero as possible. The earlier in the process the binning is performed, the less memory and time the data will consume in the following operations. However, as mentioned binning can harm the peak alignment, so alignment might be preferable to do before binning. If the intensity of the spectra differ greatly, the baseline correction might be affected, meaning that baseline algorithms may benefit from prior normalisation. But the act of subtracting the baseline alters the normalisation of the spectrum as the total area under the curve is reduced together with the mean and median. If normalisation is not done with regard to internal standards this favours normalisation after baseline correction. A possible order of pre-processing techniques on time-of-flight (TOF) MS spectra is given in Algorithm 1.
3.3
Basic plotting and summaries
Before starting any statistical analysis it is wise to do some basic plotting and maybe compute some summaries of the data to see if the data are as one would expect. With a limited number of spectra or chromatograms one can often 7
Algorithm 1 Hypothetical order of pre-processing/pre-treatment of TOF MS spectra with chromatographic shift, higher resolution than needed and metabolites with concentrations differing by several orders of magnitude. 1. Transformation by square root 2. Peak alignment by icoshift 3. Binning 4. Normalisation by mean division 5. Smoothing with wavelets 6. Baseline correction by alternating least squares 7. Normalisation by mean division 8. Transformation by the natural logarithm
spot if an experiment has produced strange artifacts or very poor data just by plotting all spectra together as in Figure 5 or by browsing quickly through them. This simple step means potentially time consuming analyses giving strange or uninterpretable results can be avoided if something has gone wrong. Computing for instance standard deviations or signal-to-noise ratios for the spectra can give a quick summary for spotting strange behaviour and assessing the level of performance one could expect to see from the subsequent analysis even with large data sets. If replicates are included in the experiments, measures of (non-)repeatability can be computed, e.g. the lack of repeatability estimated by the Pnvariables std.dev.(xi ) mean coefficient of variation: 1/nvariables i=1 mean(xi ) for each set of replicates. This could either be used to spot outliers or to give an idea of the stability of the experiment. Figure 5 Example of plotting all spectra in a data set, including a magnification of the TSP peak at 0 ppm (NMR spectra). 0.02 0.08
0.01
0
−0.01
−0.02
0.08
0.06 0.06 0.04 0.04
0.02 0
0.02
0 8
3.4
7
6
5
4
3
2
1
0
Regression and classification
When the data being analysed has some sort of response attached to each sample, this can often be used for creating models either for prediction of the response, for exploring the mechanisms of the model, for finding important variables, e.g. biomarkers, or for other purposes. The two main types of responses are continuous (regression) and discrete (classification). In addition there exists ordinal responses and related types. Multiple linear regression With continuous responses, e.g. the amount of insulin produced, the heart rate, the total metabolic rate of a system or other non-categorical, measurable quantities of interest, one of the most basic models is the multiple linear regression model (MLR), sometimes called ordinary least squares (OLS). In MLR one looks for the line (or curve, plane or other generalisation) minimising the sum of squared deviations between the fitted response and the true response by projecting the response into the space spanned by the explanatory variables. If one imagines that two metabolites involved in the production of insulin were easily measured, while insulin itself was more difficult to measure, one could make a regression model for predicting the insulin concentration in the blood from the concentration of the other two metabolites. 8
ˆ = Xβ = X(X0 X)−1 X0 y, where X is a centred matrix of explanatory In general the fitted response is calculated as y variables (column vectors), e.g. the concentration of metabolites involved in insulin production and β is the regression vector mapping from explanatory variables to fitted values, e.g. estimated insulin concentration. As long as the number of observations is higher than the number of explanatory variables and these variables are not too multi-collinear MLR is stable, though its level of success is dependent on explanatory variables that span a relevant space with regard to the response and a limited amount of noise. With the majority of metabolomics data the number of variables is much higher than the number of observations, e.g. NMR spectra, which means the inversion (X0 X)−1 has no solution (singular covariance matrix). This means the data in X needs to be compressed, e.g. by one of the methods which will be explained in Section 3.5 about bilinear factor models. This is also the case for the two next methods. K nearest neighbours For discrete responses one of the most basic ways of classifying a new object into groups specified on a calibration data set is to use the K nearest neighbours (KNN) approach. Here an observation is classified to the group which it has most neighbours from, e.g. classifying a patient as having Alzheimer’s disease by comparing metabolite expressions to known cases based on a majority vote in the space spanned by the explanatory variables. This is an intuitive and easily implemented method which has some flexibility in choosing the number K of neighbours. Two drawbacks are that the calibration data has to be stored for classification and that the space spanned by the explanatory variables becomes extremely sparse when there are many variables, as with most NMR and MS techniques. Discriminant analysis The two most popular forms of discriminant analysis are linear (LDA) and quadratic (QDA) [14] which are two classification methods for discrete responses. Linear and quadratic refers to the borders between neighbouring groups which are either lines/(hyper)planes or curves/curved (hyper)planes. In QDA each group is modelled by a separate normal density and a prior probability. Classification of new observations is done by choosing the group which has the highest posterior probability: P (group = k|X) = PGpriork ·density(X|group=k) . The posterior probabilities give us hints g=1
priorg ·density(X|group=g)
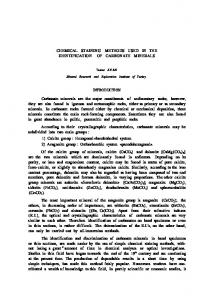
about how much confidence we should have in the classification. In LDA the procedure is exactly the same, but we assume that the densities have equal covariance structures. This simplifies the computations and makes the method more robust but also looses some of the flexibility with curved classification borders. A modification of KNN called discriminant adaptive nearest neighbor classification [15] uses some theory from discriminant analysis to adapt the shape of the neighbourhoods to better follow the boundaries between groups for observations close to the boundaries. Support vector machines A supervised learning, non-linear, kernel based family of methods which can be used both for regression and clasification is called support vector machines (SVM) [16]. It is a machine learning algorithm that has been applied to metabolomics data with success [17]. In its basic form the support vectors are samples on the margin between two classes used to search for a separating (maximum margin) hyperplane, e.g. Figure 6. Through kernels the problems at hand can be transformed into more general spaces making separationg of classes simpler for complex cases, giving non-linear solutions in the original space. Different extensions give rise to classification with overlapping groups, multi-class classification, regression and specialisations. Basic SVM algorithms do not consider prior information about class member probabilities and consider only samples lying on or close to the boundary between classes. In addition the method can be very time consuming when tuning complex separating hyperplanes. Though on average usually giving rise to good results, it is often outperformed by faster and more stable methods [18]. Random forests The principles of bagging (combining many models) and random feature selection are used for constructing a set of 9
Figure 6 Example of maximum margin hyperplane in support vector machines. Support vectors (x) are marked circles on dashed lines. w is a vector perpendicular to the hyperplane used for maximising the distance between groups.
descision trees in the ensemble classifier called random forests[19]. It uses bootstrap sampling for creating many sets of randomly chosen objects and creates descision trees where each node’s descision is based on a random set of features. This results in a powerful classifier that can handle many variables and estimate variable importance. It has been shown to sometimes overfit on noisy data and does not handle large numbers of irrelevant fetaures very well, though these problems may be less severe than with SVM [20].
3.5
Bilinear factor models
When working with multivariate data, severe multi-collinearity is most often the case as the number of variables usually exceeds the number of observations. Both NMR and MS techniques produce data with thousands of variables, while time and cost usually limits the number of samples to less than a hundred, at best a few hundred or a few thousand in large screening experiments. Bilinear factors models are models specially designed to overcome the dimensionality problems and take advantage of the collinearity, usually through compression down to simple components and pseudo variables in the form of weighted linear combinations of the original data. Principal component analysis The basic bilinear factor model is the unsupervised method called principal component analysis (PCA). Unsupervised here refers to that the modelling is done without user intervention and solely on the explanatory variables, leaving any responses for optional later stages in the process. PCA decomposes the data into score vectors and loading vectors which when taken outer products of and summed will recreate the original data. The directions of the loadings are placed so that they maximise the variation spanned by each vector, having most variation in the first component and subsequent orthogonal components with decreasing amounts of variation. Usually the most interesting phenomena can be observed in the first few components while the majority of components are regarded as uninteresting or noise. Plotting score vectors against each other, often with colour codes, can help elucidate relations between observations and how these are connected and grouped, as in Figure 3.5 (a). Loading vectors plotted as spectra can show where the components found their variation and thereby which metabolites have affected the relations in the score vectors, as in Figure 3.5 (b). Plotting loading vectors against each other also reveals information on the connection between variables. The combination of loading and score plots in biplots will often reveal which observations are connected to 10
which variables. This is especially interesting when trying to match patients or diagnoses to metabolites or groups of metabolites. Figure 7 Score plot with colour coded groups and loading plot from NMR (a) Score plot
(b) Loading plot 0.2 0.1 0 −0.1 8
7
6
5
4
3
2
1
0
Among the disadvantages of PCA is that the orthogonality between components imposes a rigid structure which is well suited for extracting as much information as possible from the samples but does not separate natural phenomena well in the components, as most naturally occurring phenomena are not orthogonal. Both the alternating least squares variant of PCA withouht orthogonalisation and independent component analysis [21] have more success in this respect at the expense of less compression in the first components. The use of score vectors from PCA in multiple linear regression leads to principal component regression. This enables regression on data sets with multi-collinearity and gives orthogonal components, often improving interpretation and model assumptions. Partial least squares When an informative response, such as disease state, dietary habits, sex or other sample specific information, is available the family of partial least squares (PLS) [22] can often do a more efficient and interpretable decomposition than PCA. With a single continuous response PLS regression (PLSR) maximises the covariance between the explanatory variables (X) and the response (y) instead of only maximising the variation in X. As with PCA score vectors and loading vectors are formed. PLSR uses MLR on the score vectors to perform the regression. If the response is intake of sucrose and the explanatory variables are metabolites in NMR spectra, PLS will model directly the interaction between the metabolites and the sucrose intake, enabling prediction of the sucrose intake. When PLS is used with a discrete response to form PLS discriminant analysis (PLS-DA) [23] the maximisation is done on the estimated between groups covariance matrix instead, possibly weighted by group sizes or custom weights [24]. PLS-DA is often combined with LDA/QDA for classification of the discrete response. There is also a multiresponse (continuous) version of PLS called PLS2 and PLS versions that can use continuous and discrete responses simultaneously (also adding possibilities of additional responses and sample weights) called canonical PLS (CPLS) [25]. Versions of PLS and PLS-DA that separate out response orthogonal variations in X component-wise are called OPLS 11
[26] and OPLS-DA [27]. Though these can be shown to be rotations of the original PLS and PLS-DA solutions, they have an advantage with respect to interpretability as the rotations are often beneficial with regards to plotting and directions of components. They have become popular in metabolomics because of this (e.g. [28]). Another extension of the PLS family is the power methodology proposed by Indahl [29] (PPLS) and adapted to PPLS-DA [30] and CPPLS [25]. This enables more focus on explanatory variables highly correlated to the response or with high standard deviations often resulting in models needing fewer components and simpler interpretations. SIMCA and DASCO Soft independent modelling of class analogies (SIMCA) [31] is presented somewhat differently in different publications. Common for these is that the method is a classification method constructing separate PCA models for each group and enabling classification of samples into none, one or several groups. It has a strength in that it enables construction of a single-group classifier, e.g. a group surrounded by another in all directions which is impossible for LDA to handle well as in Figure 8. Discriminant analysis with shrunken covariances (DASCO) [32] is related to SIMCA and QDA, but also has several variants and definitions. It redefines the SIMCA classification, which is based on a Euclidean distances from the class models, by including also the sizes of the class models and information from the part of the space not spanned by the PCA models. None of these methods are very intuitive in their theory but especially SIMCA is popular in some environments. Figure 8 Example of a one-class SIMCA classifier (Figure copied from Trygg et al. [33])
3.6
Trilinear factor models
When working with GC/MS, LC/MS, 2D-NMR and related techniques each sample generates a matrix, cube or hypercube of variables. Traditionally these multi-way data are analysed vector by vector, matrix by matrix or by first deflating, collapsing or summing some dimensions to form matrices. All these analysis techniques remove a lot of the structure from the data including correlations between neighbouring variables in many dimensions. Rather than making one or two dimensional data from the multi-way structures, trilinear factor models analyse the multi-way structures directly, decomposing all directions (modes) simultaneously. This can give huge benefits with regards to simplicity of analysis, uniqueness and power of the results. The most used trilinear factor model in metabolomics is parallel factor analysis (PARAFAC) [35] which can be seen as an extension of PCA to three or more modes. Instead of pairs of loading vectors and score vectors it produces sets of loading and score tensors (multi-way generalisations of vectors). The extracted components are no longer orthogonal and have no natural ordering with regard to the amount of variation spanned by each. On the other hand these components will, if used correctly, usually model true physical phenomena, e.g. metabolites, in each component. In addition constraints like non-negativity (natural for elution and m/z) and unimodality (one peak) can easily be added
12
Figure 9 Two co-eluting metabolites modelled by PARAFAC. One sample is shown as tensor loadings (top) and as tensor products (bottom). The three components model one metabolite each plus the baseline. (Figure copied from Skov and Bro [34])
to the model to ease the modelling and ensure correct decomposing of the data. Figure 9 shows the first sample from a three component PARAFAC decomposition of GC/MS data with two metabolites having overlapping elution profiles and mass spectra. Estimated chromatograms and mass spectra for the metabolites are shown in the form of tensor loadings and two dimensional profiles.
3.7
Clustering
There are many reasons to apply clustering to data, e.g. to explore relationships and natural groups in the data, to try to confirm known groupings, to construct new groups and so on. Clustering can be performed both on variables and samples, meaning we could cluster patients, specimens, bacteria or other samples, or metabolites, masses, retention times or other variables. Often the visual impression of clustering is the most important, usually in the form of dendrograms or as borders or colour codes on score or loading plots. Clustering is often considered an art form as results are highly dependent on methods, metrics and user choices. Clustering, like classification, can be done with discrete, non-overlapping groups or fuzzy, i.e. with probabilities of memberships. Hierarchical clustering may be the most widely used in the former category. Here all samples or variables are initially treated as separate groups and then merged one by one based on similarities, usually in the form of distances or correlations. There are many ways to do the actual merging which leads to different clustering, e.g leading to chains, compact clusters or something in between, and sometimes yielding almost identical results. Displaying the result as a dendrogram as in Figure 10, the choice of cut-off for the similarity will dictate how many groups there will be. Another popular clustering method is called K-means (or K-medoids depending on the statistic used). Here the user first chooses the number of clusters. These are randomly initiated in the space spanned by the samples or the variables. The algorithm oscillates between assigning samples/variables to the nearest cluster centre and adjusting the centre to fit its members until convergence. As a distance matrix is not explicitly calculated, this algorithm is less memory demanding than hierarchical clustering, objects can switch clusters during the iterations, but the clustering is dependent on the initial guess and clusters can become empty. Which algorithm to use in metabolomic problems is dependent on the data set at hand, possible prior assumptions about the number of groups and the way one wants to present the data. Clustering can also be done on multi-way data. An exploratory clustering tool aimed at metabolite profiling has been made by Acar et al. [36] (MATLAB code freely available). Here a PARAFAC (or the related Tucker3) model is first made on three-way data and hierarchical clustering is applied on the mode of interest. The program makes it easy
13
Figure 10 Example of hierarchical clustering (Figure copied from Acar et al. [36])
to look into other modes than the one used for clustering to see what phenomena are causing the clustering. In the mentioned paper clustering of commercial extracts of St. John’s wort analysed by HPLC-PDA is used to see which metabolites cause regional differences.
3.8
Data fusion
A single analysis instrument may not be enough to elucidate all aspects of the metabolomic problem at hand. In such cases fusion of data from two or more instruments like NMR, GC/MS or LC/MS can prove valuable [37]. The simplest form of fusion is to concatenate the data matrices, so that the explanatory variables follow each other in the data sets, and analyse them as usual. This is seldom a good idea and leads to very wide matrices. One could simplify the matrices before concatenation by doing a variable selection to improve on this. Multiblock and hierarchical PCA and PLS methods [38] (and to some extent multiblock three-way methods) are usually much more handy and powerful tools for data fusion. Here the matrices coming from different instruments are most often analysed on two levels; a sub level having score vectors and loading vectors for each data matrix and a super level combining these and possibly relating them to a response. In metabolomics this means that we can analyse the samples on the instruments which are best suited for each set of metabolites and then combine them into a common analysis. This will both give a better total understanding of the problem on the super level and will show what has contributed on the sub level. Another data fusion technique is called statistical heterospectroscopy [39]. Here the correlation between the explanatory variables of two data sets are used to search for interesting metabolites. Correlations between data sets, e.g. NMR and LC/MS, are visualised for all combinations having high statistical confidence. This simple technique means that metabolites that are clearly visible in one of the data sets may be spotted in the second set because of consistent correlations, even though an analysis of the second set alone would not have been able to spot this. Especially the search for biomarker candidates can be helped through this technique.
14
3.9
More methods
Even though we have mentioned quite a few methods in this paper, we are only scratching the surface of the enormous amount of multivariate statistical methods applicable for metabolomic analysis. Most of the methods handled here are commonly used in metabolomics while a few, like PPLS-DA and CPPLS, have potential for doing well but have not been tested on metabolomics data. Strictly speaking simple testing, like t-tests and F-tests, can fall into the group of multivariate methods as long as more than one variable is used in the test. Some multivariate methods widely used in metabolomics that there was not room to describe in the limited space available here are support neural networks, clustering by Gaussian mixture modelling, self-organising maps, multivariate curve resolution (MCR) and classical least squares (CLS). Especially the two last mentioned methods are interesting when working with metabolites and quantification. In MCR spectra from pure compounds and their respective concentrations in the samples are estimated from mixtures. This can be done both for two-way and three-way data [40], and can even handle compounds that do not elute at the same time in different data sets. With CLS concentrations of compounds are efficiently estimated from mixtures if pure spectra are available, e.g. as in Galera et al. [41].
3.10
Validation
In explorative and predictive multivariate analysis one can be as creative and advanced as on wishes when creating and using methods as long as the three main principles of statistics are followed: validation, validation and validation. Without proper validation the risk of over-fitting is very high for many methods when used aggressively. Especially when results from the analyses will be used later in clinical applications, e.g. in disease diagnostics, the validity of the results is of high importance to reduce stress and maltreatment of patients. In multivariate statistics the two most widely used validation methods are cross-validation [42] and test set validation. The latter consists in having a separate data set which will be used to check if the results of the statistical analysis are valid on new data and how well they fit. This should preferably be independent of the main data set used for calibration of the models. If the test data have been kept completely separate from the calibration process, the validation will hopefully reveal the reproducibility and accuracy of the models produced. When applying calibration models on the test data it is important that these are treated exactly the same way, i.e. pre-processed with the same methods, e.g. centred using the mean values of the training data. In many cases one large data set will be partitioned into a calibration set and a validation set, e.g when a completely separate test set is not available. If this is the case or not, it is important that the validation data span a relevant portion of the sample space one could expect to see in real life and in such being sufficiently difficult for the methods validated to not give overly optimistic results. Some consider test set validation the only true validation, though especially in chemometrics there are many examples of only using the other main type of validation, namely cross-validation. Cross-validation is a validation technique where the calibration data are split into K equally sized (approximately) blocks. These blocks can range from single samples to half the data set and can be sampled as consecutive, interleaved or randomised. The idea is to hold each of the K blocks out once each, train the model on the rest of the blocks and use the block held out for validation. Cross-validation is usually performed to compare similar models or choose the complexity of the model and also to get an impression of the level of error one can expect from new, comparable data in prediction. As mentioned some also use it for the final validation to directly estimate the level of the expected future error, but this has been shown to not to be a very reliable strategy.
15
There are several randomisation based validation techniques that can shed more light on the models and samples involved and that can be used in more specialised situations. The most used are bootstrapping and permutation tests. Boostrapping [43] usually involves sampling with replacement from a dataset (non-parametric) or adding random noise from a known distribution to the data (parametric) to estimate properties of the underlying sampling distribution or robustify estimates of statistics and confidence intervals. Elements from bootstrapping are also used in other methods like Random Forests. Permutation testing is based on repeatedly permuting the responses/labels of samples to estimate the distribution under the null hypothesis of a test, i.e. disconnecting the observations from their response value to see if the value of the observed statistic is significantly better than it would be using random relations. Rotation tests [44] are generalisations of permutation tests where the observations are randomly rotated in the data space conditioned on the covariance matrix. This gives a continuous equivalent to discrete permutations and is more suited for small data sets while still maintaining the original covariance structure of the data. Rotation tests have been used with success in gene set enrichment analysis on small data sets [45], but could prove a valuable contribution in metabolomics.
4
Discussion
In this paper we have presented a brief overview of some of the methods often used or highly relevant for metabolomic data analysis. These range from pre-processing via dimension reduction, regression and classification, clustering and estimation of concentrations using pure spectra, to validation of the analysis. By this we have touched some of the data analytical steps proposed in Figure 1. The methods that have been presented here can be used in most of the metabolite research fields in addition to strict metabolomics. Pre-processing is needed for almost all types of data, but the choices would be so different from data type to data type that a general advise is impossible. However, with NMR and to some extent chromatgraphic data there is often a need for peak alignment. Data from MS is usually in need of baseline correction. And almost all data need of some kind of normalisation. With ever increasing resolution, accuracy of instruments and sheer information content, compression or variable selection in many cases are unavoidable. For exploration of data and as preparation for clustering PCA and PARAFAC/Tucker methods can be good alternatives, while (n-)PLS types of compression are more efficient when regression or classification is required. In the choice of regression and classification methods, this becomes a question of robustness/adaptability, linearity/non-linearity, interpretability, and ultimately time consumption. Having an easily accessible toolbox of available methods ready for testing on calibration data is helpful when choosing what to use and finally validate on untouched data. Through the process of writing this paper it has become evident that there are a lot of interesting and powerful methods out there to choose from. It also seems that the research groups around the world have their favourite methods that they cling to. Great analytical benefits as well as time savings can probably be achieved by keeping up to date on the state of the art methods available. Especially identification and quantification of metabolites seems to be an area where increased exploration of the available methods can yield great advantages in the competitive business that the natural sciences and especially medical sciences has become.
References [1] Daviss, B. Growing pains for metabolomics. The Scientist 19, 25 (2005).
16
[2] Dunn, W. B. & Ellis, D. I. Metabolomics: Current analytical platforms and methodologies. Trends in Analytical Chemistry 24, 285 – 294 (2005). [3] Ebbels, T. M. & Cavill, R. Bioinformatic methods in NMR-based metabolic profiling. Progress in Nuclear Magnetic Resonance Spectroscopy 55, 361 – 374 (2009). [4] Montgomery, D. C. Design and Analysis of Experiments (John Wiley & Sons, Inc, 2005), 6 edn. [5] Nielsen, N.-P. V., Carstensen, J. M. & Smedsgaard, J. Aligning of single and multiple wavelength chromatographic profiles for chemometric data analysis using correlation optimised warping. Journal of Chromatography A 805, 17 – 35 (1998). [6] Tomasi, G., van den Berg, F. & Andersson, C. Correlation optimized warping and dynamic time warping as preprocessing methods for chromatographic data. Journal of Chemometrics 18, 231 – 241 (2004). [7] Savorani, F., Tomasi, G. & Engelsen, S. icoshift: A versatile tool for the rapid alignment of 1D NMR spectra. Journal of Magnetic Resonance 202, 190 – 202 (2010). [8] Lieber, C. & Mahadevan-Jansen, A. Automated method for subtraction of fluorescence from biological raman spectra. Applied Spectroscopy 57, 1363 – 1367 (2003). [9] Eilers, P. Parametric time warping. Analytical Chemistry 76, 404 – 411 (2004). [10] Ruckstuhl, A. F., Jacobson, M. P., Field, R. W. & Dodd, J. A. Baseline subtraction using robust local regression estimation. Journal of Quantitative Spectroscopy and Radiative Transfer 68, 179 – 193 (2001). [11] Liland, K. H., Almøy, T. & Mevik, B.-H. Optimal choice of baseline correction for multivariate calibration of spectra. Applied Spectroscopy 64, 1007 – 1016 (2010). [12] Liland, K. H., Mevik, B.-H., Rukke, E.-O., Almøy, T. & Isaksson, T. Quantitative whole spectrum analysis with MALDI-TOF MS, Part II: Determining the concentration of milk in mixtures. Chemometrics and Intelligent Laboratory Systems 99, 39 – 48 (2009). [13] Daubechies, I. Orthonormal bases of compactly supported wavelets. Communications on pure and applied mathematics 41, 909 – 996 (1988). [14] Johnson, R. A. & Wichern, D. W. Applied Multivariate Statistical Analysis (Pearson Education, 2002). [15] Hastie, T. & Tibshirani, R. Discriminant adaptive nearest neighbor classification. IEEE Transactions on Pattern Analysis and Machine Intelligence 18, 607 – 616 (1996). [16] Cortes, C. & Vapnik, V. Support-vector networks. Machine Learning 20, 273 – 297 (1995). [17] Mahadevan, S., Shah, S. L., Marrie, T. J. & Slupsky, C. M. Analysis of metabolomic data using support vector machines. Analytical Chemistry 80, 7562 – 7570 (2008). [18] Meyer, D., Leisch, F. & Hornik, K. The support vector machine under test. Neurocomputing 55, 169 – 186 (2003). [19] Breiman, L. Random forests. Machine Learning 45, 5 – 32 (2001). [20] Truong, Y., Lin, X. & Beecher, C. Learning a complex metabolomic dataset using random forests and support vector machines. In Proceedings of the tenth ACM SIGKDD international conference on Knowledge discovery and data mining, KDD ’04, 835–840 (ACM, New York, NY, USA, 2004). 17
[21] Comon, P. Independent component analysis, a new concept? Signal Processing 36, 287 – 314 (1994). [22] Martens, H. & Næs, T. Multivariate calibration (John Wiley and Sons, Chichester, UK, 1989). [23] Nocairi, H., Qannari, E. M., Vigneau, E. & Bertrand, D. Discrimination on latent components with respect to patterns. application to multicollinear data. Computational Statistics & Data Analysis 48, 139–147 (2005). [24] Indahl, U. G., Martens, H. & Næs, T. From dummy regression to prior probabilities in PLS-DA. Journal of Chemometrics 21, 529 – 536 (2007). [25] Indahl, U. G., Liland, K. H. & Næs, T. Canonical partial least squares - a unified PLS approach to classification and regression problems. Journal of Chemometrics 23, 495 – 504 (2009). [26] Trygg, J. & Wold, S. Orthogonal projections to latent structures (O-PLS). Journal of Chemometrics 16, 119 – 128 (2002). [27] Bylesjö, M. et al. OPLS discriminant analysis: combining the strengths of PLS-DA and SIMCA classification. Journal of Chemometrics 20, 341 – 351 (2006). [28] Wiklund, S. et al. Visualization of GC/TOF-MS-based metabolomics data for identification of biochemically interesting compounds using OPLS class models. Analytical Chemistry 80, 115 – 122 (2008). [29] Indahl, U. A twist to partial least squares regression. Journal of Chemometrics 19, 32–44 (2005). [30] Liland, K. H. & Indahl, U. G. Powered partial least squares discriminant analysis. Journal of Chemometrics 23, 7 – 18 (2009). [31] Wold, S. Pattern recognition by means of disjoint principal components models. Pattern Recognition 8, 127 – 139 (1976). [32] Frank, I. E. DASCO - a new classification method. Chemometrics and Intelligent Laboratory Systems 4, 215 – 222 (1988). [33] Trygg, J., Holmes, E. & Lundstedt, T. Chemometrics in metabonomics. Journal of Proteome Research 6, 469 – 479 (2007). [34] Skov, T. & Bro, R. Solving fundamental problems in chromatographic analysis. Anal Bioanal Chem 390, 281 – 285 (2008). [35] Harshman, R. Foundations of the PARAFAC procedure: Model and conditions for an ’explanatory’ multi-mode factor analysis. UCLA Working Papers in phonetics 16, 1 (1970). [36] Acar, E., Bro, R. & Schmidt, B. New exploratory clustering tool. Journal of Chemometrics 22, 91 – 100 (2007). [37] Smilde, A. K., van der Werf, M. J., Bijlsma, S., van der Werff-van der Vat, B. J. C. & Jellema, R. H. Fusion of mass spectrometry-based metabolomics data. Analytical Chemistry 77, 6729 – 6736 (2005). [38] Westerhuis, J. A., Kourti, T. & MacGregor, J. F. Analysis of multiblock and hierarchical PCA and PLS models. Journal of Chemometrics 12, 301 – 321 (1998). [39] Crockford, D. J. et al. Statistical heterospectroscopy, an approach to the integrated analysis of NMR and UPLCMS data sets: Application in metabonomic toxicology studies. Analytical Chemistry 78, 363 – 371 (2006). 18
[40] Tauler, R. Multivariate curve resolution applied to second order data. Chemometrics and Intelligent Laboratory Systems 30, 133–146 (1995). [41] Galera, M. M., García, M. G. & Goicoecheab, H. The application to wastewaters of chemometric approaches to handling problems of highly complex matrices. Trends in Analytical Chemistry 26, 1032 – 1042 (2007). [42] Stone, M. Cross-validatory choice and assesment of statistical predictions. Journal of the Royal Statistical Society, Series B—Methodological 36, 111–147 (1974). [43] Davison, A. & Hinkley, D. Bootstrap Methods and their Application (Cambridge University Press, 1997). [44] Langsrud, y. Rotation tests. Statistics and Computing 15, 53 – 60 (2005). [45] Dørum, G., Snipen, L., Solheim, M. & Sæbø, S. Rotation testing in gene set enrichment analysis for small direct comparison experiments. Statistical Applications in Genetics and Molecular Biology 8 (2009).
19