MVT — A system for visual testing of software Jan Lönnberg
[email protected]
Ari Korhonen
[email protected]
Lauri Malmi
[email protected]
Department of Computer Science and Engineering Helsinki University of Technology Finland
ABSTRACT Software development is prone to time-consuming and expensive errors. Finding and correcting errors in a program (debugging) is usually done by executing the program with different inputs and examining its intermediate and/or final results (testing). The tools that are currently available for debugging (debuggers) do not fully make use of several potentially useful visualisation and interaction techniques. This article presents a prototype debugging tool (MVT — Matrix Visual Tester) based on a new interactive graphical software testing methodology called visual testing. A programmer can use a visual testing tool to examine and manipulate a running program and its data structures. The tool combines aspects of visual algorithm simulation, high-level data visualisation and visual debugging, and allows easier testing, debugging and understanding of software.
Categories and Subject Descriptors D.1.5 [Programming Techniques]: Object-oriented Programming; D.2.5 [Software Engineering]: Testing and Debugging—visual debugging; D.2.11 [Software Engineering]: Software Architectures—data abstraction, information hiding
General Terms Design, Human Factors
Keywords Visual testing, visual debugging, algorithm simulation, bytecode instrumentation, execution history logging
1. INTRODUCTION As software has grown more complex, the amount of errors in it, known as bugs, has increased. Market pressures can further compound this problem by causing a project to be developed with unskilled programmers or insufficient time or money. It is estimated that software errors lead to costs of tens of milliards of euros every year [12]. Permissiontotomake makedigital digitalor orhard hardcopies copiesof ofall allor orpart partof ofthis thiswork workfor for Permission personalororclassroom classroomuse useisisgranted grantedwithout withoutfee feeprovided providedthat thatcopies copiesare are personal not made or distributed for profit or commercial advantage and that not made or distributed for profit or commercial advantage and that Permission to make digital or hard copies of all or part of this work for copiesbear bear this notice noticeuse andisthe the full citation citation on the first page. page. To copyare copies and full first copy personal or this classroom granted withouton feethe provided thatTo copies otherwise, to republish, republish,for poston onservers serversororto toredistribute redistribute lists, otherwise, totoprofit post totolists, not made ortodistributed or commercial advantage and that copies requires prior specific permission and/or fee. requires specific and/or aafee. bear thisprior notice and thepermission full citation on the first page. To copy otherwise, to AVI2004, '04, May 25-28, 2004, Gallipoli (LE), Italy AVI Gallipoli Italy republish, to post on(LE), servers or to redistribute to lists, requires prior specific ©2004 2004ACM ACM 1-58113-867-9/04/0500..$5.00 ©permission 1-58113-867-9/04/0500..$5.00 and/or a fee. AVI 2004 Gallipoli, Italy Copyright 2004 ACM X-XXXXX-XX-X/XX/XX ...$5.00.
Bugs are essentially a difference between the intended behaviour of the program and its actual behaviour. Thus, one way to find and fix this kind of errors (an activity known as debugging) is to examine the operation of the program and compare this to the desired operation. This approach is called testing. Tools that assist in debugging by allowing programmers to examine the current state of a program, i.e. the data the program is working with in memory and the currently executing code, and control its execution are called debuggers. Current debuggers have several limitations. As they generally show data by displaying the values of individual variables, it is often hard to see the interesting aspects of the running program and its data. Object-oriented development has allowed programmers to hide unnecessary detail while developing, but debuggers generally do not take advantage of this. Furthermore, it is difficult to test results of operations in the program without writing additional code that runs parts of the program and examines the results. Also, when a problem is found, its cause is often lost in the past, which necessitates careful rerunning and stepping through the program to find the cause of the problem. Many of the problems with debuggers mentioned above can be alleviated by applying ideas from software visualisation to create a graphical representation of the running program. Moreover, the user can manipulate the running program through the graphical representation. Software visualisation can be divided into three categories based on the purpose of the visualisation and the approaches used: visual debugging, program visualisation and algorithm animation and simulation. The program visualisation and debugging approaches are based on the idea of taking a running program (often referred to as the debuggee), stepping through it and showing the variables and other interesting parts of the state of the executing program. This shows what the program is doing. Program visualisation is used to understand a program, while debugging involves finding and correcting errors in a program. Program visualisation and debugging can be done using similar techniques and in some cases both may be combined in a single tool (e.g. Lens [10] and Leonardo [4]). The purpose of program visualisation is primarily educational. The goal is usually to help the user understand or explain to others how a program works. Most of these systems are targeted at teaching basic programming (e.g. Jeliot [5]), while others are also intended to help programmers understand what a program is doing (e.g. UWPI [6]). Program visualisation systems use a variety of approaches to extracting information from a running program. Some require that the user adds visualisation commands to their program (e.g. Leonardo [4]), while others automatically add visualisation code to the user’s program using a modified compiler or an additional precompiler (e.g. Jeliot [5] and UWPI [6]).
385
During the last two decades, visualisation features have been developed for debugging tools. Debuggers that use software visualisation techniques are generally called visual debuggers. Two approaches to visualisation in debuggers can be discerned. The simpler approach is to allow the user to select concrete data structures to be displayed and display the data in them without any attempt to interpret the meaning of the data (as in e.g. DDD [13] or Amethyst [11]). The other approach allows the user to create visualisations for his program by constructing animations using predefined primitives and the variables in the program. This allows the user to view his data at a higher level of abstraction, but also requires more work to get the desired view. This approach is also sometimes used in program visualisation, which makes it hard to classify some of the programs that use it (e.g. Lens [10]). The algorithm animation approach is based on showing a series of graphical representations of a data structure at successive points in time in order to explain how an algorithm operates on the data structure. Many algorithm animation systems allow the user to step back and forth through the states of the data structure and algorithm to study the progress of the algorithm [1]. Visual algorithm simulation, however, gives the user the ability to manipulate the data structures himself [7]. Most algorithm animation and simulation tools are designed for the teaching of algorithms and data structures. Their purpose is twofold: to make it easier for teachers to show their students what an algorithm does (e.g. Zeus emphasises this application [2]) and to allow the student to experiment with data structures and algorithms (e.g. Matrix emphasises this area [8]). The interaction techniques of visual algorithm simulation can, however, be applied to broaden the ways visual debuggers are used, especially for testing software. We refer to this as visual testing. In Section 2, we define more thoroughly the new concept of visual testing. Section 3 describes our prototype visual testing tool called MVT (Matrix Visual Tester). Finally, Section 4 discusses our findings and outlines some future directions.
2. VISUAL TESTING Visual testing [9] is a generalisation of visual debugging (see e.g. [10, 13]) and has similar goals. Visual debugging is a concept that combines a debugger and a visualisation system that can automatically create diagrams from the memory content. Visual testing, however, allows a novel way to interact with the memory content. The user can determine new test cases and execute code by directly manipulating the visualisation. We formulate the following requirements for visual testing tools: Generality The testing tool must work on real-life programs without (manual) modification of the debuggee, like a debugger. Completeness All aspects of running program must be accessible for examination, as in a debugger. Data modification Variable values and data structures are freely modifiable (where allowed by the programming language) in terms of direct manipulation of the data structure visualisation. Execution control The user can try out any part of the program on data chosen from the visualisation. This is an important issue in algorithm simulation, as in e.g., Matrix [7, 8]. Presentation Information about the debuggee’s state is shown in a way that is as easy to understand as possible. This includes: Representation The data must be shown in a suitable form. Abstraction Unnecessary implementation details are hidden whenever it is possible and the user desires it. Automatic view control The tool should guess at what the user wishes to see and present the data in this form. Manual view control The user can change the view easily to
match his own ideas by hiding (eliding) parts of the view and changing the way in which information is represented. Causal understanding It should be easy to understand the reason for the current state of the program. In other words, the tool must allow the user to examine the execution history of the program in order to understand how it got to the state it is in. Many program visualisers and algorithm animation tools support this. In order to satisfy the above requirements, visual testing includes the following abilities in addition to those provided by visual debuggers. First, one can manipulate data structures in a running program through a graphical user interface, as in visual algorithm simulation. Second, it is possible to invoke methods graphically to test program code or extract information. Third, one can step through the previous states of a program as in algorithm animation. Finally, there is an option to examine the execution history of a program using various graphical views. The first two additions allow test cases to be changed without recompiling and restarting, which should help when trying to trace a problem. The other two make it easier to work backwards from a symptom of a bug to the bug itself.
3.
MVT
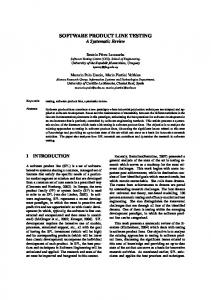
MVT (Matrix Visual Tester) is a prototype visual testing tool. In order to produce a prototype quickly, MVT has been written to use the Matrix framework [7, 8] for most of its visualisation and user interaction features. In this section, we will describe the techniques and approaches used in MVT. An example view from MVT is shown in Figure 1.
3.1
Visualisation
The most important view in MVT is the data view, which shows the variables, i.e. memory addresses that contain a value that can be read and written by a Java program, in the debuggee grouped together in data containers. The variables are local variables, array elements and fields. Local variables belong to frames, each of which corresponds to an invocation of a method, on the execution stack of a thread. Array elements form arrays and fields belong to classes or objects, which are instances of classes. The data view in MVT is based on showing the data containers as tables and the variables they contain as elements in the tables. Primitive values are simply shown as text. Object references are represented by nesting the referenced object inside the referring object or using an arrow from the referring variable to the object that is referred to. In addition to the data view, the structure panel contains the package tree, which shows the packages and classes available to the debuggee, and user-requested method invocations that have not yet been started. The current execution position is shown in two ways. Each stack frame is labelled with the currently executing method and line number in the source code. Also, the current line in the topmost frame in the running thread is shown highlighted in the source code view below the data view. MVT logs the execution of the debuggee. The user can step backwards and forwards through the execution history using the animator controls above the data view. The data and code views in the main MVT window show the state of the program at the specified time. The user can also easily rewind the view to the last modification to a variable. Stepping back and forward through the log does not affect the actual state of the debuggee.
3.2
Elision and abstraction
Most Java programs process a lot of data. Being able to find the important parts of the data and present it as clearly as possi-
386
Figure 1: The MVT window contains (from top to bottom): menus, animator control buttons and bar, stepping control buttons, the structure panel and the source view with the current line highlighted. The structure panel contains the data view, the package tree and a user-specified invocation of setWages that has not yet been started. The data view shows a simple database of employees (implemented as an ArrayList of Employees). The user has invoked a method (raiseUnionWages) that raises the wages of every union member in the database by 10% by iterating through the list of employees, calling raiseWages on every Employee that is a union member, which calls setWages to change the wages. A breakpoint has been used to interrupt setWages at the point where Peter Jones gets his raise. The execution stack frames corresponding to the methods that are running at this point of execution are shown inside the representation of the thread to which they belong (the innermost call is at the top). Each frame is labelled with the method name, a unique identifier (the number of the call in chronological order) for the call and the current line number. Each frame shown contains some local variables. The data view also shows the Employee class, which keeps track of the last (unique, increasing) id assigned to an employee. The package tree shows the classes in the root package and the other packages available to the debuggee VM (the standard Java library and MVT). All packages except the root package are minimised to a single node for clarity. The invocation structure at the bottom of the structure panel is a temporary structure used to specify the arguments for a method call. When the user chooses a method to execute (from the pop-up menu of an object or class), an invocation structure is shown. When the user has specified the arguments (by dragging values into the invocation structure), he can tell MVT to perform the method call specified by the invocation structure. In this case, the user has already specified the parameter for the setWages call, so he can start the method call whenever he likes.
387
ble is therefore necessary. Elision (hiding unwanted information) and abstraction (hiding nonessential aspects of information such as implementation details) make it easier for the user to find and understand the information he is interested in. MVT ignores a lot of information that is usually uninteresting or hard to keep track of efficiently. This includes the values of variables defined in standard library classes. MVT allows the user to select the information to be shown in a variety of ways. The user can choose whether the threads of the program and their stack frames are visible. The user can also show and hide classes and their instances individually, all at once, or all instances of all the classes in a package at once. The user can also choose which fields of an object are shown. Similarly, he can choose which elements of an array or collection are shown. A referenced object is always shown if a variable containing a reference to it is visible.
3.3 Controlling the debuggee When MVT has started the debuggee JVM, no code is running in the JVM (aside from the system and debugging threads). Typically, the user will load a class and then choose a method to execute from this class. This produces a method invocation object (shown as a table) into which arguments for the method call should be inserted. The method invocation can then be executed. By stepping, using breakpoints or interrupting the debuggee, the user can suspend the execution of the method and examine the state of the debuggee. Several method invocations can be active at once in separate threads. The user can change the values of variables by dragging data values into variables. New primitive variable values can be entered as text. New objects can be created by invoking a suitable constructor. New values, possibly returned by method invocations, are collected in a special container. By providing the ability to invoke methods and modify data values, MVT allows the user to try out methods with different arguments without writing additional test code and recompiling.
derstanding of the program execution by actively using data elision and abstraction to suppress unnecessary details. We have implemented MVT as a prototype visual testing tool. It allows a programmer to try out Java program code and examine its execution and the data it produces. MVT has successfully shown that the concept of visual testing works; essentially, it is possible to manipulate program execution and data structures in terms of direct manipulation without changing the target code. However, MVT does not implement all of the ideas of visual testing presented in Section 2. In the future, we shall add execution history views that summarise the method calls and other operations performed by the program. The suggested execution history views (described in more detail in [9]) include: i) call trees containing the operations performed by a thread structured as a tree of method calls (such trees are used, for example, in the History view of RetroVue [3]), ii) adding execution history information to the data view by adding arrows or annotations to indicate variable accesses and method calls, and iii) dynamic dependence graphs that show executed operations and the data and control dependencies between them. In addition, the performance in logging and visualisation should be improved. This may force us to use a specially modified JVM instead of accessing a standard JVM using JPDA, although compatibility and legal issues complicate this. We may also base our future visual testing tool on a different graphics or visualisation framework than Matrix in order to produce more suitable visualisations.
5.
REFERENCES
[1] C. M. Boroni, T. J. Eneboe, F. W. Goosey, J. A. Ross, and R. J. Ross. Dancing with Dynalab. In 27th SIGCSE Technical Symposium on Computer Science Education, pages 135–139. ACM, 1996. [2] M. H. Brown. Zeus: a system for algorithm animation and multi-view editing. In Proceedings of IEEE Workshop on Visual Languages, pages 4–9, Kobe, Japan, Oct. 1991. [3] J. Callaway. Visualization of threads in a running Java program. Master’s thesis, University of California, June 2002. [4] P. Crescenzi, C. Demetrescu, I. Finocchi, and R. Petreschi. Reversible execution and visualization of programs with LEONARDO. Journal of Visual Languages and Computing, 11(2):125–150, Apr. 2000. [5] J. Haajanen, M. Pesonius, E. Sutinen, J. Tarhio, T. Teräsvirta, and P. Vanninen. Animation of user algorithms on the Web. In Proceedings of Symposium on Visual Languages, pages 360–367, Isle of Capri, Italy, 1997. IEEE. [6] R. R. Henry, K. M. Whaley, and B. Forstall. The University of Washington illustrating compiler. In Proceedings of the ACM SIGPLAN’90 Conference on Programming Language Design and Implementation, pages 223–233, 1990. [7] A. Korhonen. Visual Algorithm Simulation. Doctoral thesis, Helsinki University of Technology, 2003. [8] A. Korhonen and L. Malmi. Matrix — Concept animation and algorithm simulation system. In Proceedings of the Working Conference on Advanced Visual Interfaces, pages 109–114, Trento, Italy, May 2002. ACM. [9] J. Lönnberg. Visual testing of software. Master’s thesis, Helsinki University of Technology, Oct. 2003. [10] S. Mukherjea and J. T. Stasko. Toward visual debugging: Integrating algorithm animation capabilities within a source level debugger. Transactions on Computer-Human Interaction, 1(3):215–244, 1994. [11] B. A. Myers, R. Chandhok, and A. Sareen. Automatic data visualization for novice Pascal programmers. In IEEE Workshop on Visual Languages, pages 192–198. IEEE, Oct. 1988. [12] RTI. The economic impacts of inadequate infrastructure for software testing. Planning report 02-3, NIST, May 2002. [13] A. Zeller. Animating data structures in DDD. In The proceedings of the First Program Visualization Workshop – PVW 2000, pages 69–78, Porvoo, Finland, 2001. University of Joensuu.
3.4 Implementation MVT uses JDI (Java Debugger Interface), to connect to the debuggee and monitor the data in the debuggee. JDI, however, does not provide any notifications for changes to arrays and local variables. Also, there is no easy way to identify stack frames in JDI, which makes it hard to keep track of the local variables in the stack frames. Monitoring of data changes and identification of stack frames is done by inserting additional method calls in the bytecode. These method calls can be observed using JDI and data values passed to MVT as arguments to the method calls. Unfortunately, relying on bytecode instrumentation means that MVT can not properly detect data changes made by uninstrumented code such as standard libraries and native methods. However, for all instrumented code, the system keeps track of the changes and uses this information to build data structures that are visualised using extended versions of the array and graph visualisations of Matrix.
4. CONCLUSION Visual testing is an approach which extends the functionality available in visual debugging tools. Instead of only allowing the user to observe the memory contents visually, visual testing also allows visual control of program execution and visual manipulation of program data structures. These features provide, for example, easy generation of new test cases without touching the target code. Moreover, visual testing also supports better conceptual un-
388