Jan 4, 1989 - et al., 198 1; DUBESSY, 1985) and they can be represented best as binary .... isotherms, BURRUSS, 198 1: HERSKOWITZ and KIscH. 1984).
0016.7037/90/s3.00
Gmhimrca .s Cosmochimico Acto Vol. 54, pp. 621-629 Copyright0 1990Pergamon Press plc.Printedin U.S.A
+
.ca
Isochoric phase diagrams in the systems C02-CI& and CO*-N2 : Application to fluid inclusions* A.M. VANDENKERKHOF Instituut voor Aardwetenschappen, Vrije Universiteit, De Boelelaan 1085, 1081 HV Amsterdam, The Netherlands (Received May 10,
1989; accepted in revised form December 2 1, 1989)
phase behaviour between - 180 and +35”C at constant volume in C02-CH4-N2 inclusions includes some newly described phase transitions. All transitions can be [classified] as initial or final melting, homogenization, partial homogenization, sublimation or metastable homogenization. Phase sequences are classified in 9 groups, distinguished by the order and number of phase transitions. The variety of phase behaviour is explained by differences in fluid composition and molar volume. Phase assemblages are illustrated by isochoric (constant volume) phase diagrams of the binary systems CO*CH4 and CO*-Nz , covering the full range of compositions and molar volumes of interest for natural fluid inclusions. The topologies of VTX diagrams for the two binary systems are different and explain the unique phase behaviour of both systems, which can often be distinguished by their phase behaviour only. Both isochoric TX and isothermal VX sections are discussed. The diagrams allow the determination of molar volumes from microthermometric data and Raman analysis. Phase diagrams for the ternary system CO*-CH4-N2 could only semi-quantitatively be established.
Abstract-The
Despite modem techniques like Raman micro-spectrometry, microthermometry is still the most important method in fluid inclusion research. The molar volume is an essential quantity to be determined and it can be calculated from the homogenization temperature and the composition by using the proper phase diagrams. The pure systems for the gases C02, CH4, and N2 are relatively well known and they are sufficient for many fluids (SWANENBERG,1980; HOLLISTER and CRAWFORD, 1981; ROEDDER, 1984). However, fluid mixtures are more difficult to interpret and knowledge ofthe binary (and ternary) systems is indispensable for a proper interpretation of fluid inclusions. It has been found that not only homogenization temperatures, but also other phase transitions observed in complex fluids are indicative of their molar volume and composition. Several types of phase behaviour in fluid inclusions have been described as a part of regional geological studies (e.g., GUILHAUMOUet al., 198 1; KREULENand SCHUILING,1982; DARIMONT, 1986; VAN DEN KERKHOF, 1988b), but the considered fluids had only limited compositions. The present paper gives a compilation of the compositional and volumetric ranges of interest in natural fluid inclusions, i.e., the complete range of binary mixtures and molar volumes from about 30 to 300 cm3. Parts of the system C02-CH4 were studied by HEYEN et al. ( 1982) HERSKOWITZand KISCH ( 1984) and RAMBOZet al. (1984); the system CO*-NZ by DARIMONT (1986) and DARIMONT and HEYEN (1988). Most studies rely on only the experimental data of ARAI et al. ( 197 1). Some data for experimentally produced C02-N2 inclusions are given by VAN DEN KERKHOF (1988a). The present binary isochoric diagrams are constructed by a compilation of literature data, equations of state, experimental data, and observations in natural and [synthetic] fluid inclusions. The phase transitions described in this paper are not only theoretical, but they are also all observed in fluid inclusions.
INTRODUCTION
representative offluidsin metamorphic and magmatic rocks, are reasonably well known (HOLLOWAY, 1977; ROEDDER, 1984; BOWERSand HELGESON, 1984, 1985). These mostly concern Hz0 (fNaCl), CO2 and their mixtures. The study of fluid inclusions of these compositions has contributed to the interpretation of rock evolution in many areas. In general, CO* is the dominant gas species, particularly in some high-grade metamorphic terrains (e.g., TOURET, 1977). However, gas chromatography and Raman laser microprobe analysis have showed that many gases are not pure CO;! (SWANENBERG,1980; GUILHAUMOU et al., 198 1; DUBESSY, 1985) and they can be represented best as binary or ternary mixtures in the system CO,-CH4N2 (VAN DEN KERKHOF, 1988a,b). Several phase transitions were observed in these fluids which initially were not fully understood or in some cases were even ignored by some workers. Small amounts of CH4 and/or Nz (< about 5 mol%) do not significantly affect the interpretation of trapping PT conditions of CO* inclusions. However, the presence of higher amounts of CH4 and/or N2 in COz-rich inclusions carries the risk of confusing high density CO* with low density CO*CH4-N2 mixtures (TOURET and VANDEN KERKHOF, 1986). Lower densities have so far been demonstrated for the Furua Granulite Complex, Tanzania (VAN DEN K!ZRKHOF,1988b), and for Rogaland, SW Norway (VANDEN KERKHOF, in prep.). It has been found that binary mixtures between two endmembers are good approximations for many natural fluids and that one of the three components is generally absent or subordinate (VAN DEN KERKHOF, 1988a), a fact which greatly simplifies the calculation of fluid densities. SOMEMODELCHEMICALSYSTEMS,
* Presented at PACROFI II, Second Biennial Pan-American Conference on Research on Fluid Inclusions, held in Blacksburg, VA, January 4-7, 1989. 621
622 THE
A. M. van den Kerkhof PHASE
BEHAVIOUR
OF CO2CHd-NZ INCLUSIONS
liquid and vapour cannot be optically observed if both phases are not present. Even when sublimation is preceded by partial homogenization to liquid or vapour, the character of the fluid phase at the temperature of solid disappearance is not known, A distinction is therefore made here between melting, defined as S + L + V + L + V, and sublimation to the liquid. defined as S + L + L. The order of phase transitions on warming is always fixed for H- and S-type inclusions: H-type inclusions show 1 to 5 phase transitions of the sequence S + L + S + L + V --* S +LorS+V+S+L+V-+L+V-+LorV(Hl,H2, H3, H4, H5), always including the last transition; S-type inclusions show 1 to 4 phase transitions of the sequence S + I_ +V+S+L+S+L+V+S+LorS+V+LorV (Sl, S2, S3, S4), always including the last transition (Table 2). Note that H- and S-type inclusions show different behaviour of solid disappearance: melting of solid CO* occurs in H-type inclusions followed by homogenization at higher temperatures; sublimation to liquid or vapour occurs in S-type inclusions. Type Hl, H2, H3, and H4 inclusions are all common in geologic samples. Type Hl inclusions are characteristic for (almost) pure CH4-N2 inclusions, without CO,; type H3 inclusions have high CO* contents and show a phase behaviour which is similar to that of pure COz. Type H2 inclusions, showing melting and homogenization, cannot be frozen completely with [conventional] freezing-stages. They contain high concentrations of CH4. Type H4 inclusions show partial homogenization and they contain higher N2 or CH4 contents. Type H5 inclusions are extremely rare and comprise only CO*-CH4 inclusions with Th = Tm.
Phase transitions in CO*-CH4-N2 inclusions are normally studied between about - 180 and +35”C, a temperature range which can be reached by cooling with liquid nitrogen of - 196°C. Methane can be frozen below -182.5’C. but its solid state is not considered here. Temperatures of phase transitions are generally measured on warming after cooling as the transitions on cooling are metastable due to bubble or solid nucleation energies; transitions on warming are all stable except in the case of metastable homogenization (see later). The phase transitions between liquid (L) and vapour (V) phases and solid CO* (S), observed on warming CO*-CH.,Nz inclusions, are summarized in Table 1. Abbreviations, proposed for these transitions are also presented. The unique character of phase transitions (especially for non-aqueous compositions) at constant volume, makes it difficult to describe the transitions unambiguously by means of the presently available terms. The development of suitable terms (and their abbreviations) for description of the phase changes in inclusions at constant volume is still [evolving] (E. ROEDDER, pers. comm.). A unified classification system of phase sequences, proposed by VAN DEN KERKHOF (1988a) covers in principle any composition and density in the system C02-CH4-N2. A division in 2 groups is made, namely (1) H-type inclusions, showing homogenization as the final phase transition on warming and (2) S-type inclusions, showing sublimation as the final phase transition. The present use of the term “homogenization” is restricted to the homogenization of liquid and vapour only, without the presence of solid CO2. “Sublimation” is defined here as the transition from S + V + V, but also S + L + L, i.e., the “evaporation” or “dissolution” of solid CO;? without the formation of 3 phases. The latter transition is essentially melting. but can generally not be distinguished from sublimation under the microscope, because the difference between
Table
1.
ISOBARIC
(final) partial
melting
Phase transitions inclusions at
melting homogenization
homogenization sublimation eutectic
’) 2,
/ metastable homogenization (“evaporation”) (“dissolution”)
melting
ISOCHORIC
PHASE
DIAGRAMS
Several types of diagrams are possible for the illustration of phase relations. Most traditional diagrams include pressure (P), temperature (T), and composition (X). TX diagrams are often used for the presentation of phases in binary systems,
on warming CO*-CH4-Nz constant volunre. phase
incipient
AND
transition
- StLtv s+v - StLtv s+L s+L+v -+ L+v s+L+v -+ s+v s+L+v + s+L Ltv -t v L+v - L s+v - v s+L + L SltS2+V + SltL+V
denotation Ti L Ti V Tm
Ths L Ths V Th V / Thm V Th L / Thm L Ts V Ts L Te
?I in earlier works of the author Ti v was denoted as Ti L, Ti L as T; V. The modification was suggested by E. Roedder. 2,
= homogenization
of
liquid
and vapour
in the presence
of solid
CO,.
623
CO*-CH4and CO*-N2phasediagrams
Table 2. A classification based on phase sequences (H-type StL
StLtv
-t
+
StL
of CO,-CH,-Nz inclusions between -180 and +35OC. inclusions) StLtv
or +
+
Ltv
+
L or V
-
Th Th Th Th -ThL
L/V L/V L/V L(V)
-
StL
+
L
Ts Ts Ts Ts
-
stv Hl H2 H3 H4 H5
Tm -TiV Ti
-
-
Ths Ths
-
Ti L/V
-TiL
(-1
Tm
T7n Tm.
(S-type inclusions) StLtv
--t
StL
--t
StLtv
-+
or
or V
stv Sl s2 s3 S4
-
Ths L
Ti L
-
Ti
L
-
Ths L/V Ths L Ths L -
Metastable Sl
to
LtV -
s4
+ Thm
L or V L/V -
but these diagrams are traditionally isobaric. An example of
of gases, and especially of CH4, is a function of the pressure
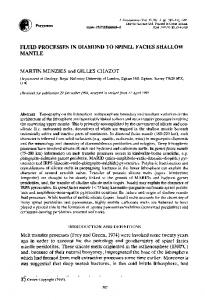
an isobaric TX-diagram for the system COr-CH4 is shown in Fig. la (after BURRUSS, 198 1). However, fluid inclusions represent isochoric systems (constant volume): the molar volume (v) and the total composition remain constant whereas temperature and pressure are variables. The pressure is not further considered as this quantity cannot be measured directly in fluid inclusions. It is known that the Raman peak position
(FABRE and COUTY, 1986), but the accuracy
of the mea-
surements do not normally allow quantitative pressure determination. The type of diagram presented here considers (1) the molar volume, (2) the temperature, and (3) the composition (F?X diagrams). Two planar sections are most useful, namely TX diagrams (showing isochores) and I% diagrams (showing
-67 -74
-105
_JJ -162
co2
023
CHt,
Co2 o.l
05
0.65
CH4
FIG. 1. TX Phase diagrams for the system CO&H., . (a) Isobaric section for a pressure of about 30 bars (revised after BURRUSS, 198 1). (b) Isochoric section for a molar volume of about 50 cm3. Temperatures are not to scale.
634
A. M. van den Kerkhof
isotherms, BURRUSS, 198 1: HERSKOWITZ and KIscH. 1984). Both types can be used for plotting fluid inclusion data. The use of the TX diagram is stressed here because it is most suitable for the illustration of phase sequences in one diagram. C’Xdiagrams show best the phase behaviour in relation with molar volume and composition. An example of an isochoric TX diagram for the system CO,-CH, is shown in Fig. I b. Note that the topology of isobaric and isochoric diagrams is basically different. The composition of the individual phases can be read only from isobaric diagrams, but these cannot be used for the illustration of phase transitions at constant volume. Isochoric TX and isothermal r/X diagrams are discussed below for the systems CO*-CH4 and CO>-Nz.
( 1986) and DARIMONT and HEVEN ( 1988). As diagrams constructed from these data are inaccurate for high Nz-contents. some other experiments were carried out by v,~h IXN KERKHOF (1988a). An example of an isochoric 7:Y diagram is shown in Fig. 2b for the same molar volume as was shown for the system CO,-CH, (Fig. 2a). The topologies of the two systems may explain some essential differences in phase behaviour observed in fluid inclusions of both compositions. It was found that the melting behaviour for type H4 CO?CH4 inclusions is different from “normal” melting of CO? and CO*-N2 inclusions: melting is normally initiated by the formation of a liquid (Ti L). saturating the cavity until the total disappearance of solid CO2 (S + V -+ S t L. t V --, 1. + V). However. in C02-CH4 inclusions, melting is sometimes initiated by the formation of a bubble (Ti V). growing in size until the final melting point (S t L - S + L t V --+ L -t- V). Occasionally, even initial melting to a critical fluid (Ti C) has been observed (S + V - S + Vcrit + S + I~ t- V + L + V). Sublimation-type inclusions are mainly restricted to type S2; the other types (S 1, S3, and S4) are limited to inclusions of extremely low (or high) molar volumes and has been found for C02-Nz inclusions from the Furua Granulite Complex (VAN DEN KERKHOF, 1988b). Metastable homogenization can be mostly measured for S-type inclusions and it is defined as the homogenization of the metastable liquid and vapour (below the temperature of sublimation) to the liquid or vapour: warming is started before the “stabilization” by the formation of solid CO?. Both Ths and Thm can be often measured for the same inclusion, i.e.. the homogenization of liquid and vapour with or without solid COZ Differences between theoretical and observed phase behaviour of inclusions of given compositions may occur due
LSOCHORIC TX DIAGRAMS OF THE SYSTEMS CO&H., AND CO*-N2
The presently available VTX relations of the s~‘sstem CO,CH4 mainly rely on the original data of ARAI et al. ( 197 1) and the use of equations of state, notably those of HEYEN et al. (1982) and HERSKOWITZ and KISCH (1984). A model of the isochoric TX diagram for the system CO*-CH4 is shown in Fig. 2a, including some examples of phase assemblages. The forms shown in this diagram are (I) the melting and sublimation curves (Tm-Ts-Tm). (2) the homogenization curve (Th), and (3) the partial homogenization and initial melting curves (Ths-Ti). The homogenization curve intersects the melting curve twice: homogenization (“Th > Tm”) is observed for COT-rich and CH,-rich inclusions, sublimation (“Th < Tm”) for the intermediate compositions. The extrapolated homogenization curve below sublimation represents metastable homogenization (Thm). Data on fhe system C02-Nj mainly rely on the experiments of ARAI et al. (197 I) and the calculations by DARIMONT
_
i
a
b \
iI13
L or
V
\ S+V or
S+L
H4
!Hl FIG.2. The isochoric TX diagram for the systems (a) CO*-CHI and (b) C02-N2. The molar volume for both diagrams is about 50 cm’. Phase assemblages are schematically indicated (black = solid CO*; stippled = liquid, white = vapour phase). Denotations of phase behaviour (HI to H5 and S2) are shown for the corresponding compositions (see text).
625
CO*-CH., and CO*-N2 phase diagrams
to theopticalrestrictions ofobserving smallamountsofliquid
PHASEBEHAVIOUB, COMPOSITION AND
or solid. As a rough estimation, less than about 10 ~01% of liquid and less than about 1 ~01% of solid CO* cannot be optically observed. As an implication, C02-N2 inclusions of less than about 20 mol% N2 should essentially be typified as H4, but they are observed mostly as type H3 as the amount of liquid at Ths is extremely small. Type H2 inclusions may also be mistaken for H3 if the inclusions of CO*-CH4 composition look completely frozen at - 180°C although a very small amount of liquid is present; initial melting (Ti) does not take place, but apparent Ti is detected when the amount of liquid becomes large enough to be observed. Furthermore, type H 1 inclusions are essentially restricted to (almost) COZfree compositions. However, inclusions of type S2 and H2 may be observed as Hl if the amount of solid COZ is very small. Apparent H3 behaviour is denoted in this paper as “H3”, apparent HI as “H 1”. In practice, classification of phase behaviour can be based only on observed transitions. A TX projection for a range of volumetric values (Fig. 3a,b) can be used for the determination of molar volumes from data obtained by microthermometry and Raman analysis. Homogenization curves for the system C02-CH4 do not intersect the liquidus for molar volumes between about 65 and 225 cm3, meaning that the phase assemblages S + L and S + V, and therefore sublimation, are not possible at any composition in this range of molar volumes.
MOLAR VOLUME: THE TX DIAGRAM The types of phase behaviour (Hl to H5 and Sl to S4) have each limited compositions and molar volumes. This is illustrated by the Xv-projection of Fig. 4a,b for the systems C02-CH., and CO*-N2. The application of I?X diagrams is discussed in detail by BURRUSS (198 1) and VAN DEN KERKHOF (1988a). Fluid inclusions, being constant in composition and molar volume, plot as points in the diagrams. Isotherms are constructed for homogenization, melting, and sublimation temperatures. Isothermal tie-lines for partial homogenization could be presented only for the system CO*-N2, because approximately all COZ is partitioned in the solid phase below the freezing point. This assumption cannot be made for the system C02-CH4 as the solubility of CO2 in CR is higher. The 3-phase equilibria are given by 2 polythermal curves, for the liquid and for the vapour phases, denoted by L (+S+V) and V (+S+L), respectively. Inclusions plotting in the areas above and below these curves are characterized by sublimation, inclusions plotting in between these curves show final (liquid-vapour) homogenization. Type H2, H3, and S2 behaviour cover the largest ranges of the I?X conditions for the system C02-CH4 ; types H 1, H4, H5, S 1 are rarely found because of their limited I?X, types S3 and S4 have not been observed in CO&I& inclusions. Types H3, H4, and S2 cover
b
s+v(or
I
a
-100
S+L)
i
I ILO)
-14 0
05
X
0 '0
170)
(801
:&g~~;~~_ about 290 cm3/mole may appear empty. The wavy curves C, and C1 in both diagrams are the critical curves of the first and second order, respectively. Fluids with Xvproperties plotting in the region between these curves are characterized by retrograde condensation (see text). Tie-line C1 marks critical partial homogenization (Ths C = -147°C) for C02-N2 mixtures. The isotherms indicate homogenization and sublimation (drawn lines), melting (dotted tie-lines) and partial homogenization for the system C02-N2 (dashed-dotted tie-lines).
the largest ranges of the VX conditions in the system CO*NZ which is in agreement with their frequent observation in natural fluid inclusions. Types S 1, S3, and S4 are restricted to extremely low molar volumes only and types H2 and H5 do not occur in the system CO*-N2. CRITICAL CONDITIONS AND RETROGRADE CONDENSATION
The two binary systems CO,-CH, and C02-Nz are similar in many respects (GUILHAUMOUet al., 198 1; TOURET, 1982): both systems are characterized by immiscibility of the solid phases and full miscibility of the liquid and vapour phases. The most important differences between the two systems are due to the relative positions of the liquidus and the critical curve: these curves do not intersect for the system C02-CH4, but they do intersect for the system CO*-N2 (CAMPBELLand SMITH, 195 1; SMITH, 1963). The critical curve of the first order (CJ does not intersect the liquidus in the system CO*CH4 (Fig. 4a) and therefore solid CO* never coexists with a critical fluid at the (final) melting point. However, critical partial homogenization and critical initial melting (S + L + V + S + Vcrit + S + L + V) are found for the conditions where Ti = Ths (Fig. 2a). In the system C02-Nz , solid CO2 is in equilibrium with a critical fluid (ScoZ + V,& at the intersection points of critical curve and liquidus (Fig. 4b).
One of the intersection points exists only theoretically as it almost coincides with the critical point of pure Nz. According to the Heyen equation (DARIMONTand HEYEN, I988), the second intersection point is located at XN2 x 0.75, T x -7O”C, and P = 250 bar. However, these values are the result of extrapolations far outside the range of the original experimental data (ARAIet al., 197 I). Experimental data (VAN DEN KERKHOF, 1988a) for [synthetic] fluid inclusions, with known P and T of formation, show that the point Sco2 + Vcri, is situated at much lower Nz-contents: X,, = 0.57, T x -62”C, and P = 200 bar(Fig. 3b). This newly determined position implies that sublimation is more widespread than expected from the Heyen equation. The critical point defines the highest pressure and temperature of possible liquid and vapour coexistence in pure systems, and therefore the highest possible Th. However, higher Th than critical is possible for CO*-CH4 and especially for C02-Nz mixtures. The highest possible homogenization temperatures for fluids of given composition are given by the critical curve of the second order (C,, Fig. 3a,b and 4a,b). Fluids with VX-conditions plotting in the region between C, and C2 are characterized by retrograde condensation. This term is properly defined as condensation at releasing pressure (by volume expansion), but at constant temperature. In fluid inclusions however, the volume is constant and the pressure can only be lowered by lowering the temperature. Retrograde
627
CO&& and CO*-Nzphasediagrams and “normal”
condensation by cooling can therefore not be distinguished by observations in fluid inclusions. The implication of retrograde condensation for the isochoric system is a higher L/V ratio and therefore a rise of homogenization temperatures to the vapour phase with higher molar volumes and lower densities. Homogenization to the vapour phase therefore does not necessarily indicate low fluid densities, but also C02-N2-CH4 fluids of relatively high density. In general, retrograde condensation is most easily obtained for two components of a large difference in volatility and therefore a large difference in composition of the coexisting phases. The effect is more distinct for the system COZ-N2 than for the system C02-CH4, especially at low molar volumes. The molar volumes of inclusions which may show retrograde condensation range from about 80 to 165 cm3 for CO*-CH4 compositions and from about 40 to 140 cm3 for CO*-N2. Note that retrograde condensation is also characteristic for the system HzO-C02, but hardly noticed because of the difficult observation of vapour homogenization. A MODEL FOR THE ISOCHORIC TERNARY SYSTEM CO&II,-N2 Experimental volumetric data on liquid-vapour equilibria in the system C02-CH4-N2 are not available. Only semiquantitative models for the ternary system could therefore be established by the extrapolation of the binary subsystems and by the use of microthermometric and Raman data obtained for natural and experimental fluid inclusions (VAN DEN KERKHOF, 1988a). A 3-dimensional illustration of an isochoric diagram (v = 100 cm3/mole) with the composition plotted in the triangular ground plane and the temperature in the third direction is shown in Fig. 5. The homogenization surface partly runs above the melting surface (for CH,-rich compositions), partly under the melting surface (for N&h compositions). The compositional distribution of fluid inclusions showing homogenization (“Th > Tm”) and sublimation (“Th < Tm”) are separated for a given value of the molar volume. Projections on the compositional plane, showing isotherms, are made for practical reasons (Fig. 6). It can be seen that HZtype inclusions are unique for CH4rich fluids, losing importance at lower molar volumes (higher densities) whereas HCtype inclusions are dominant for N2rich compositions. S-type inclusions, mainly restricted to type S2, become more important for fluid inclusions of lower molar volume (higher density) and higher N+ontents. The compositions of fluid inclusions showing identical phase behaviour to that of the pure end-members, type H3 (similar to pure CO*) and type H 1 (similar to pure CH4 and N2), partly override the H2, H4, and S2 fields. The extension of the H3 and H 1 fields is determined by the optical restrictions of the observation of small amounts of liquid or solid. DISCUSSION Differences between the systems CO*-CH4 and C02-N2 are mainly due to the more limited solubility of the end-members for the system CO*-Nz . The topology of the system COZ-NZ is therefore more similar to that of the system CO*-H20,
N2
CHI, FIG. 5. Schematic TX diagram for the ternary system CO*-CHr N2 at constant molar volume (Pa 100 cm’/mole). The two surfaces represent “melting” (stippled) and homogenization points. Sublimation is characteristic for compositions for which the homogenization surface runs helow the melting surface.
which is also made discontinuous by the limited solubility of CO2 in HzO. The 3-phase stability field is continuous for the system C02-CH4 and is split in 2 parts for the system C02-Nz. This has the implication that, on cooling to - 18O”C, all C02-N2 inclusions can be frozen to 2 phases (S + V or S + L), but 3 phases (S + L + V) remain stable for most CO*CH4 inclusions. The S + L and S + V stability fields are continuous for the system COz-NZ and separated in 2 fields for the system C02-CH., . Partial homogenization is restricted to temperatures below -147“C for the system C02-N2, but it may occur over a much larger temperature range (between about - 180 and -75“C) for the system C02-CH4. The lowering of critical temperatures is more drastic with increasing Nz than CH,,, due to the lower critical point of N1 (-147’C). Homogenization to the vapour phase is therefore much more common for the system C02-Nz, especially for higher density inclusions. The isochoric phase diagrams, presented above, illustrate the great diversity of phase behaviour observed in many nonaqueous fluid mixtures. A careful study of phase transitions, not only in the range of homogenization temperatures, but
628
A. M. van den Kerkhof
CHL
HI
1
Hl
FIG. 6. Isochoric projections of the system CO*-CH4-Nz for molar volumes between 40 and 200 cm3 (tentative). The stippled regions are characterized by sublimation (S-type), the remaining regions by homogenization (H-type). Isotherms mark homogenization to the liquid (drawn) or to the vapour phase (dashed). The distribution of fluid inclusion types (HI to H4 and S2 to S4) is also indicated.
also at lower temperatures (to - 180°C). gives evidence for the fluid composition or at least for the purity of inclusions. Some transitions are unique for CO*-CH.,, others for COZNz inclusions. It is therefore possible in many cases to recognize CH4 and Nz-rich mixtures, without the use of analytical techniques like Raman analysis. However, for fluid inclusions with more than about 80 mol% CO* the phase behaviour cannot often be distinguished from that of pure COZ inclusions, although the interpretation of trapping PT conditions may be affected considerably by contamination with CH., and/or Nz. For these fluids, accurate measurements of the melting point and/or Raman analysis are indispensable for the determination of fluid compositions. Furthermore, a check of composition is recommended in general for a more accurate determination of molar volumes. Although the topologies of the isochoric sections, as well as quantitative diagrams valid for the larger parts of the binary CO*-CH4 and CO*-N2 systems are now known, improvements still can be made, in particular for the ternary C02-CH4-Nz system. The collection of more basic experimental data is therefore needed in future studies. The observation of several “strange” phase transitions requires modification of the terminology currently used to describe phase transitions. The present terminology standard as proposed by ROEDDER (1987) although very useful for all “normal” HzO-NaCl-CO2 inclusions, does not adequately describe all transitions in C0@ZH4-N2 fluid inclusions. The alternative terms proposed in Table 1 cover all transitions at constant volume in non-aqueous inclusions, but their definitions, especially for the transitions S + L + L, S + L + V + S + L, S + L + S + L + V and metastable homogenization, are still a matter of discussion. The term sublimation as defined here is most controversial as it includes
both transitions S + V -+ V (“evaporation”) and S + L -W L (“dissolution”). Both transitions can be considered as total homogenization and abbreviated as Th S-L (L) and Th S-V (V), respectively (ROEDDER, 1987). The homogenizing phases should then be specified. If homogenization is defined as any transition from 2 to 1 phase, “melting” should be defined as any transition from 3 phases to 2 phases. Melting defined in this way comprises “normal” (final) melting (S + L + V --, L + V) as well as partial homogenization (S + L + V + S + L or S + L + V + S + V). These transitions are considered then as different aspects of melting (BURRUSS,pets. comm.). Most authors use the term homogenization in a more restricted sense, namely the homogenization of liquid and vapour whereas melting is generally used for the disappearance of a solid phase. By defining the phase transitions in fluid inclusions, the following considerations have to be taken into account: a) definitions should be unambiguous, b) the terminology should concur as much as possible with the traditional use, c) all possible phase transitions should be properly named, and d) abbreviations should be [condensed] and preferably not consist of more than 4 characters. It should be noted that phase transitions in aqueous inclusions, especially in complex brines, are different in many respects from phase transitions described above (including the formation of several salts). Furthermore, the role of clathrates is not taken into account here and they may cause even more complications. It is felt that the establishment of a unified terminology for aqueous and non-aqueous fluid inclusions is extremely difficult and perhaps not even possible. Separate terms for isochoric phase transitions in aqueous and non-aqueous fluids seems therefore to be most logical. In spite of the complex phase transitions observed in COZCHI-N2 mixtures, it is possible, by the construction of iso-
C02-CH4 and C02-N2 phase diagrams
choric phase diagrams, to recognize fluid inclusions of mixed composition and to determine their molar volume. Consequently, the way is opened to calculate the trapping pressures, not only of pure gaseous inclusions, but also of complex gas mixtures. Acknowledgments-The
author wishes to thank Dr. R. J. Bodnar for
organizing the PACROFI II meeting in Blacksburg, Virginia, an occasion at which the content ofthis paper was presented. Dr. E. Roedder, Dr. P. E. Brown, and Dr. J. L. R. Touret are kindly acknowledged for their constructive review. Editorial handling: R. J. Bodnar
REFERENCES ARAI Y., KAMINISHI G,, and SAITOS. (197 I) The experimental de-
termination of the PVTX-relations for the carbon dioxide-nitrogen and the carbon dioxide-methane systems. J. Chem. Eng. Japan 4, 113-122. BOWERST. S. and HELGESONH. C. (1984) Calculation of the thermodynamic and geochemical consequences of non-ideal mixing in the system HZO-COrNaCl on phase relations in geologic systems: metamorphic equilibria of high pressures and temperatures. Amer. Mineral. 68, 1059-1079.
BOWERST. S. and HELGESONH. C. (1985) Fortran programs generating fluid inclusion isochores and fugacity coefficients for the system H@-C02-NaCI at high pressures and temperatures. Computers Geosci. 11,203-2 13. BLJRRLJS~ R. C. (198I) Analysis of fluid inclusions: phase equilibria at constant volume. Amer. .I. Sci. 281, 1104-I 126. CAMPBELLA. N. and SMITHN. 0. (195 1) Phase rule (ed. A. FIND LAY).Dover Publications. DARIMONTA. (1986) Gentse des filons transverses du Paliozdique beige. Inclusions fluides. These Doct. Sciences, Univ. Liege. DARIMONTA. and HEYEN G. (1988) Simulation des equilibres de phases dans le systeme CO*-N2: application aux inclusions fluides. Bull. Mineral. 111, 179-182. DUBESSYJ. (1985) Contribution a I’kude des interactions entre pal&ofluides et miniraux a partir de 1’Ctudedes inclusions fluides par microspectrometrie Raman-Conlquences mttallogeniques. These Doct. Inst. National Polytechnique de Lorraine, Nancy. FABRED. and COUTY R. (1986) Etude par spectroscopic Raman, du methane cornprime jusqu’a 3 kbar. Application a la mesure de pression dans les inclusions fluides contenues dans Ies mineraux. C. R. Acud. Sci. Paris, t. 303, s&e II, 14, 1305-1308. GUILHAUMOUN., DHAMELINCOURT P., TOURAYJ-C., and TOURET
629
J. ( 198 1) Etude des inclusions fluides du systeme N2-CO2de dolomites et de quartz de Tunisie scptentrionale. DonnCes de la microcryoscopie et de I’analyse a la microsonde B effet Raman. Geechim. Cosmochim. Acta 45,657-673.
HERSKOWITZM. and K~SCHH. J. f1984) An algorithm for findina composition, molar volume and‘isochores of-C02-CH4 fluid inclusions from Th and Tr, (for Th < Tr,,,). Geochim. Cosmochim. Acta 48, 1581-1587.
HEYENG., RAMB~ZC., and DUBESSYJ. (1982) Simulation des equilibres de phases dans le systeme C02-CH4 en dessous de 50°C et de 100 bar. Application aux inclusions fluides. C. R. Acad. Sci. Paris, t. 294, s&ie II, 203-206. HOLLISTERL. S. and CRAWFORDM. L., eds. (198 1) Short Course in Fluid Inclusions: Applications to Petrology. Mineral. Assoc. Canada. HOLLOWAYJ. R. (1977) Fugacities and activity of molecular species in supercritical fluids. In Thermodynamics in Geology (ed. D. G. FRASER).pp. 161-181. KERKHOFA. M. VAN DEN (1988a) The system CO*-CH4-N2 in fluid inclusions: theoretical modelling and geological applications. Ph.D. dissertation, Free University, Amsterdam. KERKHOFA. M. VAN DEN (1988b) Phase transitions and molar volumes of CO2CH4-N2 inclusions. Bull. Mineral. 111,257-266. KERKHOF A. M. VAN DEN (1990) Fluid inclusions in quartz veins from high-temperature granulites of Rogaland, SW Norway, Geechim. Cosmochim. Acta (submitted). KREULENR. and SCHUILINGR. D. (1982)Nr-CH.,-C02 fluids during formation ofthe Dome de fAgout, France. Geochim. Cosmochim. Acta 46, 193-203. RAMBOZC.. SCHNAPPERD.. and DUBESSYJ. (1984) The P-V-T-Xf0, evolution of HrO-C02-CH4-bearing fluid in a wolframite vein: reconstruction from fluid inclusion studies. Geochim. Cosmochim. Acta 49, 205-2 19.
ROEDDERE. ( 1984) Fluid inclusions; Reviews in Mineralogy 12 (ed. P. H. RIBBE).Mineral. Sot. Amer. ROEDDERE. ( 1987) Fluid Inclusion Research, Vol. 20. The University of Michigan Press. SMITHF. G. (1963) Physical Geochemistry, Vol. 1. Addiston-Wesley Publ. SWANENBERG H. E. C. (1980) Fluid inclusions in high-grade metamorphic rocks from SW. Norway. Geologica Ultruiectina 25 (Univ. Utrecht). TOURETJ. L. R. (1977) The significance of fluid inclusions in metamorphic rocks. In Thermodynamics in Geology (ed. D. G. FRASER); NATO ASI, Series, 203-227. D. Reidel Publ. TOURETJ. L. R. (1982) An empirical phase diagram for a part of the N2-CO2 system at low temperature. Chem. Geol. 37, 49-58. T~URET J. L. R. and VAN DEN KERKHOF A. M. (1986) High density fluids in the lower crust and upper mantle. (Proceedings of the Xth AIRAPT International High Pressure Conference). Physicu 139 and 14OB, 834-840.