Nanoliter Reactors Improve Multiple Displacement Amplification of Genomes from Single Cells Yann Marcy1,2¤, Thomas Ishoey3, Roger S. Lasken3, Timothy B. Stockwell4, Brian P. Walenz4, Aaron L. Halpern4, Karen Y. Beeson4, Susanne M. D. Goldberg5, Stephen R. Quake1,2* 1 Department of Bioengineering, Stanford University, Stanford, California, United States of America, 2 Howard Hughes Medical Institute, Stanford University, Stanford, California, United States of America, 3 J. Craig Venter Institute, La Jolla, California, United States of America, 4 J. Craig Venter Institute, Rockville, Maryland, United States of America, 5 The Joint Technology Center, J. Craig Venter Institute, Rockville, Maryland, United States of America
Since only a small fraction of environmental bacteria are amenable to laboratory culture, there is great interest in genomic sequencing directly from single cells. Sufficient DNA for sequencing can be obtained from one cell by the Multiple Displacement Amplification (MDA) method, thereby eliminating the need to develop culture methods. Here we used a microfluidic device to isolate individual Escherichia coli and amplify genomic DNA by MDA in 60-nl reactions. Our results confirm a report that reduced MDA reaction volume lowers nonspecific synthesis that can result from contaminant DNA templates and unfavourable interaction between primers. The quality of the genome amplification was assessed by qPCR and compared favourably to single-cell amplifications performed in standard 50-ll volumes. Amplification bias was greatly reduced in nanoliter volumes, thereby providing a more even representation of all sequences. Single-cell amplicons from both microliter and nanoliter volumes provided high-quality sequence data by high-throughput pyrosequencing, thereby demonstrating a straightforward route to sequencing genomes from single cells. Citation: Marcy Y, Ishoey T, Lasken RS, Stockwell TB, Walenz BP, et al. (2007) Nanoliter reactors improve multiple displacement amplification of genomes from single cells. PLoS Genet 3(9): e155. doi:10.1371/journal.pgen.0030155
lower volume on amplification bias was not determined. Meticulous reagent cleaning and strict sample handling procedures can be used to make background amplification negligible in microliter MDA reactions; this enabled accurate assembly of 62% and 66% of individual Prochlorococcus genomes after conventional Sanger sequencing to depths of 3.53 and 4.73, respectively [8]. Due to amplification bias, these sequencing depths are greater than would be required for unamplified DNA template. Here, we studied the performance of MDA on single-cell genome amplification and show by means of a direct comparison that amplification bias is reduced and specific amplification is increased as the reaction volume shrinks from microliters to nanoliters. Parallel single-cell isolation and whole genome amplification was performed using a dedicated microfluidic chip with 60-nl reactors. The microfluidic device has an integrated cell sorter to isolate selected individual cells, thereby allowing flexible sample selection and avoiding the contamination that can reportedly be introduced by conventional FACS [8]. Parallel amplification
Introduction Recovery of whole genome sequences from single cells greatly facilitates the study of microbial ecology and evolution because the majority of microorganisms cannot be obtained in pure culture [1,2]. A method called Multiple Displacement Amplification (MDA) [3–6] enables genome amplification from single cells isolated by FACS flow cytometry [7] or by serial dilution [8]. Micromanipulation methods [9] have allowed isolation of cells identified by fluorescent in situ hybridization (FISH) using 16S rRNA gene probes, allowing specific microbes to be selected and increasing the confidence of asserting the presence of single cells in MDA reactions. Partial genome sequencing from single-cell amplicons has also been demonstrated [8,10,11] MDA suffers from two unwanted characteristics: (1) nonspecific synthesis [3–5,8] coming from either DNA contamination competing with the intended template or endogenously generated DNA such as primer dimers, and (2) uneven representation of the template due to amplification bias [4,5] that is worsened by stochastic effects of MDA from a single copy of the genome. In the initial report of MDA from a single bacterial cell [7], an estimated 70% of DNA synthesis was nonspecific and, of the 30% that was specific to the cell isolated, amplification bias ranged over several orders of magnitude. A recent study using a combination of MDA and rolling circle amplification showed single-molecule amplification of circular 7-kb DNA templates, and demonstrated that improved specificity could be achieved by reducing the volume of the MDA reaction [12] from the standard 50ll down to 600 nl. The effect of the PLoS Genetics | www.plosgenetics.org
Editor: Paul M. Richardson, Department of Energy Joint Genome Institute, United States of America Received April 18, 2007; Accepted July 26, 2007; Published September 21, 2007 Copyright: Ó 2007 Marcy et al. This is an open-access article distributed under the terms of the Creative Commons Attribution License, which permits unrestricted use, distribution, and reproduction in any medium, provided the original author and source are credited. Abbreviations: MDA, Multiple Displacement Amplification; qPCR, quantitative PCR * To whom correspondence should be addressed. E-mail:
[email protected] ¤ Current address: Genewave SAS, Palaiseau, France
1702
September 2007 | Volume 3 | Issue 9 | e155
Nanoliter Reactors Improve MDA
Author Summary
pushed into the feed line until all the air escaped from the channel. We then opened both the feed and lysis valve. The solution containing the cell was pushed into the lysis chamber, replacing the air inside. Once the chambers filled, we closed the feed valve, waited about 20 min, and washed the feed line first with air, then with the neutralization solution; the waste valve was open during this operation. We then reopened the feed valve, opened the neutralization valve, and pushed the liquid until complete filling of the neutralization chamber was achieved. Neutralization occurred for about 15 min, during which time the feed line was washed again, this time with the reaction mix. The reaction chamber was finally loaded by opening the feed and reaction valves. All the chip valves were then closed, except for the three valves separating the chambers, and the chip was placed onto a hotplate set at 32 8C for 10 h to 16 h to carry out the amplification step. We retrieved the samples in a volume of about 10 ll. The amount of DNA resulting from the amplification was about 40 ng to 50 ng. We estimated the copy number at this step using quantitative PCR of a region of the gene coding for the SSU rRNA (Figure 2). The 60nl reactor provided fairly reproducible DNA yields; the distribution of yields over 25 separate single-cell amplifications was approximately lognormal with median 1.4 3 107 and geometric standard deviation of 19. We reamplified half of each sample, this time using the protocol recommended by the manufacturer. This second amplification yielded about 50 lg of DNA in the 50-ll reaction. The yields are also highly reproducible and demonstrate the utility of serial amplifications when starting from small initial reaction volumes. MDA tends to be a self-limiting reaction, with DNA yields reaching a plateau at about 0.7–1.0 lg/ll. Therefore, the overall amplification should still be about 109 1010-fold [7], whether amplifying from one E. coli cell in a single 50-ll reaction or serially amplifying, first to the plateau level in 60 nl, and then transferring half or more of this to a 50-ll MDA reaction. For control reactions, 12 replicate MDAs were carried out in a 50-ll volume as recommended by the manufacturer (and referred to hereafter as the ‘‘standard reaction’’), with each reaction receiving a single E. coli cell isolated by micromanipulation [9,10]. The yield for the control reactions ranged between 40 lg and 50 lg of DNA. Quantitative PCR (qPCR) using Taqman assays for ten different single-copy loci [7] of the E. coli genome was used to evaluate all MDA reactions. The results are reported as concentration (copies/ ll) (Figure 3). Amplification bias is indicated by the over- and underrepresentation of the ten loci. The bias is far greater for the 50-ll MDA reactions, and several loci were not detected at all in four of the 12 reactions, whereas all loci were detected in the microfluidic reactions. On a percent basis, where a value of 100% indicates that a locus is still present at one copy per genome [5] after the amplification, the loci ranged from .0.1% to 106% with coefficient of variation of 223% for the twelve 50-ll MDA reactions and 21% to 80% and 16% to 77%, with coefficient of variation of 88% and 135%, respectively, for the two microfluidic MDA reaction sets (Figure 3D). It is not immediately obvious why bias would be lower in smaller volumes, as bias is generally thought to be a concentration-independent phenomenon resulting from differences in local priming efficiency at different DNA sequences. Bias is also thought to result from stochastic
It is often challenging to manipulate or analyze the genetic material or genome of an individual cell. Biochemical DNA amplification technologies can be used to make many copies of the genome from a single cell, and in this paper we investigated how well such amplification works as a function of the reaction volume. We found that single-cell genome amplification in nanoliter volumes is much more effective than in microliter volumes, providing better representation of the starting genome with less bias in the product. It should therefore be possible to obtain high-quality genome sequences from single cells. This is useful because very few microbes can be obtained in pure culture, and are therefore only amenable to single-cell analysis.
of defined cells greatly reduces reagent consumption, making the process more economical. This technique allows for significant improvement of the amplification specificity by strongly reducing the background amplification without requiring stringent reagent or sample handling protocols. Direct pyrosequencing of the amplification product shows highly specific assembly and mapping onto the consensus genome.
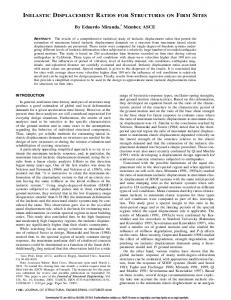
Results/Discussion The microfluidic chip allows for the parallel isolation and addressing of eight single bacteria into separate 3-nl chambers in an automatic fashion, and has also been used to perform a manual survey of environmental microbes in the human oral cavity [13]. We used it here to perform an automatic isolation and addressing of single E. coli fluorescently labeled by a generic DNA stain. Both the microscope and the valve operation are driven by custom software. Cells are pumped into the sorting channel (Figure 1). As soon as a fluorescent signal is detected in front of the isolation region, the isolation valve is closed. An image is taken and analyzed to count the number of cells. If the cell number is not equal to one, the algorithm goes back to the previous step. If there is one cell, the sorting valve is opened and the single cell is pumped into the template chamber until it is detected at its entrance and the chamber is then closed. The algorithm is then iterated for the next processing units, uniquely addressed using the multiplexer. Once all chambers are processed, they are carefully checked to verify the presence of a single cell (or absence in the no-cell control chamber). An example of one round of isolation is shown in Figure 1. The first seven chambers contain one single fluorescently labeled cell and the last one is used as a control. A semiautomated (or manual) procedure using unstained cells was essentially similar to the automated one, the different steps being performed by the operator instead of the algorithm. The cell detection and counting were performed visually using phase contrast microscopy. On chip whole-genome amplification of single E. coli cells was performed in a final reactor volume of 60 nl, yielding about 107 copies of the genome. The amplification units contain four chambers, each one dedicated to a single step of the amplification protocol: a template chamber (3-nl volume), an alkaline cell lysis and DNA denaturation chamber (3.5 nl), a neutralization chamber (3.5 nl), and a reaction chamber (50 nl). Chip operation is shown in Figure 2. The lysis buffer was PLoS Genetics | www.plosgenetics.org
1703
September 2007 | Volume 3 | Issue 9 | e155
Nanoliter Reactors Improve MDA
Figure 1. Photograph of a Single-Cell Isolation and Genome-Amplification Chip Capable of Processing Nine Samples in Parallel (Eight Cells, One Positive Control) (A) To visualize the architecture, the channels and chambers have been filled with blue food coloring and the control lines to actuate the valves have been filled with red food coloring (scale bar 5 mm). (B) Schematic diagram of the automated sorting procedure. Closed valves are shown in red, open valves are transparent (for a description see text body). Cells are drawn in green. (C) Typical result of cell sorting showing for each unit (seven with a single cell and one negative control without a cell) a color combination of a phase contrast image (gray) and a fluorescence image (green). A green overlaid square has been placed around the cell to ease visualization, whereas a red crossed square indicates the absence of cell. Scale bar is 100 lm. doi:10.1371/journal.pgen.0030155.g001
effects early in the reaction, in which uneven amplification occurs by chance across the template. One possible explanation is that the small volume reactions have reduced competition with contaminant or endogenously generated background, thus providing more DNA polymerase molecules per E. coli template and ensuring more uniform amplification. It is also possible that damage to the DNA template is reduced in the microfluidic system, and this results in lower amplification bias. As pointed out above, the 60-nl MDA and subsequent MDA up to a final volume of 50 ll gives a net amplification of 109–1010-fold, just as for the single 50-ll standard reactions. Therefore, any difference in amplification bias or coverage between nanliter and microliter reactions should not be simply due to a lower total-fold amplification in the 60-nl case. qPCR carried out at a sufficient number of different loci can also be used to estimate the specificity of the reaction for the single E. coli DNA template [5]. While amplification bias will result in over- and underreprentation of various loci, the average representation of the combined single-copy loci tested will approach one copy per genome if the amplified DNA is entirely E. coli sequence. The average of the ten loci for the two sets of 60-nl MDA reactions was 0.47 and 0.38 copies per genome, respectively, indicating that approximately 47% and 38% of the amplified DNA was specifically derived from the E. coli DNA template and implying that 53% and 62%, respectively, was nonspecific DNA synthesis such as primer dimers or amplification from contaminating DNA PLoS Genetics | www.plosgenetics.org
templates. The larger-volume control reactions were less specific, with an average locus representation of only 27%. This was consistent with a previous report of 30% for standard 50-ll MDA reactions [7]. In order to measure the specificity of the amplification, large-scale pyrosequencing was performed on the two best single-cell amplicons from each method (Figure 3, dashed lines), based on their performance in the qPCR assays. In the qPCR assays, these had loci representations, averaged over all ten loci tested, of 80% for the 60-nl microfluidic MDA reactions and 88% for the 50-ll control reaction. Therefore, it was estimated that 20% and 12%, respectively, was nonspecific DNA synthesis. When these samples were used in pyrosequencing, the nanoliter MDA sample produced 97,470 usable reads, totaling 9,833,093 bases, and the microliter MDA sample produced 114,551 usable reads, totaling 11,518,280 bases, each sample being processed on one half of a 454 Life Sciences Genome Sequencer 20 picotiter plate. For each sample, a de novo assembly of the reads was performed using the GS 20 Data Processing Software runAssembly script. For both samples, the read status statistics for assembly were similar (Table 1): 82% of the reads assembled, 7%–8% of the reads had no overlap and remained singleton, 10% of the reads were identified as likely repeats, and less than 0.4% of the reads were identified as problematic by the assembler, possibly due to being chimeric sequences. Individual reads were mapped to the E. coli K12 reference strain genome using the GS 20 Data Processing Software 1704
September 2007 | Volume 3 | Issue 9 | e155
Nanoliter Reactors Improve MDA
PLoS Genetics | www.plosgenetics.org
1705
September 2007 | Volume 3 | Issue 9 | e155
Nanoliter Reactors Improve MDA Figure 2. Microfluidic Single Cell Amplification Procedure and Results (A–H) Schematic diagram of a single amplification unit. The feed line is used to bring reagents into the chambers when the Vr valve is open, and to the waste when the Vw valve is open. The Vin valve allows deposition of a single bacterium into the sorting chamber. The lysis (3.5 nl), neutralization (3.5 nl), and reaction chambers (50 nl) are used in sequence and are separated by individual valves VL, VN, and VR. Valve Vout allows recovery of the amplified genomic material from the chip into an individual microcentrifuge tube. (B) After a cell is trapped in the chamber, the feed line is filled with lysis buffer. (C) The lysis buffer is used to push the cell into the lysis chamber. (D) While the lysis buffer is mixing with the cell solution by diffusion, the feed line is flushed. (E) Neutralization buffer is loaded into the feed line and used to push the cell lysate into the neutralization chamber. (F) While the neutralization reaction is mixing by diffusion, the feed line is flushed. (G) The WGA reagents are loaded into the feed line and used to push the neutralized cell lysate into the reaction chamber. (H) The amplification reaction proceeds in a closed system comprising sorting, lysis, neutralization, and reaction chambers. (I) Typical result for a single chip. Estimated genome copy number after the first round of amplification (on chip, green) and second round (off chip, blue) for eight units. Units one through seven start with a single cell inside and unit eight (not) starts without a cell. doi:10.1371/journal.pgen.0030155.g002
runMapping script. For both samples, .95% of all reads mapped fully or partially to the reference genome. This level is reasonably consistent with the qPCR analysis (Figure 3), which estimated that about 80% and 88% of DNA was specific for the 60-nl and 50-ll reactions, respectively, but was based on the average of only ten loci. The qPCR reactions provide a useful quality-control assay prior to sequencing, as well as testing the relative performance between different reaction conditions, such as two volumes (Figure 3). Even for novel microbes, qPCR quality-control assays based on 16S
rDNA sequences or other initially identified loci can be used to assure a high level of success in subsequent sequencing efforts. One possibility that remains to be tested is that the 454 sequencing protocol itself may also improve specificity if small nonspecific DNAs such as primer dimers are lost during PCR or DNA clean-up steps. If so, the combination of MDA and emulsion PCR sample preparation will be a particularly powerful approach to single-cell sequencing applications. The assembly process also greatly improved specificity for E. coli sequence, with over 99% of the contigs mapping to the
Figure 3. Quantitative PCR Analysis by TaqMan Assay for Representation of Ten Loci in Single-Cell Amplifications Each line represents one MDA reaction from two series of 60-nl microfluidics amplifications (A and B) and 50-ll control amplifications (C). The lower limit (10 copies/ll) of the figures corresponds to the detection limit of the TaqMan assay. Dotted lines in (A) and (C) represent the amplifications selected for sequencing. (D) Coefficient of variance (CV) for the seven 60-nl MDA reactions in panel (A), seven 60-nl MDA reactions in panel (B), and 12 50-ll control MDA reactions in panel (C). The average of the ten loci for the two series of 60-nl microfluidics amplifications and 50-ll control amplifications are indicated at the right. doi:10.1371/journal.pgen.0030155.g003 PLoS Genetics | www.plosgenetics.org
1706
September 2007 | Volume 3 | Issue 9 | e155
Nanoliter Reactors Improve MDA
sample (Erythrobacter litoralis), the standard deviation of counts among ten segments ranged from 3% to 4% of the mean value. The lower bias for sequences derived from the 60-nl MDA reaction is in agreement with the qPCR analysis, which also indicated that lower reaction volume reduces bias (Figure 3). The MDA reaction is known to generate DNA chimeras. We used the sequence data to measure the frequency of chimeras. Using the reads that only partially mapped onto the reference genome, we discovered 792 chimeras in the nanoliter samples and 495 chimeras in the microliter sample. This corresponds to a chimera rate of 1 in 10 kbp and 1 in 20 kbp, respectively. This is slightly better than observed when sequencing Sanger libraries of MDA amplifications, and slightly worse than observed when the samples are treated with an S1 nuclease [8]. Additional studies will be required to determine if the difference in chimera rates between nanoliter and microliter samples is significant. The reaction pathway that leads to chimera formation was recently solved [15] and may be unrelated to amplification bias, template specificity, and percent coverage. Chimera formation results from alterative secondary structures that can occur in the branched DNA formed during the MDA reaction. DNA 39 termini extended on an initial template can be displaced by a branch migration mechanism and then extended on a new template, creating the rearranged sequence. Eighty-five percent of chimeras consisted of two segments joined in inverted orientation as predicted by the model. In conclusion, we have shown that microfluidic devices allow accurate and high fidelity single-cell genome amplification by MDA in nanoliter volumes. The advantages of going to smaller volumes include a higher percentage of specific product from the targeted DNA template, reduced amplification bias, and significant economies of scale in terms of reagent consumption. High throughput pyrosequencing of the amplicons shows that the specificity from single cells is extraordinarily high, which suggests that it may be possible to perform full genome assemblies with this procedure. Pyrosequencing has the advantage of simplified library construction, and although current pyrosequencing technologies have shorter read lengths than Sanger sequencing, substantial de novo assembly was achieved. For unculturable organisms, this approach will greatly increase the diversity of species amenable to genomic study. The ability to rapidly acquire even substantial portions of the genome, when used to aid in assembly of existing metagenomic shotgun data [16], promises to greatly accelerate genomic discovery of new microbial species.
Table 1. Sequencing Statistics Measurement
Microfluidic 60-nl MDA
50-ll MDA
Percent reads assembled Percent reads no overlap Percent likely repeats Percent identified as problematic sequences by 454 assembler Percent contigs mapping to E. coli Percent genome coverage by contigs Percent reads fully or partially mapping to E. coli Percent reads partially mapping to E. coli Percent reads unmapped to E. coli Inferred read errors Percent of K12 genome covered Measured/predicted by Lander Waterman model Coverage measured/coverage predicted Percent chimeric reads
82 7–8 10 ,0.4
82 7–8 10 ,0.4
.99 32.57 .95
.99 38.66 .95
2.16 0.36 0.55 60.75/86.84
4.12 1.36 1.12 67.37/90.41
0.70 0.85
0.75 0.45
doi:10.1371/journal.pgen.0030155.t001
reference genome. The extremely high level of specificity bodes well for use of MDA in sequencing novel organisms. For the nanoliter sample, contigs covered 33% of the reference genome. For the microliter sample, contigs covered 39% of the reference genome. Since the microliter sample was prescreened by qPCR to assure relatively low amplification bias, and was therefore not a representative sample, it is not surprising that its performance was comparable to the nanoliter sample. The average length of mapped reads was 100 bases. For the nanoliter sample, reads covered 61% of the reference genome. For the microliter sample, reads covered 67% of the reference genome. Under the ideal assumptions implicit in the Lander-Waterman model for the fraction of genome expected to be covered by reads, for the nanoliter sample, with 9,408,767 mapped bases expected to provide an average of 2.03-fold sampling of the genome, the expected genome coverage is 87%, but only 61% was covered. For the microliter sample, with 10,878,753 mapped bases, the expected genome coverage is 90%, but only 67% was covered. Thus, for both samples, only 70%–75% of the expected genome coverage was achieved. The amplification bias created by MDA [4,5,7,14] can account for this discrepancy. Overrepresentation of some sequences and underrepresentation of others should result in the coverage being lower than the ideal value. Nevertheless, the ability to sequence unculturable microbes, even with the requirement of sequencing to greater depth in order to close genomes, promises to be a major advancement in microbiology. A second method used to assess representational bias was to partition the reference genome into ten equally sized segments, count the number of reads whose centers mapped to each segment, and analyze the resulting histograms. For the nanoliter sample, the standard deviation of counts among the ten segments was 29% of the mean value. For the microliter sample, the standard deviation of counts among the ten segments was 38% of the mean value. By comparison, in four regions of 454 sequencing data from a non-MDA PLoS Genetics | www.plosgenetics.org
Materials and Methods Chip fabrication. Chips were made as described for a push up geometry [17] with some adjustments described in detail in Protocol S1. Chip design. The chip has nine processing units; eight of them have both the cell sorting and amplification features and one is dedicated to the positive control and lacks the sorting capability. The chip contains 24 control lines operating 225 valves. The valves define: six valves to control input lines, 9 3 1 pumps, a base 3 multiplexer replicated on both sides of the chip to uniquely address each processing unit for input and output, 8 3 3 valves for the sorting process, and 9 3 6 valves for the amplification operation. The attribution of the different inlets are described in the Supporting Information. Chip operation for cell sorting. All operations were performed 1707
September 2007 | Volume 3 | Issue 9 | e155
Nanoliter Reactors Improve MDA PCR analysis. The on chip amplification was analysed using a SYBR Green qPCR assay (Bio-Rad Laboratories, http://www.bio-rad.com/), with primers directed at a 200-bp region of the 16S rRNA gene of E. coli strain K12. The resulting copy number was then divided by seven, the number of copies of this gene in the genome. The reamplified MDA products were analyzed by Taqman assay for ten different single-copy loci together with the control reactions [7]. The concentration of double stranded DNA was measured using a PicoGreen assay (Invitrogen, http://www.invitrogen.com/). Pyrosequencing. Approximately 5 lg of the MDA products chosen for sequencing were used for 454 library construction according to the recommended procedures of 454 Life Sciences (http://www.454. com/). Sixteen emulsion PCRs were set up for each sample, and 454 standard protocols were followed for both enrichment and sequencing. Sequence Analysis. For each sample, de novo assembly of the pyrosequencing data was performed using the GS 20 Data Processing Software runAssembly script. Assembly metrics were collected from the output 454NewblerMetrics.txt file. For each sample, a mapping of the pyrosequencing reads to the E. coli K12 reference sequence was performed using the GS 20 Data Processing Software runMapping script. Mapping metrics were collected from the output 454NewblerMetrics.txt file. Reads categorized as PartiallyMapped (Partial) were further analyzed by using National Center for Biotechnology Information (NCBI) BLAST Version 2.2.10 (http://www.ncbi.nlm.nih.gov/) to align each of these reads to the E. coli K12 reference sequence. Reads that had two segments of length .20 bp that mapped to noncontiguous portions of the reference genome were characterized as chimeric.
using custom software written in LabVIEW (National Instruments, http://www.ni.com/) driving both the valves through a BOB3 controller (Fluidigm, http://www.fluidigm.com/) operating 24 solenoid valves and an automated microscope (DMI6000; Leica, http://www. leica-microsystems.com/) onto which the chip was mounted. The automatic cell sorting and addressing was performed with a 203 phase contrast objective and the image recorded using a CCD camera (Retiga 2000 Qimaging, http://www.qimaging.com/). The chip was positioned using dedicated alignment marks replicated for each processing unit. One phase contrast image of the first mark was recorded and used as a reference to automatically position and adjust the focus for the next processing units by image comparison analysis. The automatic cell sorting was operated using fluorescence. Every detection step was performed by recording an image of a small area. This image was analyzed in real time using a LabVIEW particle analysis subroutine after low pass filtering and thresholding. The final verification of the chambers was performed either by fluorescence or by subtracting two phase contrast images a few seconds apart. Since we never observed a cell adhering to the template chamber, the resulting image always exhibited a bright and a dark spot corresponding to two different positions of a single cell displaced by Brownian motion. On chip amplification protocol. The on chip amplification procedure was made with the Qiagen REPLI-g MIDI kit (http:// www1.qiagen.com/) using a modified protocol. The template chamber where the cells were addressed was filled with PBS buffer with 0.2% Triton X-100. The lysis buffer and neutralization buffer were prepared as recommended in the protocol for cell amplification. The reaction mix was supplemented to reach a final concentration of 23 of kit polymerase and 0.2% of Tween 20. After amplification, the samples were retrieved. The feed line was flushed with air and then washed with TE buffer containing 0.2% Tween 20. Then the feed and the output valves opened and the amplified reactions in the chamber were pushed into gel loading tips placed into the outlet holes until reaching the desired volume. The off chip reamplification was performed following the protocol recommended by the manufacturer for genomic DNA using 5 ll of the amplified samples. Micromanipulated cells. The system for micromanipulation has been described in detail elsewhere [9]. Briefly, an inverted microscope (Olympus IX70, http://www.olympusmicro.com/) with micromanipulation equipment (TransferMan NK2 and CellTram Vario; Eppendorf, http://www.eppendorfna.com/) was used with sterilized glass capillaries (ID 10 lm, Eppendorf) to isolate single E. coli cells from a suspension of cells to 200 nl TE buffer. The cells were placed on ice until all cells for the control series were collected. TE-buffer (2.8ll) was added and MDA carried out using the Repli-g kit (Qiagen) following the manufacturer’s recommended protocol. After incubation for 16 h at 30 8C the reactions were terminated at 65 8C for 3 min.
Supporting Information Protocol S1. Supplemental Materials and Methods Found at doi:10.1371/journal.pgen.0030155.sd001 (108 KB PDF).
Acknowledgments Author contributions. YM, TI, RSL, and SRQ conceived and designed the experiments and wrote the paper. YM, TI, KYB, and SMDG performed the experiments. YM, TI, RSL, TBS, BPW, ALH, and SRQ analyzed the data. Funding. This work was supported in part by the National Institutes of Health (NIH) Director’s Pioneer award and NIH 1RO1 HG002644-01A1. Competing interests. The authors have declared that no competing interests exist.
References 1. Hutchison CA 3rd, Venter JC (2006) Single-cell genomics. Nat Biotechnol 24: 657–658. 2. Rappe MS, Giovannoni SJ (2003) The uncultured microbial majority. Annu Rev Microbiol 57: 369–394. 3. Dean FB, Hosono S, Fang L, Wu X, Faruqi AF, et al. (2002) Comprehensive human genome amplification using multiple displacement amplification. Proc Natl Acad Sci U S A 99: 5261–5266. 4. Dean FB, Nelson JR, Giesler TL, Lasken RS (2001) Rapid amplification of plasmid and phage DNA using Phi 29 DNA polymerase and multiplyprimed rolling circle amplification. Genome Res 11: 1095–1099. 5. Hosono S, Faruqi AF, Dean FB, Du Y, Sun Z, et al. (2003) Unbiased wholegenome amplification directly from clinical samples. Genome Res 13: 954– 964. 6. Lasken RS, Egholm M (2003) Whole genome amplification: abundant supplies of DNA from precious samples or clinical specimens. Trends Biotechnol 21: 531–535. 7. Raghunathan A, Ferguson HR Jr., Bornarth CJ, Song W, Driscoll M, et al. (2005) Genomic DNA amplification from a single bacterium. Appl Environ Microbiol 71: 3342–3347. 8. Zhang K, Martiny AC, Reppas NB, Barry KW, Malek J, et al. (2006) Sequencing genomes from single cells by polymerase cloning. Nat Biotechnol 24: 680–686. 9. Ishoy T, Kvist T, Westermann P, Ahring BK (2006) An improved method for single cell isolation of prokaryotes from meso-, thermo- and hyper-
PLoS Genetics | www.plosgenetics.org
10. 11.
12.
13.
14.
15. 16.
17.
1708
thermophilic environments using micromanipulation. Appl Microbiol Biotechnol 69: 510–514. Lasken R, Hughes S (2005) Whole genome amplification.Hughes S, Lasken R, editors. Oxfordshire (United Kingdom): Scion Publishing. Kvist T, Ahring BK, Lasken RS, Westermann P (2006) Specific single-cell isolation and genomic amplification of uncultured microorganisms. Appl Microbiol Biotechnol 74: 926–35. Hutchison CA 3rd, Smith HO, Pfannkoch C, Venter JC (2005) Cell-free cloning using phi29 DNA polymerase. Proc Natl Acad Sci U S A 102: 17332– 17336. Marcy Y, Ouverney C, Bik EM, Losekann T, Ivanova N, et al. (2007) Dissecting biological ‘‘dark matter’’ with single-cell genetic analysis of rare and uncultivated TM7 microbes from the human mouth. Proc Natl Acad Sci U S A 104: 11889–11894. Pinard R, de Winter A, Sarkis GJ, Gerstein MB, Tartaro KR, et al. (2006) Assessment of whole genome amplification-induced bias through highthroughput, massively parallel whole genome sequencing. BMC Genomics 7: 216. Lasken RS, Stockwell TB (2007) Mechanism of chimera formation during the multiple displacement amplification reaction. BMC Biotechnol 7: 19. Venter JC, Remington K, Heidelberg JF, Halpern AL, Rusch D, et al. (2004) Environmental genome shotgun sequencing of the Sargasso Sea. Science 304: 66–74. Thorsen T, Maerkl SJ, Quake SR (2002) Microfluidic large-scale integration. Science 298: 580–584.
September 2007 | Volume 3 | Issue 9 | e155