natural communities will enable us to track the evolution of communities over .... a chain of citations is captured and the distance between clusters is no longer ...
Natural Communities in Large Linked Networks∗ John Hopcroft, Omar Khan, Brian Kulis, and Bart Selman Department of Computer Science Cornell University Ithaca, NY 14850 {jeh,okhan,kulis,selman}@cs.cornell.edu
ABSTRACT We are interested in finding natural communities in largescale linked networks. Our ultimate goal is to track changes over time in such communities. For such temporal tracking, we require a clustering algorithm that is relatively stable under small perturbations of the input data. We have developed an efficient, scalable agglomerative strategy and applied it to the citation graph of the NEC CiteSeer database (250,000 papers; 4.5 million citations). Agglomerative clustering techniques are known to be unstable on data in which the community structure is not strong. We find that some communities are essentially random and thus unstable while others are natural and will appear in most clusterings. These natural communities will enable us to track the evolution of communities over time.
Categories and Subject Descriptors H.3.3 [Information Storage and Retrieval]: Information Search and Retrieval
Keywords natural communities, large linked networks, hierarchical agglomerative clustering, stability
1.
INTRODUCTION
In recent years, we have witnessed a surge of interest in the analysis of very large linked data sources. Two common examples of such data sources are the link structure of the World Wide Web and citation graphs of scientific literature. It has become apparent that much interesting structural information is hidden in such networks. It has also been shown that these linked networks have properties that are very different from those of standard random graph models. For example, real-world linked networks often have “small-world” ∗Supported in part by the NSF, AFOSR and the Intelligent Information Systems Institute at Cornell University
Permission to make digital or hard copies of all or part of this work for personal or classroom use is granted without fee provided that copies are not made or distributed for profit or commercial advantage and that copies bear this notice and the full citation on the first page. To copy otherwise, to republish, to post on servers or to redistribute to lists, requires prior specific permission and/or a fee. SIGKDD ’03, August 24-27, 2003, Washington, DC, USA Copyright 2003 ACM 1-58113-737-0/03/0008 ...$5.00.
characteristics, combining properties from highly structured networks with those of random networks [14]. Also, the node degree distributions are often characterized by power laws, as opposed to exponentially distributed as in standard random graph models. Another important aspect of these linked data sources is their strong temporal component: these networks continue to evolve over time. So far, much of the analysis of linked networks has focused on static “snapshots” of the underlying graphs. Our goal is to study explicitly the temporal component of linked networks. For example, how do certain structures in the network evolve over time? In a citation graph, can one identify the emergence of a new scientific community even before the existence of such a community becomes readily apparent from standard statistical properties? Can one predict the final size of an emerging community? Before we can answer these questions we need to be able to produce clusterings that are relatively stable as the linked network evolves. At first glance, hierarchical agglomerative clustering does not seem to be a candidate for stable clustering. Agglomerative clustering is highly unstable on sparse, high dimensional data. This is not surprising since an agglomerative clustering of an n node network produces a tree of n − 1 clusters most of which have no real significance. However, the clustering algorithm is not uniformly unstable. A careful examination of the results of hundreds of runs shows that most clusters vary widely in each clustering. However, a small number of clusters, approximately 160, appear in every clustering and it is these clusters that correspond to recognizable topics. Thus, the instability is an important tool for finding what we call natural communities and it is these clusters that we will track over time. In this paper, we illustrate an effective agglomerative algorithm for clustering and a method for identifying stable or natural clusters within the linked network. In Section 2 we examine previous research and related work. Section 3 gives the basic facts about the NEC CiteSeer database, the object of our study. Sections 4 and 5 describe the components of the effecient clustering method. Finally, Section 6 and Section 7 look at clustering instabilities and solutions to that problem via our concept of a natural community.
2. RELATED WORK Organizing large document collections via the use of reference information is not a new practice: [13] did the first computerized clustering of the Science Citation Index prior to 1972 using co-citation analysis. They showed it was possible to extract intellectual communities based solely on reference
information. More recently, the NEC CiteSeer group succeeded in identifying intellectual communities in the CiteSeer database and on the web using new variants of cocitation analysis [11] and network flow methods [3]. This, and other research ([4]), has focused on mapping the current state of link networks like science citation graphs and the Web. The methods presented here are motivated by a desire to understand how these maps change over time. As such, our clustering methods must be relatively stable: the clustering must not change much under small perturbations of the input data. In many applications, what matters most is not stability but finding an organization of items that, upon human inspection, is coherent. With respect to the CiteSeer document collection, this amounts to identifying key computer science topics like systems and databases using titles and abstracts. However, the importance of stability is gaining recognition. [9] analysed the stability of the two popular link-based ranking algorithms HITS and PageRank. They point out that intuitively we would not want the rankings for a given query to change much if the base data set, for example the World Wide Web, is altered slightly. They go on to develop algorithms that stabilize the HITS rankings. While clustering is even more subjective than ranking, stability is still useful. In this paper we develop algorithms that cluster the CiteSeer data using only reference information and identify stable intellectual communities. In [8], we show how these stable intellectual communities can be used to effectively track the temporal evolution of the community structure in the CiteSeer graph. In particular, we show that by comparing the community structure at different points in time, one can can identify emerging new communities, growing communities, ones that remain stable, and, finally, communities that decrease in importance over time.
3.
DATA SET
We used an October 2001 snapshot of the NEC CiteSeer database [5]. At that time, the CiteSeer database contained the full text and bibliographies of approximately 250,000 papers, most published since 1990. These are mostly related to computer science, with a small collection covering other topics like physics, mathematics, and economics. In addition, the database contains title and author information on another 1.6 million earlier papers that are referenced by the 250,000 set but whose full text is not contained in the database. We analyze the citation graph induced by this data set: vertices correspond to all 1.85 million papers in the database; there is a directed edge from paper p to paper q if p references q. We call the set of the 250,000 papers whose full-text and bibliography are known the core of the citation graph. The papers in the core have citations to each other and to the 1.6 million non-core papers. We do not have the reference lists for the papers outside the core. So, their out-degree is 0 while their in-degree is at least 1. The out-degree (number of references) for a typical node ranges from 5 to up to 25. The median number of references for the core papers is 14. Interestingly, the majority of core papers are uncited (in-degree = 0). Note that self-citations are excluded. The CiteSeer data has a number of inaccuracies, due to the fact that the information is obtained in a fully automatic manner using web spiders and scripts to find citation infor-
mation and reference data. There is interesting work trying to improve the classification of information of CiteSeer-style systems [1, 10]. In this project we do not explicitly remove the “noise” in the CiteSeer graph because our goal is to develop methods and tools that are relatively robust under reasonable noise models.
4. MEASURING DISTANCE 4.1 Reference-based Measures Two standard bibliometric measures of similarity between two papers p and q are bibliographic coupling [7] and cocitation analysis [12]. The bibliographic coupling of papers p and q is the number of references they share in common. The co-citation count of p and q is the number of papers that reference both p and q together. Co-citation counts more richly describe paper relationships as time passes and people reference (or ignore) a given paper. On the other hand, bibliographic coupling can immediately measure similarities since references come with the paper. However, references cannot change: if a relevant and seminal paper appears in 2004 on this topic then our relationship via bibliographic coupling will be indirect at best; with co-citation, the relationship could emerge very clearly. In addition, there is no regulatory apparatus governing who authors’ cite and so citation practices differ from author to author. However, collectively we tend to cite the important papers, which then supports the use of co-citation analysis. However, given that temporal tracking of emerging communities is the ultimate goal, the slowness of co-citation buildup is more problematic than the noisiness and static nature of bibliographic coupling. Furthermore, bibliographic coupling is by no means bad. One can identify intellectual communities from it. When an author writes a paper on a certain topic, they will cite certain papers that characterize the field. In addition, there will be other general references and unique references specific to their contribution. But each topic will have some set of references that a reasonable author would draw from. Our research focuses on the next logical question: how do new topics, those with unestabilished references, form? We conjecture that the reference structure of these new papers will change to reflect these shifts, and these changes will not be reflected immediately in co-citaton data. Thus, while cocitation measures are quite useful for mapping knowleedge domains, we conjecture that they are too slow for tracking purposes.
4.2 Distance Measure For the agglomerative clustering, we define the distance between two papers p and q as the number of references in paper p times the number of references in paper q, divided by the number of papers in the intersection of the two papers’ reference sets. In this case, the distance between two papers is infinite if the papers do not share a reference in common.1 For clusters with more than one paper, we use a centroidbased measure to determine distance. It should be stressed that our clusters are dependent on the reference structure of our dataset. 1 Of course, once clusters of papers start forming, the implicit relationship between papers that share references via a chain of citations is captured and the distance between clusters is no longer infinite.
For the k-means algorithm, we use the standard Euclidean distance (l2 norm) to determine to which of the k clusters each paper is closest. Each paper is represented as a 0-1 vector whose length is equal to the total number of papers. For a paper p, the vector for p has a 1 in element q if paper p references paper q, and 0 otherwise. For clusters, the vector is the sum of the vectors of the papers in the cluster. Then, we normalize all the vectors and for every paper we wish to cluster, we compute the Euclidean distance to each of the k clusters. Euclidean distance is the standard function used for the kmeans algorithm. It is a metric, and as a result the k-means cost function decreases after every iteration. We do not use the Euclidean distance for the agglomerative clustering: several experiments have shown that using this function (as well as other distance functions we have tried) results in a “skinny” hierarchical clustering tree. In this tree, one cluster tends to dominate early in the running of the algorithm, and then proceeds to grab all the smaller clusters. Our distance function is the only one that we have used that produces a balanced hierarchical clustering tree, which allows us to find smaller communities of topics contained within a single cluster in the tree. In addition, the clusters obtained from running the agglomerative clustering algorithm with our distance function appeared quite coherent – relative to other distance measures – when analyzed with a word frequency count on the titles of the papers in the clusters. The measure is also a simple, intuitive notion of distance.
5.
CLUSTERING
5.1 Background We considered two standard clustering techniques: hierarchical agglomerative clustering and k-means clustering (see [6] for a good overview). Hierarchical agglomerative clustering starts with each paper in a cluster by itself. At each stage the two “closest” clusters are merged. The process is repeated until all papers are in a single cluster. In the k-means algorithm, we begin by randomly placing the n papers into k clusters. We compute the normalized center of gravity of these clusters, then place each paper into its nearest cluster, using the Euclidean distance. We iterate this process, and at each iteration we compute the cost function as the sum of distances of every paper to its cluster’s center of gravity. We continue the process until the decrease in cost is smaller than a parameter δ. The agglomerative algorithm has the disadvantage that it is slow. We discuss our efficient implementation in the next section. However, the algorithm returns a large number of clusters and captures the notion of a hierarchy of communities. Verification techniques based on word frequency and journal and conference proceeding coverage indicate that the clusters obtained by the agglomerative method are more relevant than those from the k-means algorithm. K-means is known to be especially prone to getting stuck in local minima near the initial conditions, which suggests that the algorithm would perform poorly at discovering stable communities. Another difficulty with k-means is that, given n total nodes in the graph, the algorithm tends to find k communities, all of size approximately n/k. We also found that k-means tends to cluster around highly referenced papers and books. Thus, clusters with important papers and
books tend to grab any paper that reference them. This is especially problematic for texts on very general topics since it does not make sense to cluster around them. On the other hand, the k-means algorithm runs very quickly, and is one of the most widely used clustering algorithms.
5.2 Efficient Agglomerative clustering In choosing to use an agglomerative approach over kmeans, the first daunting problem is dealing with slow run times. A naive implementation of an agglomerative clustering stategy would at each step calculate all n2 pair-wise distances for an overall running time of n3 , where n is the number of nodes in the dataset. However, the nature of our data and the distance measure allows us to speed up this process significantly. There are two points at which the algorithm can be sped up. First, one can determine the nearest neighbor for each paper without examining all other papers; second, one does not need to recalculate the nearest neighbor for all papers after a merge, but only those whose nearest neighbor may have been affected by the merge. For each paper, p, the nearest neighbor is computed as follows. Let dout and din be the number of references and number of citations for an average paper, respectively. The set of references Rp is computed. Using a graph with all edges reversed, the set of papers S that reference one or more papers in Rp is determined. Typically the set S associated with a cluster consisting of a single paper is of size dout din (a few hundred). All papers outside S have infinite distance to paper p and are ignored in finding the nearest neighbor of p. The initial distance calculation is approximately of order dout din n, where n is the number nodes in the core. Since the average degrees are very small, this is significantly better than computing all n2 distances. Once the nearest neighbor for each vertex is determined, the pair of closest clusters are merged into a single cluster. Once a merge occurs, the nearest neighbor information needs to be updated. Suppose communities A and B merged and consider a third community C. For C, only three distances change: dist(A∪B, C) must be computed; dist(A, C) and dist(B, C) are invalid. Using the same process outlined above, we first compute the closest neighbor to the merged community A∪B. Call the distance from A∪B to its closest neighbor dm . The nearest neighbor of C changes only if that neighbor was A or B or the new neighbor is A∪B. Thus, the distance to the nearest neighbor of C is recomputed if the previous nearest neighbor was A or B or the distance to the previous nearest neighbor of C was greater than dm . Note that if the distance of C to its nearest neighbor is already less than or equal to dm , it will keep its current nearest neighbor. The above observations lead to an efficient agglomerative clustering algorithm. In our implementation, we are able to obtain a full agglomerative clustering of the CiteSeer data in under 3 hours.
6. INSTABILITIES Agglomerative clustering methods are known to be sensitive to changes in the input data. In this section, we show that the level of instability of agglomerative clustering of our network data is in fact quite dramatic. Later we will exploit such instabilities to identify so-called natural communities, which are clusters that remain relatively stable under perturbations of the input.
Size Range 2-2 3-3 4-4 5-5 6-12 13-24 25-48 49-99 100-200 201-400 401-800 801-1600 1601-3200 3201-6400 6401-12800 12801-25600 25601-51200 51201-102400 102401-204800
# clust. 9858 10025 9936 10042 38459 14701 7573 4015 1930 995 466 260 142 76 40 16 9 5 1
# full 9858 10025 9935 10041 38453 14685 7560 3993 1892 956 423 222 94 34 8 0 0 0 0
match 100.0 100.0 100.0 100.0 100.0 99.9 99.9 99.8 99.3 99.0 97.5 96.5 92.2 89.4 78.5 74.0 74.0 59.8 61.8
std. 0.0 0.0 0.5 0.2 0.5 1.1 1.2 2.7 5.9 5.7 9.2 11.2 14.8 15.9 16.0 13.5 18.4 14.7 0.0
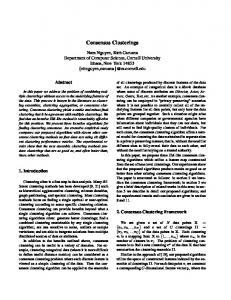
dard deviation of the average value. As one might expect, the smaller clusters (up to size around 100) are hardly affected by this change in data. This is because only the distances between papers that share references with the removed paper are affected. In fact, none of the size 2 or size 3 clusters are changed at the bottom of our tree (compare # clust. with # full). Similarly, only a very small fraction of clusters up to size 100 are changed. However, we see that the effect is amplified moving up the tree. Clusters of size 6,000 and up are changed 20% or more. We also calculated the change in the vector representing the centroid of these clusters and found an average change of around 30 degrees. Figure 1 illustrates our clustering tree and indicates how the centroid of the higher level clusters tilt due to the removal of one paper at the bottom.
level 18
Table 1: Instabilities due to randomly removing a single paper out of 250,000. Note that the effect of the perturbation of the data becomes more pronounced for higher-level clusters, i.e., the perturbation is amplified when moving up the clustering tree. We first considered the effect on our agglomerative clustering by removing a single, randomly selected paper. We selected [2]; the paper has 33 references and is cited by 2 papers. In order to minimize the impact on the graph, we only removed the out-going edges of this node (i.e. the references in the paper). We kept the two incoming references from the papers that cite this paper. So, in effect, we moved the paper from the core set of 250,000 papers to the set of 1.6 million papers outside the core. This is as if the paper had not been found on-line by the CiteSeer crawler. After removing the paper, we ran another agglomerative clustering and found for each cluster in the new tree the best matching cluster in the original tree. The match value associated with 2 clusters C and C 0 is determined using the overlap of papers between C and C 0 . The best match fraction for a community C in tree T to tree T 0 is defined as
bestmatch(C, T 0 ) = max 0 0 C ∈T
min
�
0
0
|C ∩ C | |C ∩ C | , |C| |C 0 | ���
In finding the best match of community C in tree T we compare C to every community C 0 in T . Some communities in T , say the root community, entirely contain C. However, these are not necessarily the best match for C since C contains only a small fraction of their papers. Thus we look for a community C 0 that contains a large fraction of C but also one in which C contains a large fraction of C 0 . Thus the best match of C will usually be roughly the same size as C. This is accomplished by the min condition in the equation. Table 1 gives our results. The column labelled “# clust” gives the number of clusters; “# full” gives the number of clusters such that bestmatch(C, T 0 ) = 1; “match” gives the average bestmatch value as a percentage; “std” is the stan-
cluster size ~ 15,000
level 14
cluster size ~100
level 7
250,000 papers
Figure 1: Instability due to removal a single paper from core set. Apparently, the removal of the references from a single paper out of 250,000 leads to significant change (≥ 20% in the larger clusters). It is surprising to find such a large effect. Note that the change at the bottom of the tree is less than 0.001%. Perhaps beyond a certain size all communities are close together and merges become arbitrary. In the next section, we show how such instabilities actually help us find true structure in the underlying network.
7. NATURAL COMMUNITIES The instability data suggests a method for discovering stable or natural communities in the CiteSeer citation graph. Based on the previous section, we know that there are communities that remain unchanged under small perturbations. Since we ultimately want to track the evolution of the CiteSeer graph G, we can view timewise changes to G as perturbations of the dataset. Thus, before moving to changes related to time, we randomly perturb G many times to discover stable communities across the multiple clusterings.
7.1 Definition We fix a perturbation value of 5%. Then we produce a set of subgraphs {G1 , G2 , . . . , Gn } of G where each Gi is the subgraph of G induced by a random subset of 95% of the core vertices of G (What if the
Root
7135
14780
Physics
173556 Social Science
1709 Finite Elements
CS
77848
70579
CS1
CS2
Speech, Language, Etc.
NLP
12019
8750
29359
3269
Control, Filtering, Images, etc.
Speech
1000
738
Speech
Audio Music
Figure 2: Tree of natural communities. Numbers inside ovals indicate natural community size. CiteSeer crawler missed 5% of the papers?). Our clustering algorithm then produces a set of trees = {T1 , T2 , . . . , Tn } We choose a root tree T ∗ ∈ and compare T ∗ to all trees in − {T ∗ }. Let N ⊆ T ∗ be the desired set of natural communities. We call C ∈ N natural if in a fraction f of the trees the best match of C has a value greater than some threshold p. Notice that there are two parameters to be set: f , the ratio of trees out of n, and p, the threshold for the best match. More formally, C ∈ N is natural if ∃A ⊆ such that ∀ Ti ∈ A : (a) bestmatch(C, Ti ) ≥ p, 0 ≤ p ≤ 1 (b) |A| ≥ f n, 0 ≤ f ≤ 1
7.2 Results The choices of parameters p and f are somewhat arbitrary because the notion of “naturalness” of a community depends on your application. If you want to find very strong communities, you would set both parameters near 1. To select reasonable values for these parameters, we consider the average best match for an arbitrary community as a lower bound. Based on Table 2 we see that average matches are in the high 40% to low 50% range. However, we note that communities of size larger than 1000 do not really get beyond 60% for a best match. So we choose p = 70% as our cutoff for natural communities of size less than 1000 and p = 60% for larger communities. Furthermore, a natural community should appear in more than half of all the trees and so we set f = 0.6. When we filter out just the natural communities from n = 100 runs, we get the data in Table 3. The column “nat” gives the number of natural communities; “match” gives the average best match across all 100 trees; “unnat” gives the number of other clusters. For most
Size Range 100-200 201-400 401-800 801-1600 1601-3200 3201-6400 6401-12800 12801-25600 25601-51200 51201-102400 102401-204800
# clust. 1848 917 482 255 119 82 29 21 10 5 1
match 45.9 48.4 49.1 49.0 49.0 56.0 52.0 49.4 49.7 56.8 75.7
std. 17.2 14.7 13.1 12.5 12.8 12.1 12.7 10.5 8.4 14.8 0.0
Table 2: Matching of two perturbed trees, with 5% of core nodes of G removed. Size Range 100-200 201-400 401-800 801-1600 1601-3200 3201-6400 6401-12800 12801-25600 25601-51200 51201-102400 102401-204800
nat 55 32 11 17 14 13 9 2 1 1 1
match 75.4 74.7 73.2 63.8 65.1 69.4 67.8 68.3 67.5 66.5 68.6
std. 9 7 6 6 6 7 6 7 0 0 0
unnat 1835 898 467 217 105 55 27 19 6 3 0
match 44.2 47.8 47.9 46.8 47.0 48.6 49.9 51.6 48.0 55.6 0
std. 17 14 13 13 11 11 11 11 8 6 0
Table 3: Average community matchings over 100 trees for natural and unnatural communities.
natural communities, the best match is in the range of 70% to 75% compared to 45% to 50% for the best match of other communities. When the number of trees n grows large and f is held fixed, we observe that the number of natural communities stabilizes to around 160 out of approximately 3000 clusters containing 100 or more papers. These natural communities form a tree structure that is partially illustrated in Figure 2. The root node has 16 children most of which have only 100 to 200 papers. These small communities are very sharply defined. The small communities that are children of the root tend to be collections of papers that are not on computer science. For example, there are communities of papers on quantum physics, macroeconomics and finance, and even the Greenland ice sheet. Large communities in the tree are hard to define since they are collections of small, well defined areas. This may explain why the larger communities tend to be slightly less stable than the smaller ones. This process does not capture all the natural communities embedded in G. Our choice of the base tree T ∗ was arbitrary, and yet it fixed our vantage point. If a community is natural but happens to not appear in T ∗ , we will not find it. However, repeating the above process many times with different base trees, and unioning each of the sets of natural communities, would give us a sharper view of the strong structures in the citation graph. As a further experiment, the k-means algorithm was run on the whole graph to determine if any natural communities would emerge. We chose a value of k = 70, which produced communities of between 2000 and 3000 papers. There were several natural communities in this range found by the agglomerative clustering algorithm, using the parameters as discussed above. Unfortunately, comparing 2 runs of k-means revealed that only 3 of the 70 communities had an overlap over 50%, with only 1 of these communities above 60% overlap. It was immediately clear that the vanilla kmeans algorithm would not find natural communities. Finally, we generated a number of random graphs with the same degree structure as G and attempted to find natural communities. To do this, we simply listed the graph edges in two columns (head and tail) and randomly permuted the tail column. While this does not maintain certain real-world properties like temporal referencing constraints, it is nevertheless an insightful random structure. We wished to verify, at a very crude level, that the natural communities process required some latent structure beyond power-law degree distributions to find stability. The results support this: there were no natural communities, and few reasonable matches.
8.
CONCLUSIONS
Our analysis of the CiteSeer citation graph establishes that there is sufficient information hidden in the citation data to extract meaningful higher level structure. Our notion of natural communities allows us to extract a meaningful, stable core set of clusters from a collection of agglomerative clusterings. The agglomerative clustering trees of the CiteSeer data have around 3000 nodes reprenting clusters with more than 100 papers. The vast majority of these clusters are quite unstable and do not provide useful higherlevel information. However, around 160 nodes correspond to coherent natural communities. In [8], we track the evolution of these communities over time and show how we can identify the emergence of new sub-fields.
There are many avenues for future work. With respect to discovering natural communities, basic k-means is certainly unsuccessful. However, more sophisticated k-means methods that integrate local search should be explored. One standard question that should be asked of any clustering algorithm is why we should trust one set of clusters over another. Further validation beyond word frequencybased approaches are needed to validate the clusters; baselines for algorithmic results are needed on synthetic data like simple temporal network models to verify the clustering procedures. More generally, most citation-based methods treat all citations equally, and this yields the problem of equally weighting very general references to textbooks and references to key papers in the field (among other problems). Integrating context into the citation graph, perhaps via edge weights, could improve clustering results.
9. REFERENCES [1] W. W. Cohen, H. Kautz, and D. McAllester. Hardening soft information sources. In Proc. Intl. Conf. Knowledge Discovery and Data Mining, pages 255–259, 2000. [2] P. Dybjer. Inductive families. Formal Aspects of Computing, 6(4):440–465, 1994. [3] G. W. Flake, S. Lawrence, and C. L. Giles. Efficient identification of web communities. In Proc. Intl. Conf. Knowledge Discovery and Data Mining, pages 150–160, 2000. [4] D. Gibson, J. M. Kleinberg, and P. Raghavan. Inferring web communities from link topology. In Proc. Conf.Hypertext and Hypermedia, pages 225–234, 1998. [5] C. L. Giles, K. D. Bollacker, and S. Lawrence. Citeseer: An automatic citation indexing system. In Proc. Intl. Conf. Digital Libraries, pages 89–98, 1998. [6] A. K. Jain and R. C. Dubes. Algorithms for clustering data. Prentice Hall, 1988. [7] M. M. Kessler. Bibliographic coupling between scientific papers. Amer. Document, 14:10–25, 1963. [8] O. Khan, B. Kulis, J. Hopcroft, and B. Selman. Tracking evolving communities in large linked networks. In Sackler Colloquium on Mapping Knowledge Domains, May 2003. [9] A. Y. Ng, A. Zheng, and M. Jordan. Link analysis, eigenvectors and stability. In Proc. Intl. Conf. Artificial Intelligence, pages 903–910, 2001. [10] H. Pasula, B. Marthi, B. Milch, S. Russell, and I. Shpitser. Identity uncertainty and citation matching. In Proc. Advances in Neural Information Processing. MIT Press, 2003. [11] A. Popescul, G. Flake, S. Lawrence, L. Ungar, and C. L. Giles. Clustering and identifying temporal trends in document databases. In Proc. Advances in Digital Libraries, pages 173–182, 2000. [12] H. Small. Co-citation in the scientific literature: A new measure of the relationship between two documents. J. Amer. Soc. Info. Sci., 24:265–269, 1973. [13] H. Small and B. C. Griffith. The structure of the scientific literatures i. identifying and graphing specialties. Science Studies, 4:17–40, 1974. [14] D. J. Watts and S. H. Strogatz. Collective dynamics of small-world networks. Nature, 393:440–442, 1998.