IEEE TRANSACTIONS ON EVOLUTIONARY COMPUTATION
1
Natural Encoding for Evolutionary Supervised Learning Jes´us S. Aguilar–Ruiz, Ra´ul Gir´aldez and Jos´e C. Riquelme
I. I NTRODUCTION
Abstract— One of the most influential factors in the quality of the solutions found by an evolutionary algorithm are a correct coding of the search space and an appropriate evaluation function of the potential solutions. Evolutionary algorithms are often
D
ECISION rules are especially relevant in problems related to supervised learning. Given a dataset with
used to learn decision rules from datasets, which are encoded
continuous and discrete features or attributes, and a class label,
as individuals in the genetic population. In this paper, the
we try to find a rule set that describes the knowledge within
coding of the search space for the obtaining of those decision
data or classifies new unseen data. When the feature ai is
rules is approached, i.e., the representation of the individuals of the genetic population and also the design of specific genetic
discrete, the rules take the form of “if ai ∈ {v1 , . . . , vk }
operators. Our approach, called “natural coding”, uses one gene
then class”, where the values {v1 , . . . , vk } are not necessarily
per feature in the dataset (continuous or discrete). The examples
all those that the feature can take. When the feature aj is
from the datasets are also encoded into the search space, where
continuous, typically the rules take the form of “if aj ∈ [lj , uj ]
the genetic population evolves, and therefore the evaluation
then class”, where lj and uj are two real values belonging
process is improved substantially. Genetic operators for the natural coding are formally defined as algebraic expressions.
to the range of the feature and lj < uj . For example, let
Experiments with several datasets from the UCI machine
us assume that we have a synthetic dataset that associates the
learning repository show that as the genetic operators are better
weight (in kilograms) and eye–color of a person with either or
guided through the search space, the number of rules decreases
not she/he will have a paper accepted in a relevant conference.
considerably while maintaining the accuracy, similar to that of
The dataset is a sequence of tuples such as (60, green, no),
hybrid coding, which joins the well–known binary and real representations to encode discrete and continuous attributes, respectively. The computational cost associated with the natural coding is also reduced with regard to the hybrid representation.
(70, black, yes), etc. A rule describing the relationship among attribute values and class might be: if weight ∈ [56, 70] and eye color is black then yes
Our algorithm, H IDER *, has been statistically tested against C4.5 and C4.5Rules, providing a good performance. The knowl-
The search for these rules can be tackled with many
edge models obtained are simpler, with very few decision rules,
different techniques, however evolutionary algorithms (EAs)
and therefore easier to understand, which is an advantage in
present particularly good performance when the search space
many domains. The experiments with high–dimensional datasets showed the same good behavior, maintaining the quality of the knowledge model with respect to prediction accuracy. Index Terms— Evolutionary Encoding, Supervised Learning, Decision Rules.
is complex. Two critical factors have influence on the decision rules obtained by an evolutionary algorithm: the selection of an internal representation of the search space (encoding) and the definition of an external function that assigns a value of
Jes´us S. Aguilar–Ruiz and Ra´ul Gir´aldez are with the School of Engineering, Pablo de Olavide University, Seville, Spain. Jos´e C. Riquelme is with the Department of Computer Science, University of Seville, Spain. E-mail: {jsagurui,rgirroj}@upo.es,
[email protected].
goodness to the potential solutions (evaluation). In this work, a particular emphasis is placed on the physical representation of the encoding (the genotype: string of genes
IEEE TRANSACTIONS ON EVOLUTIONARY COMPUTATION
2
possessed by an individual) as compared to the features of
A representation is said to contain internal redundancy when
the supervised learning problem to be optimized by the EA
not all of the genetic information contained in a chromosome
(the phenotype). The mapping operation between these two
is strictly necessary in order to identify uniquely the solution
representations is also very important to define the search
to which it corresponds. It is also very common to find
space and to guide the specific genetic operators.
degeneracy in representations. A representation is said to
In principle, a single gene can affect several features in
exhibit degeneracy when more than one chromosome can
the phenotype (mapping one–to–m) or one feature in the
represent the same solution. Degeneracy is often detrimen-
phenotype can be controlled by multiple genes (mapping m–
tal to genetic search [3], because it means that isomorphic
to–one). These two situations, named pleiotropy and poligeny
forms are allowed. In some problems, the effect of one gene
respectively [1], have a strong presence in naturally evolved
suppresses the action of one or more other genes. This feature
systems. However, the one–to–one mapping is the most com-
interdependency, called epistasis, should also be controlled and
mon in evolutionary systems, which represents a simplification
minimized.
of natural evolution. Winston [2] suggests that good generators of solutions in a search space should possess the following properties: •
Completeness: they eventually produce all positions in a search space.
•
Non–redundancy: they never damage efficiency by proposing the same solution twice.
•
Informedness: they use possibility limiting information to restrict the solutions they propose accordingly.
Moreover, a good evolutionary encoding should satisfy the following properties: •
•
•
•
•
is not simple if we wish it to have a good performance. In fact, not only should the encoding preserve most of the properties mentioned above, but new genetic operators should also provide some advantages when the new encodings are used. In this work, we present a new evolutionary encoding to produce decision rules. Our approach, named “natural coding”, is a one–to–one mapping, and it only uses natural numbers to encode continuous and discrete features. This coding needs a new definition for the genetic operators in order to avoid the conversion from natural numbers to the values in the original space. These definitions are presented, and as it is shown in
Coherence: it should not be possible to encode an element
the paper, the evolutionary algorithm can work directly with
that has no semantic meaning.
the natural coding until the end, when the individuals will be
Uniformity: every element will be represented by the
decoded to decision rules.
same number of encodings and, if possible, unique
•
Therefore, the design of a new representation for EAs
The paper is organized as follows: in Section II the work
(uniqueness).
related to binary, integer and real codings is presented; the
Simplicity: the coding function must have easy applica-
motivation of our approach is described in Section III; the
tion in both directions.
natural coding is presented in Section IV, together with
Locality: small modifications to the values (phenotype)
the genetic operators associated with continuous and discrete
should correspond to small modifications to the hypo-
attributes; the algorithm is illustrated in Section V, discussing
thetical solutions (genotype).
the new evaluation method and the length of individuals; later,
Consistency: there should not exist futile or unproductive
we compare our approach to the hybrid coding regarding
codings.
length of individuals and to C4.5 and C4.5Rules to search for
Minimality: the length of the coding should be as short
statistical differences about the error rate and the number of
as possible.
rules, in Section VI; finally, the most interesting conclusions
On the other hand, internal redundancy should be avoided.
are summarized in Section VII.
IEEE TRANSACTIONS ON EVOLUTIONARY COMPUTATION
II. R ELATED W ORK
3
been used for every gene, mostly the binary alphabet, so that size = |Ω|L . However, for a continuous feature with range
Choosing a good genetic representation is critical for the EA to find a good solution for the problem, because the encoding
[l, u], if we decide to use length L to encode it, the error in the precision of that attribute would be:
will have much influence on achieving an effective search. Binary, Gray and floating–point chromosome encodings have error =
been widely used in the literature because they have provided
u−l 2L − 1
(1)
generally satisfactory results. Thus, few alternatives have been
Therefore, if δ = min {|ai − aj | | ∀ai , aj ∈ [l, u], i 6= j},
analyzed. Nevertheless, there are many ways of associating
the minimum encoding length, to ensure the precision is
feature values to genes, which should be discussed in light of
maintained, would be:
finding the best one for specific problems. Taking the aforementioned properties into account, we are going to analyze the most common representations for
»
¶¼ µ u−l L = log2 1 + δ
(2)
evolutionary algorithms, from the perspective of supervised
Taking into account Eq. 2, the quantum defined by error will
learning. To our knowledge, little theoretical work has been
assure that the length is the least that guarantees a good preci-
developed in the field of evolutionary encoding. Many authors
sion for the mutation operator. However, the locality problem
have approached several codings for specific applications,
is not solved for binary representation. Gray encoding, where
most of them for optimization or scheduling tasks, clustering
two individuals next to each other in the search space differ
and feature selection. However, in supervised learning, the
by only one bit, has been studied in depth [13], [14] and offers
binary, real and hybrid (binary coding for discrete features and
some advantages in this realm [15], although it suffers from
real for continuous) codings have commanded the attention of
the same lack of precision as binary coding.
many researchers.
Both binary and Gray representations have some drawbacks
A number of studies dedicated to EAs, beginning with
when applied to multidimensional, high–precision problems.
Holland’s [4], made use of binary coding. The simplicity and,
For example, for 10 attributes with domains in the range [0,1],
above all, the similarity with the concept of Darwinian anal-
where a precision of three digits after the decimal point is
ogy, have advanced its theoretical use and practical applica-
required, the length of an individual is about 100. This, in
tion. Several Genetic Algorithms–based concept learners apply
turn, generates a search space size of about 1030 .
binary coding to encode features with symbolic domains in
For many problems, binary and Gray encoding are not
order to induce decision rules in either propositional (GABIL
appropriate because a value of one bit may suppress the
[5], GIL [6], COGIN [7]) or first-order form (REGAL [8], [9]
fitness contributions of other bits in the genotype (epistasis)
and DOGMA [10]). However, binary coding is not the most
and genetic operators may produce illegal solutions (inconsis-
appropriate for continuous domains.
tency). Some examples of other specific encodings are: Pr¨ufer
In general, binary coding has been widely used, for instance, for feature selection [11] and data reduction [12].
numbers to represent spanning trees [16] and integer numbers to obtain hierarchical clusters [17].
In general, assuming that the interaction among attributes is
In real–valued coding [18], the chromosome is encoded as
not linear, in principle, the size of the search space is related
a vector of floating–point numbers of the same length as the
to the number of genes used. For an individual with L genes, QL the size of the search space is i=1 |Ωi |, where Ωi is the
solution vector. Each attribute is forced to be within a desired
th
alphabet for the i
gene. Traditionally, the same alphabet has
range and the operators are carefully designed to preserve this requirement. The motivation behind floating–point codings is
IEEE TRANSACTIONS ON EVOLUTIONARY COMPUTATION
4
to move the EA closer to the problem space. This coding is
(55, green, yes)
capable of representing quite large domains.
(57, green, no)
On the contrary, its main theoretical problem is the size of
(59, black, no)
the search space. Since the size of the alphabet is infinite,
(60, green no)
the number of possible schemes is also infinite and, therefore,
(62, black,yes)
many schemes syntactically different but semantically similar
(64, blue, no)
will coexist (degeneracy).
(68, black, yes)
In principle, any value can be encoded with an only (real) gene, but this could be avoided using a discrete search space,
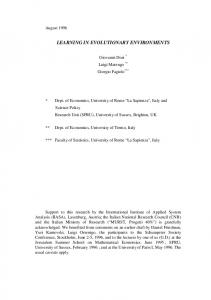
(70, black, yes) Fig. 1.
Labelled dataset with one continuous and one discrete attribute.
where the mapping is one–to–one. But instead of mapping real values to real values, we will map natural numbers to real
midpoints among two consecutive values of an attribute. This
intervals. For continuous domains the intervals can precisely
idea might be used to encode an individual of the genetic
define a range of values within the domain. With this solution
population so that only hypothetically good values will be
the size of the search space is finite and therefore the number
allowed as conditions over an attribute in the rules. In a
of schemes as well. However, this search space reduction
similar way, Bonissone et al. show in [24] some real-world
requires a prior discretization of continuous attributes, so the
applications where the knowledge of the problem domain
choice of the discretization method is critical. This idea will
benefits the use of Evolutionary Algorithms.
be explained in detail in subsection IV-B.
To clarify this idea, we will use the dataset shown in
The approaches gathered in the bibliography, some of them
Figure 1, whose features are described in Section I. Observing
based on Evolutionary Strategies, use real coding for machine
the attribute weight (the first one), C4.5 would investigate
learning tasks [19] or for multiobjective problems [20]. In
as possible values: 56, 58, 59.5, 61, 63, 66 and 69. In
SIA [21], real coding is applied to a real world data analysis
other words, C4.5 is applying a local unsupervised method
task in a complex domain. Finally, a combination of binary
of discretization [26] since the class label is not taken into
and real coding is used in [22], in order to benefit from the
account in this process. The reduction of the number of values
advantages of both codings by using the binary approach in
is only determined by the number of equal values for the
discrete domains and real coding for continuous attributes.
attribute being considered. This unsupervised discretization is
Fuzzy coding is another alternative for representing a chromosome. Every attribute consists of a fuzzy set and a set of
not a good choice to analyze possible limit values (either using entropy or any other criterion) for the intervals [27].
degrees of membership to each fuzzy set [23]. Some other
A number of remarkable supervised discretization methods
encoding strategies have been used in EAs. These include
have been included in the bibliography, including Holte’s 1R
trees, matrix encodings, permutation encodings and structured
[28] and the method of Fayyad and Irani [29]. In [30] a su-
heterogeneous encodings to name a few.
pervised discretization method, named USD (Unparametrized Supervised Discretization) is presented. This method is very
III. M OTIVATION
similar to 1R, although it does not need any input parameter.
The main shortcoming of using real coding to produce
However, as the aim of this method is not to find intervals
decision rules is that any value in the range of the attribute
but cutpoints to be used as limits of further decision rules,
could be use as lower or upper bound of the interval for
we assume that any supervised discretization method would
that attribute condition. For example, the C4.5 tool [25] only
be appropriate for this purpose. As we will see below, if the
takes as possible values for the nodes of the decision trees the
discretization method produces k cutpoints then there will be
IEEE TRANSACTIONS ON EVOLUTIONARY COMPUTATION
k ∗ (k − 1)/2 possible intervals for the decision rules.
5
Through the text, we will use a very simple dataset in order
Our goal consists in observing the class along with the dis-
to explain the application of the genetic operators. This dataset
cretization method and decreasing the alphabet size. Following
(see Figure 1) has a continuous attribute (weight in kilograms)
the example in Figure 1, we can note that it is only necessary
with range [55,70], a discrete attribute (eye–color) with values
to investigate the values 56, 61, 63 and 66, because they are
{black,green,blue}, and a class (she/he is a candidate to have
values which produce a change of class. Therefore, this coding
a paper accepted in a relevant conference) with values {yes,
allows the use of all the possible intervals defined by every
no}. Although the semantics of the natural coding have not
pair of cutpoints obtained by means of discretization, together
yet been detailed, Figure 2 illustrates the length of natural
with the feature range bounds.
versus hybrid representations. It shows two individuals that
In short, if we are able to encode every possible interval and every possible combination of discrete values in such a
represent the same rule. The method to encode these values will be shown later.
way that the genetic operators make an efficient search of
Hybrid coding represents a rule comprising the union of two
potential solutions, then the proposed representation will be
types of genotypes: real coding for the continuous attributes
appropriate for our purpose. Next, we are going to present
and binary coding for the discrete ones. Each condition associ-
and discuss this new encoding method, which will disclose
ated to a continuous attribute is encoded by two real numbers
interesting properties.
representing the bounds of the interval for that attribute. Each
The natural coding leads to a reduction of the search space
condition related to a discrete feature is encoded by a vector
size, which has a positive influence on the convergence of the
of binary values. The size of this vector is equal to the number
EA with respect to the hybrid coding (H IDER, HIerarchical
of distinct values of the attribute, so that 1 means that attribute
DEcision Rules, [22]). The prediction accuracy is maintained
value is present in the condition, and 0, absent. For instance,
while the number of rules is decreased, therefore using less
the rule in Figure 2 is encoded by using the hybrid coding
computational resources.
(left). The main problem of this encoding is that the search space
IV. NATURAL C ODING
is very large, since for each continuous feature we have to find
In this section we propose a new encoding for EAs in
two values in the range of the attribute. Another drawback
order to find decision rules in the context of supervised
is the length of the individuals, which might be very large
learning, together with their genetic operators, which will
when the discrete attributes take many distinct values. Our
be presented in two independent subsections: discrete and
proposal tries to minimize the search space size and the length
continuous features, respectively. This coding has been named
of the individuals by assigning only one natural number to
“natural” because it only uses natural numbers to represent the
each condition regardless of the type of the attributes. Thus, we
set of intervals for continuous features and the set of values
attempt to limit the search space of valid genotypes and reduce
for discrete ones, which might take part in the decision rules.
the length of the individuals. When the attributes are discrete,
Regarding the properties mentioned in Section I, natural
this natural number is the conversion of the aforementioned
coding is complete, non–redundant and informed. The internal
binary string from the hybrid coding into a decimal number.
redundancy and degeneracy properties are especially taken into
For continuous features, the natural number is obtained by
account to perform an effective search for solutions. Moreover
numbering all the possible intervals the condition can represent
it is coherent, unique, simple, consistent and minimal. Locality
in an effective manner. In Figure 2 a rule is encoded by the
is also satisfied as small variations of the natural numbers cor-
natural encoding (right), in contrast with the hybrid encoding
respond to small modifications of the intervals they represent.
(left). In this genotype, the meaning of 8 is the number
IEEE TRANSACTIONS ON EVOLUTIONARY COMPUTATION
6
assigned to the interval [56, 63] in the set of all valid intervals
In the following discussions, we will assume that a discrete
for AT1 , and the number 5 is the integer that represents the
feature is encoded by a single natural number (one gene) and
binary string 101 for AT2 .
we will analyze how to apply the crossover and mutation
We can note that the natural coding is simpler, since the
operators such that the new values retain the meaning that
hybrid coding needs six genes to encode the rule whereas the
they would have had with a binary coding. The new value will
natural one encodes it with only three genes. In general, the
belong to the interval [0, 2|Ω| − 1], where |Ω| is the number
hybrid one uses two genes for continuous features and |Ωi | for
of different values of the attribute. With the natural coding
discrete ones, where |Ωi | is the number of different values that
for discrete attributes a reduction of the size of the search
the feature ai can take. The natural coding gets to minimize
space is not obtained by itself, but the individuals are better
the size of individuals, assigning only one gene to each feature.
guided through the search space to look for solutions when the
In general, to choose an encoding and a suitable set of
specifically designed “natural genetic operators” are applied.
genetic operators is not an easy task. An unacceptable amount
The natural coding is obtained from a binary coding similar
of disruption can be introduced to the phenotype as a result of
to that used in GABIL and GIL. In decision rules, a condition
inappropriate design of genetic operators or the choice of the
can establish a set of discrete values that the feature must
encoding strategy. Sometimes degeneracy is seen as a benefi-
satisfy for an example to be classified. If a value is included
cial effect to incorporate additional information. However, it is
in the condition, its corresponding bit is equal to 1, otherwise
not always a positive phenomenon since the genetic operators
it is 0. The natural coding for this gene is the conversion
might not increase the level of diversity of the next generation.
of the binary number into a natural number. Table I shows
In this case, the implicit parallelism would also be reduced. As
an example for a discrete feature with three different values:
a norm, encodings should be designed to naturally suppress
black, green and blue.
redundant encoding forms, and genetic operators should be
1) Natural mutation: Following the example in Table I,
implemented in such a way that redundant forms do not benefit
when a value is selected for mutation, for example 3 (011)
the operators.
= {green, blue}, there are three options: 111, 001 and 010, equivalent to the numbers 7, 1 and 2, respectively. Firstly,
A. Discrete features
we assign the natural number corresponding to each binary
Several systems exist that learn concepts (concept learners)
number. The mutation of each value would have to be some of
and use binary coding for discrete features. When the set of
the values shown in Table II. For example, possible mutations
attribute values has many different values, the length of the
of 0 are the values 1, 2 and 4.
individual is very high so that a reduction of the length might influence positively on speeding up the algorithm.
gene of an individual, then the natural mutation of the k th TABLE I
AT 1 (Continuous): [55, 70] AT 2 (Discrete): {black, green, blue}
Domains
Rule: If AT
[56, 63]
1
and AT
2
{black, blue}
Definition 1 (natural mutation): Let n be the value of a
C ODING FOR A DISCRETE ATTRIBUTE . Then
yes
Discrete values Natural Coding
Hybrid Coding 56
63
1
0
1
1 Class
AT 1
Fig. 2.
AT 2
Hybrid individual vs. Natural individual.
8 AT 1
5
1
AT 2 Class
Natural
black
green
blue
Coding
0
0
0
0
0
0
1
1
0
1
0
2
. . .
. . .
. . .
. . .
1
1
0
6
1
1
1
7
IEEE TRANSACTIONS ON EVOLUTIONARY COMPUTATION
7
TABLE II
δ
denoted as [M ut(Z)] , as follows:
M UTATION VALUES FOR DISCRETE ATTRIBUTES .
−significant +significant
0
1
2
3
4
5
6
7
1
0
3
2
5
4
7
6
2
3
0
1
6
7
4
5
4
5
6
7
0
1
2
3
0
=
1
=
[M ut(Z)] [M ut(Z)]
Z [
(z ∪ M ut(z))
z∈[M ut(Z)]
0
.. . δ
bit of n, denoted by mutk (n), is the natural number produced
[M ut(Z)]
[
=
z∈[M ut(Z)]
(z ∪ M ut(z))
(5)
δ−1
Definition 4 (natural crossover): Let ni and nj be the val-
by changing that k th bit. jnk ¡ ¢ mutk (n) = n + 2k−1 %2k + 2k k 2
ues of two genes from two individuals for the same feature. (3)
The gene of the offspring, Cross(ni , nj ), will be obtained
where k ∈ {1, 2, . . . , |Ω|}; |Ω| is the number of values of the
from the values belonging to the first non–empty intersection
attribute; mutk (n) are the possible mutated values from n; %
between the δ–order mutations. Let t ≥ 0, and Qt =
is the rest of the integer division; and b·c is the integer part.
[M ut(ni )] ∩ [M ut(nj )] , then
Example 1: For example, according to Table II, the possible mutation values for n = 5(101) will be 4, 7 y 1. ¥ ¦ mut1 (5) = (5 + 20 )%21 + 21 251 = 4 (100) mut2 (5) = (5 + 21 )%22 + 2
¥ 2
mut3 (5) = (5 + 22 )%23 + 23
¥
5 22 5 23
¦ ¦
t
t
© ª Cross(ni , nj ) = z ∈ Qt | ∀s ≥ 0, s < t, Qt 6= ∅, Qs = ∅ (6) Example 3: Let assume that we have the values 6(110) and 3(011). We include the current values into the mutation set
= 7 (111)
since the offspring could be similar to the parents. Thus,
= 1 (001)
It is worth to note that we do not need to know the binary values, as Equation 3 takes a natural number and provides its
6 mutates to {6, 7, 4, 2} and 3 mutates to {3, 2, 1, 7}. Both genes share 2(010) and 7(111), then any of them could be the offspring from 6 and 3. It is possible that the intersection is
natural mutations. Definition 2 (mutation set): Let n be the value of a gene, we define mutation set, M ut(n), as the set of all valid
same for both, 0*1). Example 4: Let assume that we have the worst case, the
mutations for a natural value. M ut(n) =
the parents (for example, for 1 and 3, as the schema is the
|Ω| [
values 1(001) and 6(110), which have no bits in common. mutk (n)
(4)
k=1
where mutk (n) is the natural mutation of the k th binary bit.
The intersection between the first two mutation set is empty. The process is shown next: [M ut({1})]0 = {1}
Example 2: From Example 1, M ut(5) = {4, 7, 1}.
[M ut({6})]0 = {6}
Note that every discrete feature value set represented by a
Then, Q0 = ∅
natural number can be mutated by using Equation 4, gener-
[M ut({1})]1 = {0, 1, 3, 5}
ating a set of natural numbers which represents new discrete
[M ut({6})]1 = {2, 4, 6, 7}
feature value sets. Therefore, binary values does not appear
Then, Q1 = ∅
in the population. As it is shown in Example 2, from the
[M ut({1})]2 = {0, 1, 2, 3, 4, 5, 7}
value 5 ({black,blue}), the possible values are 4 ({black}),
[M ut({6})]2 = {0, 2, 3, 4, 5, 6, 7}
7 ({black,green,blue}) and 1 ({blue}).
Therefore, Q2 6= ∅
2) Natural crossover: Definition 3 (δ–order mutation): Let Z be a set of natural numbers, let us define the j–order mutation, and it will be
Cross(1, 6) = {0, 2, 3, 4, 5, 7} The intersection will be {0, 2, 3, 4, 5, 7}, and any of them will be the valid offspring for Cross(1, 6).
IEEE TRANSACTIONS ON EVOLUTIONARY COMPUTATION
8
01010=10≡{red, blue} 01001= 9 ≡{red, black} 11 = 01011 = {red, blue, black}
01111=15≡{red, green, blue, black}
00011= 3 ≡{blue, black}
11011=27≡{white, red, blue, black}
10010=18≡{white, blue} 10001=17≡{white, black} 19 = 10011 = {white, blue, black}
10111=23≡{white, green, blue, black}
11011=27≡{white, red, blue, black} 00011= 3 ≡{blue, black}
M ut(11) = {10, 9, 15, 3, 27} M ut(19) = {18, 17, 23, 27, 3} Cross(11, 19) ∈ {M ut(11) Fig. 3.
S
{11}}
T
{M ut(19)
S
{19}} = {10, 9, 15, 3, 27, 11}
T
{18, 17, 23, 27, 3, 19} = {3, 27}
Example of mutation and crossover operators for a discrete attribute with five values {white,red,green,blue,black}.
Figure 3 shows a more explanatory example of the nat-
As the range of continuous attributes is infinite, it would
ural genetic operators for the discrete attribute with values
be interesting to reduce the search space size, as the compu-
{white,red,green,blue,black}. The gene encoded as 11 has the
tational cost should be lower. This reduction should not have
binary code 01011. The block on the right gives the possible
negative influence on the prediction accuracy of the solutions
mutations, where the changed bit is shown in bold. The gene
(decision rules) found by the EA. The first step therefore
encoded as 19 follows the same scheme. Therefore the set of
consists in diminishing the cardinality of the set of values
mutations of both 11 and 19 are {10, 9, 15, 3, 27} and {18,
of the attribute.
17, 23, 27, 3} respectively. The crossover between these two genes is taken from the set {3, 27}.
1) Reducing the cardinality: Firstly, we will analyze what intervals inside the range of the attribute tend to appear as intervals for a potential decision rule obtained from the natural
B. Continuous features Using binary encoding in continuous domains requires transformations from binary to real for every feature in order to apply the evaluation function. Moreover, when we convert binary into real, the precision might be affected. Ideally the mutation of the less significant bit of an attribute should include or exclude at least one example from the training set. The real coding seems more appropriate with real domains, simply because it is more natural to the domain. A number of
coding. As mentioned before, this task could be solved by any supervised discretization algorithm. In [27], it is carried out via an experimental evaluation of various discretization schemes in different evolutionary systems for inductive concept learning, where our tool with natural coding, named H IDER*, was also analysed. This study showed that H IDER* was robust for any discretization method (Table 2 in [27]), although USD [30] turned out to be the most stable discretizer used in that experiment (the last column in Table 4 of [27]).
authors have investigated non–binary EAs theoretically [31],
Once the vector indicating the boundaries for the intervals
[32], [33], [34], [35]. In this sense, each gene would be
is obtained (vector of cutpoints), we assign natural numbers
encoded with a float value. Two float values would be needed
to any possible combination, as shown in Table III.
to express the interval of a continuous feature.
Example 5: Let assume from the dataset in Figure 1 that
IEEE TRANSACTIONS ON EVOLUTIONARY COMPUTATION
9
TABLE III I NTERVALS CALCULATED FOR THE CONTINUOUS ATTRIBUTE WITH RANGE [55, 70]. T HE BOUNDARY POINTS ARE {55,56,61,63,66,70}. A
NATURAL
NUMBER IS ASSOCIATED WITH EVERY CORRECT INTERVAL .
Cutpoints
56
61
63
66
70
55
1 ≡ [55, 56]
2 ≡ [55, 61]
3 ≡ [55, 63]
4 ≡ [55, 66]
5 ≡ [55, 70]
56
-
7 ≡ [56, 61]
8 ≡ [56, 63]
9 ≡ [56, 66]
10 ≡ [56, 70]
61
-
-
13 ≡ [61, 63]
14 ≡ [61, 66]
15 ≡ [61, 70]
63
-
-
-
19 ≡ [63, 66]
20 ≡ [63, 70]
66
-
-
-
-
25 ≡ [66, 70]
the output of the discretization algorithm is the vector of
row(3) = 1
cutpoints {55, 56, 61, 63, 66, 70} for the attribute weight (note
Therefore, as we can see in Table III, 3 is in row 1 and
that the upper and lower bounds of the feature range are also
col(3) = 3
row(20) = 4
col(20) = 5
column 3, and 20 is in row 4 and column 5.
included: 55 and 70). We just need to observe the changes of
Definition 6 (boundaries): Let n be the value of the gene,
labels when the examples are ordered by the attribute weight
we name boundaries of n to those values from Table III that
(particular situations of this strategy are discussed in [30]).
limits the four possible shifts (one by direction): left, right,
The possible intervals to be generated from those values are
up and down, and they will be denoted as lef tb (left bound),
shown in Table III. Each interval is identified by a natural
rightb (right bound), upperb (upper bound) and lowerb (lower
number, for example, the interval [61, 66] will be referenced
bound), respectively, and they will be calculated as:
by the natural number 14. Table III shows 6 cutpoints, which can generate 15 possible
lef tb(n) = (k − 1)(row − 1) + row = k ∗ row − k + 1
intervals. The number of intervals defines the size of the
rightb(n) = (k − 1)row
alphabet for such attribute and depends on the number of cuts
upperb(n) = col
k, exactly |Ω| =
k (k−1) . 2
lowerb(n) = (k − 1)(col − 1) + col = k ∗ col − k + 1 (8)
In Table III a natural number (in bold), beginning by 1, from left to right and from top to bottom, is assigned to each
Example 7: The number 9 could reach up to 7 to the left,
interval. These “natural” numbers will help us to identify such
up to 10 to the right, up to 4 to the top and up to 19 to the
intervals later.
bottom (see Table III).
2) Transitions: Once the necessary number of cutpoints has been calculated, we know the elements of the new alphabet
lef tb(9) = 7
rightb(9) = 10
upperb(9) = 4
lowerb(9) = 19
Ω. From now, we will analyze the mutation and crossover
Definition 7 (shifts): The left, right, upper and lower ad-
operators for this encoding. Table III defines the new alphabet
jacent shifts for a value n will be obtained (if possible) as
{1,2,3,4,5,7,8,9,10,13,14,15,19,20,25}.
follows:
Definition 5 (row and column): Let n be the value of the gene, and let row and col be the row and the column,
lef t(n) = max(lef tb(n), n − 1)
respectively, where n is located in Table III. The way in which
right(n) = min(rightb(n), n + 1)
row and col are calculated is: (% is the remainder of the
upper(n) = max(upperb(n), n − k + 1)
integer division). ¥ n−1 ¦
lower(n) = min(lowerb(n), n + k − 1)
row(n) =
k−1
+1
col(n) = (n − 1)%(k − 1) + 1
Example 6: Let ni = 3 and nj = 20, and k=6. Then
(7)
(9)
We define horizontal and vertical shifts as all the possible shifts for a given row and column, respectively, including n
IEEE TRANSACTIONS ON EVOLUTIONARY COMPUTATION
10
obtained as follows: ¡¡
itself. hor(n) =
k−1 [
max(lef tb(n), (k − 1)(row(n) − 1) + i) (10)
Cross(ni , nj ) ∈
¢
¡
hor(ni ) ∩ ver(nj ) ∪ hor(nj ) ∩ ver(ni )
(13)
i=1
ver(n) =
k−1 [
¢¢
We can observe in Table III that the interesting values are in min(lowerb(n), (k − 1)(i − 1) + col(n)) (11)
i=1
Example 8: From Example 7, the adjacent shifts of 9 will be: lef t(9) = 8
values being crossed are placed. Only when the values ni and nj are located in the same row or column, the interval will be
right(9) = 10
inside the other. Example 10: Thus,
upper(9) = 4 lower(9) = 14 And the horizontal and vertical shifts of 9 will be: hor(9) = {7, 8, 9, 10}
the intersection between the row and the column where both
Cross(5, 14) ∈ (({1, 2, 3, 4, 5}∩{4, 9, 14, 19})∪ ({13, 14, 15} ∩
ver(9) = {4, 9, 14, 19}
3) Natural mutation: A mutation consists in selecting a near interval to the one that contains the value n. For example, observing Table III, if the number of cutpoints is k = 6, and n = 9, there are four possible mutations {4,8,10,14}; if n = 10, there are three possible mutations {5,9,15}; if n = 19, there are two possible mutations {14,20}; and finally, if n =
{5, 10, 15, 20, 25})), i.e., Cross(5, 14) ∈ {4, 15}.
The general case of crossover between two parents is illustrated in Figure 4. The possible offspring is formed by those numbers in the intersection between the row and the column of both parents. For example, the crossover between genes 5 and 14 (within squares) generates as offspring genes 4 and 15 (within circles). In Table III we can see that this offspring
25, there is only one possible mutation {20}. Definition 8 (natural mutation): Let n be the value of the
makes sense because it uses every boundary from the parents.
gene, the natural mutation of n, denoted by M ut(n), is any near value to n by using the shifts and distinct from n. M ut(n) ∈ {x | x ∈ (mov(n) − {n})}
V. A LGORITHM H IDER is a tool that produces a hierarchical set of rules
(12)
where mov(n) = lef t(n) ∪ right(n) ∪ upper(n) ∪ lower(n). Example 9: Thus, M ut(2) ∈ {{1, 2, 3, 7} − {2}}, i.e., M ut(2) ∈ {1, 3, 7}. Now, one out of the three values could be selected as mutation. When a gene encodes a continuous feature, the mutation consists in selecting an interval close to it. This is easy to see in Figure 4, which shows the same example as Table III. For example, gene 14 is the interval [61, 66] and it can be mutated into another interval belonging to the set {[56, 66], [61, 63],
[22]. When a new example is to be classified, the set of rules is sequentially evaluated according to the hierarchy. If the example does not fulfil a rule, the next one in the hierarchy order is evaluated. This process is repeated until the example matches every condition of a rule and it is classified with the class that such rule establishes. H IDER uses an EA to search for the best solutions. Since the aim is to obtain a set of decision rules, the population of the EA is formed by some possible solutions. Each genetic individual is a rule that evolves applying the mutation and
[61,70] and [63,66]} (genes 9, 13, 15 and 19). However, gene 5 can only be transformed into 4 and 10, because there are no
Cutpoints
genes above or to the right of it.
56 61
63 66 70
55
1
2
3
4
5
56
-
7
8
9
10
61
-
-
13
14
15
63
-
-
-
19
20
66
-
-
-
Mut(5)={4,10} Mut(14)={9, 13, 15,19}
4) Natural crossover: Given two parents, the crossover should ideally produce a valid offspring, sharing the genetic material of both parents.
-
25
Cross(5,14)={4,15} Parent Offspring Mutated gen
Definition 9 (natural crossover): The natural crossover between two values ni and nj , denoted by Cross(ni , nj ) is
Fig. 4.
Mutation and crossover for continuous attributes.
IEEE TRANSACTIONS ON EVOLUTIONARY COMPUTATION
11
crossover operators. In each generation, some individuals are
1
selected according to their goodness and they are included in the next population along with their offspring. The pseudocode of H IDER is shown in Figure 5. The main algorithm is a typical sequential covering method [36], where the function that produces each rule is an EA. Each call to this function (line 8) generates only one rule that is included in the final set of rules (line 9) and used to eliminate examples from the training data (line 10). The evolutionary function is started again with the reduced training data. This loop is repeated until the set of training data is empty (epf = 0) or a percentage of
Input: T: File of examples
3
Output: R: Set of rules
4
begin
The function EvoAlg has a set of examples as its input parameter. It returns a rule that is the best individual of the last generation. The initial population is built randomly by the function InitializePopulation. Some examples are randomly selected and individuals that cover such examples are generated. After initializing the population, the for–loop repeats
(Training file)
(Sorted set)
5
R := ∅
6
initialSize := |T |
7
while |T | > initialSize × epf
8
r:=EvoAlg(T)
9
R:=R ⊕ r
10 11
DeleteCoveredExamples(T,r) end while
12
end H IDER
13
Function EvoAlg (T: File of encoded-examples) ret(r: Rule)
14
begin
15
InitializePopulation(P)
16
For i:=1 to num generations
17
the training set has been already covered (epf ∈ (0,1]).
Procedure H IDER
2
Evaluate(P)
18
next P:=SelectTheBestOf(P)
19
next P:=next P+Replicate(P)
20
next P:=next P+Recombine(P)
21
P:=next P
22
end for
23
Evaluate(P)
24 25
Fig. 5.
return SelectTheBestOf(P) end EvoAlg
Pseudocode of H IDER.
the evolutionary process a number of times that is determined by the parameter num generations. In each iteration, the individuals of the population are evaluated according to a defined fitness function, thus each individual acquires a goodness (function Evaluate). The best individual of every generation is replicated to the next generation (elitism). Later, a set of individuals are selected through the roulette wheel method and replicated to the next generation. Finally, another
of examples belonging to the region defined by the rule r, which they do not have the same class; G(r) is the number of examples correctly classified by r; and coverage(r) gives the size proportion of the search space covered by the rule. A description about the coverage factor and its positive influence on the results can be found in [22].
set of individuals are recombined and the offspring is included in the next generation. The selection of these individuals is
A. Evaluation
also carried out by means of the roulette wheel method. Once
A very important aspect of our approach is that the examples
the loop finishes, the best individual of the last generation is
of the training file (dataset) are also encoded with natural
returned.
coding, so that each example of the dataset has the same
Equation 14 gives the fitness function (f (r)) used by
structure as a rule. If an attribute is continuous, the gene that
HIDER during the evaluation process. The greater the value,
represents it in an encoded example is the smallest interval
the better the individual is.
that includes the value of the attribute in such example. For example, according to Table III, if the attribute takes the value
f (r) = N − CE(r) + G(r) + coverage(r)
(14)
64, then the gene is 19, since the smallest interval that includes 64 is [63,66]. However, if the attribute takes the value 65,
where r is an individual; N is the number of examples
it will be encoded with the number 19 as well. This means
being processed; CE(r) is the class error, i.e. the number
that the original dataset is reduced before applying the EA,
IEEE TRANSACTIONS ON EVOLUTIONARY COMPUTATION
12
only associating a weight to each example. Thus, a gene
B. Length of individuals
that represents a continuous attribute can take only a natural
A set of datasets from the UCI Repository [37] has been
number belonging to the main diagonal of the coding table. For
chosen to run the experiments. In Table IV, the length of
discrete attributes, we will use Table I to encode the values of
individuals of the genetic population for the hybrid and natural
examples. For example, if the attribute takes the value “blue”,
coding are shown. The first and second columns are the
then the gene is 1. Thus, the example (64, blue, no) is encoded
dataset’s identifiers and names, respectively. The third shows
as (19, 1, 0) (see Figure 6).
the number of continuous attributes (NC), if any, for each
The encoding of examples is carried out to speed up the
dataset. Likewise, the next column gives the number of discrete
evaluation process, since to decode all of the rules in each
features (ND) along with the total number of different values
evaluation implies higher computational cost. For instance, let
in brackets (NV). The column labelled as “Hybrid” gives the
rk be the condition (encoded interval) that a rule establishes
length of individuals (number of genes) with hybrid coding.
for a continuous attribute k, and let ek be the encoded value
Finally, the last one shows the length of individuals encoded
that such attribute takes in an example. The row and column
with natural coding. These lengths were calculated easily from
of rk and ek are row(rk ), col(rk ), row(ek ) and col(ek ),
the third and fourth column. The hybrid coding uses two genes
respectively, in the coding table, and the value ek fulfils
to represent continuous attributes and a number k of genes for
the condition rk if “row(rk ) ≤ row(ek )” and “col(rk ) ≥
discrete ones, being k the number of different values of the
col(ek )”. Therefore, to know whether or not an example is
attribute. On the other hand, the natural coding uses only one
covered by a rule only consists in comparing four numbers. For
gene for each attribute, regardless of its type (continuous or
discrete attributes, the evaluation is even easier. A condition
discrete). Thus, the length for hybrid individuals is 2 × N C +
rk covers a discrete value ek (both encoded) if “rk & ek 6= 0”,
N V , whereas for natural individuals is N C + N V .
“&” being the binary conjunction operator.
As we can see, the natural coding decreases noticeably the
In short, an example e = (e1 , . . . , em , Ce ) is covered by a
length of individuals. On average, it obtains a reduction greater
rule r = (r1 , . . . , rm , Cr ) if for each feature k ∈ {1, . . . , m},
than 63% with respect to hybrid individuals, what also leads
the example value is covered by the rule value, cov(ek , rk ),
to a search space size reduction. However, the space size
where
reduction is not due to the length, but to the discretization of continuous attributes. Likewise, it is more natural (and as
( cov(ek , rk ) =
row(ek ) ≤ row(ek ) ∧ col(rk ) ≥ col(ek ) rk & ek 6= 0
if akitcontinuous will be shown later, more efficient as well) to associate one if ak discrete
gene with one attribute, independently of its type.
For example, in Figure 6 we can see that gene1 has the
The binary coding is not appropriate to address this task
value 10, so observing Table III, the values 7, 8, 9, 10, 13,
because the length of individuals is ridiculously large. For
14, 15, 19, 20 and 25 would correspond to intervals that are
instance, by using the Equation 2, the individual length for
inside the interval whose associated value is 10. For the gene2 ,
Iris and Cleveland datasets are 22 and 202, respectively. Taking
with value 5, the values 1, 4 and 5 would satisfy the binary
into account that the number of potential solutions would be
conjunction operation with the value 5.
222 or 2202 , clearly the pure binary coding should be ruled
Regarding the encoded examples, Figure 6 shows that
out.
different original examples are encoded to the same encoded example, for instance, (7,2,0) and (25,4,1). This makes faster the evaluation as the examples (7,2,0) and (25,4,1) would have weight equal to 2.
VI. E XPERIMENTS In order to show the quality of the natural coding, we have designed two kind of experiments. Firstly, the hybrid coding
IEEE TRANSACTIONS ON EVOLUTIONARY COMPUTATION
[56, 70] and AT
2
{black,blue} then Class = yes
Natural Coding Example
r : Individual 10
5
1
gene 1 gene 2 Class (AT 1) (AT 2)
gene 1: {7,8,9,10,13,14,15,19,20,25} gene 2: {1,4,5} 5
Fig. 6.
10
Original Dataset AT 1 AT 2 Class
Encoded Dataset AT 1 AT 2 Class
1
55
green
yes
1
2
1
2
57
green
no
7
2
0
3
59
black
no
7
4
0
4
60
green
no
7
2
0
5
62
black
yes
13
4
1
6
64
blue
no
19
1
0
7
68
black
yes
25
4
1
8
70
black
yes
25
4
1
Correctly Covered Classified
Evaluation
1
Natural Coding
Rule: IfAT
13
Example of evaluation.
is compared to the natural coding, to guarantee that the same
The values that represent the performance are the error
prediction accuracy can be achieved with less computational
rate (ER) and the number of rules (NR) obtained. ER is
cost. Secondly, the results of the natural coding, C4.5 and
the average number of misclassified examples expressed as
C4.5Rules are statistically analyzed, regarding the error rate
a percentage and NR is the average number of rules from the
and the number of rules, by using two sets of datasets. The
cross–validation. The algorithms were run on the same training
first set has 16 datasets with standard size and the second set
sets and the knowledge models tested using the same test sets,
has 5 large datasets, with several thousands of examples and
so the results were comparable.
the number of attributes ranging from 27 to 1558. A. Natural Coding versus Hybrid Coding H IDER and H IDER* have been run with a set of datasets from the UCI Repository. Both tools use the same EA, including the fitness function, although H IDER uses the hybrid coding, in the opposite of H IDER* that uses natural coding. Both were run with the same crossover and mutation parameters, but with different number of individuals and generations. Table V shows the parameters used in each case. These parameters have great influence on the computational cost, particularly the number of generations and the population size. Sixteen datasets are used in the experiments, some of which only contain continuous features, others only discrete features and the remainder include both types of features. Thus, we can compare the behaviour of natural and hybrid coding with both types of features. To measure the performance of each method, a 10–fold cross–validation was achieved with each dataset.
In Table VI, the first column shows the datasets used in the experiments; the next two columns give the ER and NR obtained, respectively, by H IDER with hybrid coding for each database. Likewise, the fourth and fifth columns give the ER an NR for H IDER* with natural coding. The last two columns show a measure of improvement for the error rate (²er ) and the number of rules (²nr ). The ²er coefficient has been calculated by dividing the error rate of H IDER by the corresponding error rate of H IDER*. The same operation has been carried out to obtain ²nr , but using number of rules for both tools. Finally, the last row shows the average results for each column. As we can observe, H IDER* does not attain to reduce the ER for 7 out of 16 datasets. Nevertheless, on average, it improves H IDER, although such improvement is very small (2%). As regards the number of rules, the results are more significant, since H IDER* obtains smaller number of rules in 12 out of 16 cases, with a average improvement of 55%. Although the results show that H IDER* has a better perfor-
IEEE TRANSACTIONS ON EVOLUTIONARY COMPUTATION
14
mance, we must not forget that those numbers were obtained
very important detail since such parameters could have been
using smaller number of generations and individuals of genetic
specifically set for each dataset and the results would have
population. In particular, H IDER* needed one third of the
been substantially better.
generations and less than than three fourths of the population
The performance of each tool has been measured by means
size invested by H IDER. This means that H IDER evaluated
of the error rate (ER) and the number of rules (NR) produced
30.000 individuals, in contrast with H IDER*, which only
by each method for the 16 datasets, in addition to the standard
evaluated 7.000, what represents 23% of the initial exploration.
deviation (σ) of each measurement. The ER is the average
Obviously, this reduction have an important influence on
number of misclassified examples expressed as a percentage
the computational cost. H IDER* needed 4.431 seconds (1
for the 10–fold cross–validation. Table VIII gives the results
hour and 14 minutes, approximately) to complete the 10–
obtained by H IDER*, C4.5 and C4.5Rules. The first column
fold cross–validation for the 16 datasets. Nevertheless, the
shows the databases used in the experiments. The next block
version with hybrid coding took 12.004 seconds (about 3
of two columns gives the error rate (ER±σ) and the number
hours and 20 minutes) in the same standard machine (1.6GHz
of rules (NR ±σ) obtained by H IDER*. The fourth and fifth
CPU, 1GbRAM) and for the same tests. Table VII gives
columns have the same meaning, in this case for C4.5. The
detailed time consumed on each dataset. Next to the dataset’s
next two columns (H IDER* vs. C4.5) show the results of the
identifiers (first column), the second and third columns show
statistical test with respect to ER and NR. The meaning of
the time in seconds taken by H IDER and H IDER*, respectively,
the symbols is as follows: “−” denotes that H IDER* obtains
to complete the 10 executions (training and test phases of
a result worse than C4.5; “+” denotes that H IDER* obtains
each fold of the cross–validation). The last column gives the
a result better than C4.5; and “•” means that the result is
percentage of time that H IDER* consumed with respect to
statistically significant (positive or negative). Eighth and ninth
H IDER, i.e., the third column divided by the second one and
columns show the ER and NR for C4.5Rules and the next two
multiplied by 100. Note that all these values are smaller than
columns the statistical significance of the comparison between
100%. This fact indicates that H IDER* was faster than H IDER
H IDER* and C4.5Rules.
for all of experiments. On average, H IDER*’s runtime was only 35% of the time taken by H IDER, about three times faster.
As Table VIII shows, both algorithms tie regarding the error rate, although C4.5 is significantly better in 2 out of 7 datasets. On the contrary, H IDER* obtains better error rate
B. H IDER* versus C4.5 and C4.5Rules
with statistical significance in one dataset. However, as regards
To show the quality of our approach, the results obtained by
the number of rules, H IDER* outperforms C4.5 for all the
H IDER* (natural coding) have been compared to that of C4.5
datasets, where the improvement is significant in 15 out of
and C4.5Rules. The same heterogenous subset of datasets from
16 datasets. The comparison between C4.5Rules and H IDER*
the UCI Repository, presented in Table IV, was used in the
is given next. We can observe that there is also a tie for
experiments. The cross–validated performance of each method
the error rates, although in two cases H IDER* outperforms
was measured (10–fold cross–validation with each dataset).
significantly C4.5Rules. For the number of rules, H IDER*
However, the fact that the results are comparable does not
improves C4.5Rules in 11 datasets, being significant in 10
make them significant. Thus, a statistical analysis was carried
cases. C4.5Rules provides smaller number of rules in 6 cases,
out and, more specifically, the Student’s t–Test of difference
of which only 3 are significant.
of means with a critical value α < 0.05.
On average (last row), H IDER* obtains 18.4% as error rate
The parameters of EA were initially set (see Table V)
and 6.4 rules. This is a considerable improvement against
and remained constant for all the experiments. This is a
C4.5, since its averaged error rate is very similar (18.7%), but
IEEE TRANSACTIONS ON EVOLUTIONARY COMPUTATION
15
TABLE VIII S TATISTICAL ANALYSIS OF RESULTS (S TUDENT ’ S T–T EST OF DIFFERENCE OF MEANS WITH A CRITICAL VALUE α < 0.05). S YMBOLS + AND − MEAN THAT
H IDER * IS BETTER OR WORSE , RESPECTIVELY. I F THE SYMBOL • APPEARS NEXT, THEN + OR − ARE STATISTICALLY SIGNIFICANT. H IDER*
C4.5
H IDER* vs. C4.5 NR± σ
C4.5Rules
H IDER* vs. C4.5Rules
DS
ER± σ
NR± σ
ER± σ
ER
NR
ER± σ
NR± σ
ER
BC
4.1±
2.0
2.0±
0.0
6.3±
3.0
22.9±
3.0
+
+•
4.9±
2.4
9.6±
1.1
+
NR +•
BU
37.3±11.4
4.2±
0.8
33.7±
9.3
29.7±
5.1
−
+•
32.0±
6.2
11.9±
2.2
−
+•
CL
25.3±10.5
5.9±
0.9
23.5±
7.0
38.3±
5.8
−
+•
25.9±14.7
12.2±
4.6
+
+•
GE
27.4±
3.9
8.0±
1.4
32.9±
4.3
204.2±
8.5
+•
+•
28.8±
3.1
6.2±
2.2
+
−
GL
35.2±
7.8
11.7±
1.6
30.8±11.4
25.8±
2.0
−
+•
18.5±
5.9
15.0±
2.8
−•
+•
HD
21.9±
8.8
4.3±
0.5
25.5±
5.1
33.5±
4.5
+
+•
20.7±
7.0
11.5±
2.0
−
+•
HE
16.7±11.0
3.7±
0.7
19.4±
7.0
15.5±
1.7
+
+•
16.9±
6.1
6.3±
3.6
+
+•
HC
20.0±
7.7
11.1±
1.9
19.0±
7.7
44.4±
3.8
−
+•
17.5±
8.2
5.0±
1.9
−
−•
IR
3.3±
4.7
3.2±
0.4
5.3±
6.9
5.7±
0.5
+
+•
4.7±
7.1
5.0±
0.0
+
+•
25.0±26.4
4.5±
0.9
30.0±21.9
5.2±
0.9
+
+
16.7±22.2
4.1±
0.3
−
−
LE
1.2±
0.6
3.5±
0.5
0.0±
0.0
17.6±
1.0
−•
+•
0.7±
2.3
17.9±
1.9
−
+•
PI
MU
25.7±
3.4
5.1±
0.7
26.1±
5.4
24.4±
8.1
+
+•
29.7±
3.8
8.3±
3.1
+
+•
VE
33.8±
7.4
19.7±
3.3
27.5±
3.6
74.8±10.0
−•
+•
57.6±14.7
4.1±
4.1
+•
−•
VO
4.4±
2.9
2.2±
0.4
6.2±
3.1
15.9±
3.0
+
+•
5.3±
3.7
7.5±
0.7
+
+•
WI
8.8±
4.2
5.6±
0.8
6.7±
7.8
6.5±
0.9
−
+•
6.7±
7.8
5.6±
0.7
−
−
4.0±
5.2
7.9±
0.9
10.9±
1.8
+
+•
29.8±20.7
6.3±
2.0
+•
−•
18.4±
7.4
6.4±
1.0
36.9±
3.8
19.7±
8.5±
2.1
ZO AVG.
7.0±10.6 18.7±
7.1
8.5
it generates a number of rules (36.9) six times greater than
real–time applications and in realms where the simplicity of
H IDER*. C4.5Rules obtains an error rate of 19.7% and 8.5
the model is a target.
rules on average. In summary, H IDER* reduces significantly the number of rules for most of the datasets used in the experiments without damaging the classification accuracy noticeably. Furthermore, C4.5 and C4.5Rules carry out a posterior pruning of the nodes and rules, i.e. they eliminate those rules that do not provide any benefit to the model. If H IDER* carries out such pruning, the number of rules would be even smaller without significant growth of the error rate, since the deleted rules are those that cover a very few examples with respect to the dataset size.
C. Experiments with High–Dimensional Datasets It has been shown in previous sections that H IDER* provides good performance in comparison to H IDER, C4.5 and C4.5Rules. However, although the datasets used in such experiments are common in this type of comparative analysis, they do not seem large enough for a thorough study. In this section, we present a set of experiments in order to show the performance of our approach with five high–dimensional datasets from the UCI Repository [37]. Specifically, the datasets chosen
As it was mentioned earlier, H IDER* needs 1 hour and 14
to run the experiments are illustrated in Table IX, where their
minutes to complete all the experiments. On the contrary, C4.5
characteristics are summarized. The first and second columns
took about 4 minutes only in the same machine. However,
are the dataset’s identifiers and names, respectively. The third
these results are not comparable, since C4.5 is a determinis-
column gives the size of the dataset as the number of examples
tic algorithm and H IDER* is an evolutionary algorithm that
(NE), whereas the fourth is the number of attributes (NA) for
applies a stochastic search to find the solutions. In spite of
each dataset.
the computational cost, the good outcomes obtained by our
H IDER*, C4.5 and C4.5Rules were run with these datasets
proposal indicate that H IDER* can be very useful in non–
by applying a 10–fold cross–validation. Nevertheless, the re-
IEEE TRANSACTIONS ON EVOLUTIONARY COMPUTATION
16
VII. C ONCLUSIONS
sults obtained by C4.5 are not comparable with those produced by the other classifiers. C4.5 produces models with a very low error rate, although with a complexity extremely greater than H IDER* or C4.5Rules. For instance, for the Musk dataset, C4.5 obtains an average of 118 rules for a error about 4%, whereas H IDER* and C4.5Rules obtain around 11% as error rate but only 11 rules, approximately. The case of the Splice dataset is even more meaningful, where C4.5 reduces the error rate half with respect to H IDER*, but with 253 rules on average, i.e., 37 times greater than the 7 rules produced by H IDER*. Although C4.5 reduces the error rate significantly, the size of the decision trees does them unintelligible. Table X gives the results obtained by H IDER* and C4.5Rules. The performance of each tool has been measured the same way than in previous experiments, i.e., by means of the error rate (ER) and the number of rules (NR). The statistical analysis was also carried out and the results are presented with the same symbols as in Table VIII. Since these datasets have a great number of attributes and the size is also large, some parameters of EA were changed with respect to those shown in Table V. In particular, the population size was set to 100 individuals and the number of generations to 300, as it was used previously in H IDER.
In this paper a new encoding method for evolutionary algorithms in supervised learning is presented. This method transforms every attribute domain into a natural number domain, for continuous and discrete attributes. The population will therefore has only natural numbers. The genetic operators (mutation and crossover) are defined as algebraic expressions in order to work efficiently with this new search space, and they use no conversions from the original feature domains to the natural number domains, but the evolutionary algorithm works from the beginning to the end with natural numbers. Another important advantage of H IDER * is that all the examples from the database are encoded into the search space, making the evaluation process very fast. The natural coding for EA–based decision rules generation is described and tested by using 10–fold cross–validation with 21 datasets from the UCI Repository (five of them very large). The quality of this coding has been tested by applying the same evolutionary learning tool with natural (H IDER *) and hybrid (H IDER) coding, also improving the computational cost. H IDER * has been compared to C4.5 and C4.5Rules in order to find statistical differences and the experimental results show an excellent performance, mainly with respect to the number of rules, maintaining the quality of the acquired
In general, H IDER* has a good performance. Regarding the
knowledge model.
error rate, H IDER* is better in 4 datasets, being significant in 2 cases. C4.5Rules obtains a relevant reduction of the error in one dataset (AD), although increasing slightly the number of rules. As regards the number of rules, H IDER* outperforms C4.5Rules in 4 datasets, all of them with statistical significance. On average, H IDER* reduces both measurements, the error rate (8.4% against 9.5%) and the number of rules (6.4
ACKNOWLEDGMENTS Authors are very grateful to the reviewers for helpful comments and constructive criticisms. The research was partially supported by the Spanish Research Agency CICYT under grant TIN2004–00159 and Junta de Andaluc´ıa (III Research Plan).
against 11.5). In some high–dimensional domains, it is extremely important to produce understandable models, with very few rules. H IDER* shows an excellent performance when the size and dimensionality of the dataset are high, mainly with respect to the complexity of the model.
R EFERENCES [1] D. B. Fogel, “Phenotypes, genotypes and operators in evolutionary computation,” Proceedings of the Second IEEE International Conference on Evolutionary Computation (ICEC’95), Perth, Australia, pp. 193–198, IEEE Press, New York, NY 10017-2394, 1995. [2] Winston, Artifial Intelligence, Addisson-Wesley, third edition, 1992.
IEEE TRANSACTIONS ON EVOLUTIONARY COMPUTATION
17
TABLE X R ESULTS WITH H IGH –D IMENSIONAL DATASETS . S TATISTICAL ANALYSIS OF RESULTS (S TUDENT ’ S T–T EST OF DIFFERENCE OF MEANS WITH A CRITICAL VALUE
α < 0.05). S YMBOLS + AND − MEAN THAT H IDER * IS BETTER OR WORSE , RESPECTIVELY. I F THE SYMBOL • APPEARS NEXT, THEN + OR
− ARE STATISTICALLY SIGNIFICANT.
H IDER*
C4.5Rules
DS
ER± σ
NR± σ
ER± σ
H IDER* vs. C4.5Rules
NR± σ
ER
NR
AD
5.2±
1.7
7.6±
4.2
3.1±
1.3
12.0±
3.5
−•
+•
KR
5.6±
1.4
3.3±
0.4
9.4±
1.8
8.4±
0.9
+•
+•
MK
11.4±
2.2
10.7±
1.4
11.7±
2.7
10.2±
9.7
+
−
SI
1.8±
0.6
3.0±
0.0
4.4±
1.7
3.7±
0.7
+•
+•
SP
17.9±
2.7
7.2±
1.1
18.8±
13.3
23.2±
23.5
+
+•
8.4±
1.7
6.4±
1.4
9.5±
4.2
11.5±
7.7
Average
[3] N. J. Radcliffe, “Genetic set recombination and its application to neural network topology optimisation,” Neural computing and applications, vol. 1, no. 1, pp. 67–90, 1993.
253–269, 2003. [16] F. Rothlauf and D. Goldberg, “Prufer numbers and genetic algorithms,”
[4] J. H. Holland, Adaptation in natural and artificial systems, Ph.D. thesis, University of Michigan, 1975. [5] K. A. DeJong, W. M. Spears, and D. F. Gordon,
binary encoding in genetic search,” Information Sciences, , no. 156, pp.
in PPSN, 2000, pp. 395–404. [17] J. A. Lozano and P. Larra˜naga, “Applying genetic algorithms to search
“Using genetic
algorithms for concept learning,” Machine Learning, vol. 1, no. 13, pp. 161–188, 1993. [6] C. Z. Janikow, “A knowledge-intensive genetic algorithm for supervised learning,” Machine Learning, vol. 1, no. 13, pp. 169–228, 1993.
for the best hierarchical clustering of a dataset,” Pattern Recognition Letters, vol. 20, no. 9, pp. 911–918, 1999. [18] F. Herrera, M. Lozano and J.L. Verdegay, “Tackling Real-Coded Genetic Algorithms: Operators and Tools for the Behaviour Analysis,” Artificial Intelligence Review, vol. 12, pp. 265–319, 1998.
[7] D.P. Greene and S.F. Smith, “Using Coverage as a Model Building
[19] L. J. Eshelman and J. D. Schaffer, “Real-coded genetic algorithms and
constraint in Learning Classifier Systems,” Evolutionary Computation,
interval-schemata,” Foundations of Genetic Algorithms-2, pp. 187–202,
vol. 2, no. 1, pp. 67–91, 1994.
1993.
[8] A. Giordana and F. Neri, “Search-intensive concept induction,” Evolutionary Computation Journal, vol. 3, no. 4, pp. 375–416, 1996.
[20] Kalyanmoy Deb and Amarendra Kumar, “Real-coded Genetic Algorithms with Simulated Binary Crossover: Studies on Multimodal and
[9] F. Neri and L. Saitta, “An analysis of the universal suffrage selection
Multiobjective Problems,” Complex Systems, vol. 9, pp. 431–454, 1995.
operator,” Evolutionary Computation Journal, vol. 4, no. 1, pp. 89–109,
[21] G. Venturini, “SIA: a supervised inductive algorithm with genetic search
1996. [10] J. Hekanaho, “GA-based rule enhancement concept learning,” Proceedings of Third International Conference on Knowledge Discovery and Data Mining, Newport Beach, CA, USA, pp. 183–186, 1997. [11] M.L. Raymer, W.F. Punch, E.D. Goodman, L.A. Kuhn, and A.K. Jain, “Dimensionality reduction using genetic algorithms,” IEEE Transactions on Evolutionary Computation, vol. 4, no. 2, pp. 164–171, 2000. [12] J. R. Cano, F. Herrera, and M. Lozano, “Using evolutionary algorithms
for learning attributes based concepts,” in Proceedings of European Conference on Machine Learning, 1993, pp. 281–296. [22] J. S. Aguilar-Ruiz, J.C. Riquelme, and M. Toro, “Evolutionary learning of hierarchical decision rules,” IEEE Transactions on Systems, Man and Cybernetics, Part B, vol. 33, no. 2, pp. 324–331, 2003. [23] Sanjay K. Sharma and George W. Irwing, “Fuzzy coding of genetic algorithms,” IEEE Transactions on Evolutionary Computation, vol. 7, no. 4, pp. 344–355, 2003.
as instance selection for data reduction in kdd: An experimental study,”
[24] P. P. Bonissone, R. Subbu, N. Eklund, and T. R. Kiehl, “Evolutionary
IEEE Transactions on Evolutionary Computation, vol. 7, no. 6, pp. 561–
algorithms + domain knowledge = real-world evolutionary computation,”
575, 2003.
IEEE Transactions on Evolutionary Computation, vol. 10, no. 3, pp. 256-
[13] R. Caruana and J.D. Schaffer, “Representation and hidden bias: gray versus binary codign for genetic algorithms,” in Proceedings of the International Conference on Machine Learning, 1988, pp. 153–161. [14] R. Caruana, J.D. Schaffer, and L.J. Eshelman, “Using multiple repre-
280, June 2006. [25] J. R. Quinlan, C4.5: Programs for machine learning, Morgan Kaufmann, San Mateo, California, 1993. [26] D. Dougherty, R. Kohavi, and M. Sahami, “Supervised and unsupervised
sentations to improve inductive bias: gray and binary coding for genetic
discretisation of continuous features,” in Machine Learning: Proceed-
algorithms,” in Proceedings of the International Conference on Machine
ings of the Twelvth International Conference, 1995.
Learning, 1989, pp. 375–378. [15] U. K. Chakraborty and C. Z. Janikow, “An analysis of gray versus
[27] J. S. Aguilar-Ruiz, J. Bacardit, and F. Divina, “Experimental evaluation of discretization schemes for rule induction,” in Genetic and Evolution-
IEEE TRANSACTIONS ON EVOLUTIONARY COMPUTATION
18
ary Computation – GECCO-2004, Seattle, US, June 2004, LNCS, pp.
´ S. Aguilar–Ruiz received the B.Sc. degree Jesus
828–839, Springer-Verlag.
in 1992, the M.Sc. degree in 1997, and the Ph.D.
[28] R. C. Holte, “Very simple classification rules perform well on most
degree in 2001, all in computer science, from the
commonly used datasets,” Machine learning, vol. 11, pp. 63–91, 1993.
University of Seville, Spain. He is an Associate
[29] U. M. Fayyad and K. B. Irani, “Multi-interval discretisation of con-
Professor in Computer Science at Pablo de Olavide
tinuous valued attributes for classification learning,” in Proceedings of
University, Seville, Spain. He has been member of
the Thirteenth International Joint Conference on Artificial Intelligence. 1993, Morgan Kaufmann.
the Programm Committee of several international conferences, and reviewer for relevant journals. His areas of research in-
[30] R. Gir´aldez, J.S. Aguilar-Ruiz, and J.C. Riquelme,
“Discretization
oriented to decision rules generation,” in Knowledge-Based Intelligent
terest include evolutionary computation, data mining and bioinformatics. http://www.upo.es/eps/aguilar.
Information Engineering Systems & Allied Technologies (KES’02). IOSPress, 2002, pp. 275–279. [31] J. Antonisse, “A new interpretation of schema notation that overturns the binary encoding constraint,” in Third International Conference on Genetic Algorithms. 1989, pp. 86–97, Morgan Kaufmann. [32] S. Bhattacharyya and G.J. Koehler, “An analysis of non–binary genetic algorithms with cardinality 2v ,” Complex Systems, vol. 8, pp. 227–256, 1994. [33] G.J. Koehler, S. Bhattacharyya, and M.D. Vose, “General cardinality genetic algorithms,” Evolutionary Computation, vol. 5, no. 4, pp. 439–
´ Gir´aldez received the B.Eng. degree in 1998, Raul
459, 1998.
the M.S.Eng. degree in 2000 and the Ph.D. in 2004,
[34] M.D. Vose and A.H. Wright, “The simple genetic algorithm and the
all in computer science, from the University of
walsh transform: Part i, theory,” Evolutionary Computation, vol. 6, no.
Seville, Spain. Doctoral dissertation award from the
3, pp. 253–273, 1998.
University of Seville. He is an Assistant Professor
[35] M.D. Vose and A.H. Wright, “The simple genetic algorithm and the
at Pablo de Olavide University, Seville, Spain. His
walsh transform: Part ii, the inverse,” Evolutionary Computation, vol.
areas of research interest include evolutionary algo-
6, no. 3, pp. 275–289, 1998.
rithms, knowledge discovery and bioinformatics. He has been member of the
[36] T. Mitchell, Machine Learning, McGraw Hill, 1997.
Programm Committee of several international conferences related to this areas
[37] C. Blake and E. K. Merz,
of research. http://www.upo.es/eps/giraldez.
“UCI repository of machine learning
databases,” 1998.
Jos´e C. Riquelme received the M.Sc. degree in Mathematics in 1986 and the Ph.D. degree in Computer Science in 1996. He is an Associate Professor at the University of Seville. He conducts research in genetic programming, feature selection and data mining. He has served as a member of the Program Committee of several conferences related to Evolutionary Computation. http://www.lsi.us.es/∼ riquelme.
IEEE TRANSACTIONS ON EVOLUTIONARY COMPUTATION
19
TABLE VI C OMPARING H IDER AND H IDER *. ER AND NR ARE THE ERROR RATE AND THE NUMBER OF RULES , RESPECTIVELY. ²er AND ²nr ARE THE
TABLE IV C OMPARING LENGTH OF H YBRID AND NATURAL I NDIVIDUALS . NC AND ND
IMPROVEMENT OF
ID
Dataset
BC
NV IS THE NUMBER OF DISCRETE VALUES .
NC
ND (NV)
BREAST CANCER
9
-
18
9
BU
BUPA LIVER DIS.
6
-
12
6
CL
CLEVELAND
6
7 (19)
31
13
GC
GERMAN CREDIT
7
13 (54)
68
20
GL
GLASS
9
-
18
9
HD
HEART DISEASE
13
-
26
13
HE
HEPATITIS
6
13 (26)
38
19
HC
HORSE COLIC
7
15 (55)
69
22
IR
IRIS
4
-
8
4
LE
LENSES
-
4 (9)
9
4
MU
MUSHROOMS
-
22 (117)
117
22
PI
PIMA INDIAN
8
-
16
8
VE
VEHICLE
18
-
36
18
VO
VOTE
-
16 (48)
48
16
WI
WINE
13
-
26
13
ZO
ZOO
-
16 (36)
36
16
6.6
6.6 (22.7)
36.0
13.2
AVERAGE
Hybrid
OVER
H IDER FOR THE ERROR RATE AND THE
NUMBER OF RULES , RESPECTIVELY.
ARE THE NUMBER OF CONTINUOUS AND DISCRETE FEATURES ,
RESPECTIVELY. I N BRACKETS ,
H IDER *
Natural
H IDER (hybrid)
H IDER* (natural)
Improvement
Dataset
ER
NR
ER
NR
²er
²nr
BC
4.3
2.6
4.1
2.0
1.05
1.30
BU
35.7
11.3
37.3
4.2
0.96
2.69
CL
20.5
7.9
25.3
5.9
0.81
1.34
GC
29.1
13.3
27.4
8.0
1.06
1.66
GL
29.4
19.0
35.2
11.7
0.84
1.62
HD
22.3
9.2
21.9
4.3
1.02
2.14
HE
19.4
4.5
16.7
3.7
1.16
1.22
HC
17.6
6.0
20.0
11.1
0.88
0.54
IR
3.3
4.8
3.3
3.2
1.00
1.50
LE
25.0
6.5
25.0
4.5
1.00
1.44
0.8
3.1
1.2
3.5
0.67
0.89
PI
25.9
16.6
25.7
5.1
1.01
3.25
VE
30.6
36.2
33.8
19.7
0.91
1.84
VO
6.4
4.0
4.4
2.2
1.45
1.82
WI
3.9
3.3
8.8
5.6
0.44
0.59
8.0
7.2
4.0
7.9
2.00
0.91
17.6
9.7
18.4
6.4
1.02
1.55
MU
ZO AVG.
TABLE VII C OMPARING THE RUNTIME ( IN SECONDS ) FOR H IDER AND H IDER *.
Dataset
TABLE V PARAMETERS OF H IDER ( HYBRID CODING )
AND
H IDER * ( NATURAL
CODING ).
Parameter
H IDER
H IDER*
H IDER (hybrid)
H IDER* (natural)
Percent
BC
133
39
29%
BU
160
26
16%
CL
222
73
33%
GE
1832
495
27%
GL
258
71
28%
HD
223
43
19%
HE
104
36
35%
HC
342
275
80%
Population Size
100
70
IR
21
6
29%
Number of Generations
300
100
LE
5
1
20%
Replication
20%
20%
MU
3778
2203
58%
Recombination
80%
80%
PI
736
95
13%
0.5
0.5
VE
3862
942
24%
1 kattributesk
1 kattributesk
VO
196
43
22%
WI
52
43
83%
ZO
80
40
Individual Mutation Probability Gene Mutation Probability
Average
50% 35.3%
IEEE TRANSACTIONS ON EVOLUTIONARY COMPUTATION
20
TABLE IX DATASETS ’ F EATURES . NE
AND
NA ARE THE SIZE ( NUMBER OF
EXAMPLES ), AND THE NUMBER OF FEATURES , RESPECTIVELY. COLUMN GIVES THE NUMBER OF CLASS LABELS .
ID
Database
NE
NA
Classes
AD
ADS
3279
1558
2
KR
KR-VS-KP
3196
36
2
MK
MUSK
6598
166
2
SI
SICK
3772
27
2
SP
SPLICE
3190
60
3
T HE LAST