13 Navigating Tomorrow’s Web: From Searching and Browsing to Visual Exploration MARIAN DÖRK, CAREY WILLIAMSON, and SHEELAGH CARPENDALE, University of Calgary
We propose a new way of navigating the Web using interactive information visualizations, and present encouraging results from a large-scale Web study of a visual exploration system. While the Web has become an immense, diverse information space, it has also evolved into a powerful software platform. We believe that the established interaction techniques of searching and browsing do not sufficiently utilize these advances, since information seekers have to transform their information needs into specific, text-based search queries resulting in mostly text-based lists of resources. In contrast, we foresee a new type of information seeking that is high-level and more engaging, by providing the information seeker with interactive visualizations that give graphical overviews and enable query formulation. Building on recent work on faceted navigation, information visualization, and exploratory search, we conceptualize this type of information navigation as visual exploration and evaluate a prototype Web-based system that implements it. We discuss the results of a large-scale, mixed-method Web study that provides a better understanding of the potential benefits of visual exploration on the Web, and its particular performance challenges. Categories and Subject Descriptors: H.3.3 [Information Storage and Retrieval]: Information Search and Retrieval—Information filtering; Search process; H.5.4 [Information Interfaces and Presentation]: Hypertext/Hypermedia—Navigation General Terms: Design, Human Factors, Performance Additional Key Words and Phrases: Information visualization, World Wide Web, information retrieval, exploratory search, faceted navigation, visual information seeking ACM Reference Format: Dörk, M., Williamson, C., and Carpendale, S. 2012. Navigating tomorrow’s web: From searching and browsing to visual exploration. ACM Trans. Web 6, 3, Article 13 (September 2012), 28 pages. DOI = 10.1145/10.1145/2344416.2344420 http://doi.acm.org/10.1145/10.1145/2344416.2344420
1. INTRODUCTION
Seeking information on the World Wide Web is an activity undertaken daily by millions of people around the world. This computer use is expanding into more and more aspects of our daily activities as we increasingly turn to the Web as a place for information, entertainment, and community. With broader uses of the Web, the spectrum of available Web resources has been expanding as well. At its beginning 20 years ago, the Web was a distributed information repository dominated by basic hypertext. Since then, it has become an ever growing and changing information space featuring diverse resources and rich links indicating social, semantic, and spatial relationships. This work was supported by SMART Technologies, Natural Sciences and Engineering Research Council of Canada (NSERC), and Alberta Innovates Technology Futures (AITF). Authors’ address: Department of Computer Science, University of Calgary, 2500 University Drive NW, Calgary AB T2N1N4, Canada. M. Dörk, email:
[email protected]; C. Williamson, email:
[email protected]; S. Carpendale, email:
[email protected]. Permission to make digital or hard copies of part or all of this work for personal or classroom use is granted without fee provided that copies are not made or distributed for profit or commercial advantage and that copies show this notice on the first page or initial screen of a display along with the full citation. Copyrights for components of this work owned by others than ACM must be honored. Abstracting with credit is permitted. To copy otherwise, to republish, to post on servers, to redistribute to lists, or to use any component of this work in other works requires prior specific permission and/or a fee. Permissions may be requested from Publications Dept., ACM, Inc., 2 Penn Plaza, Suite 701, New York, NY 10121-0701 USA, fax +1 (212) 869-0481, or
[email protected]. c 2012 ACM 1559-1131/2012/September-ART13 $15.00
DOI 10.1145/10.1145/2344416.2344420 http://doi.acm.org/10.1145/10.1145/2344416.2344420 ACM Transactions on the Web, Vol. 6, No. 3, Article 13, Publication date: September 2012.
13:2
M. Dörk et al.
Browsing and searching have been and still are the fundamental interaction techniques on the Web. Since the beginning of the Web, information seekers use Web search to find relevant resources and follow hyperlinks from one Web page to the next. With the ongoing evolution of search engines, Web users gain quicker access to much more content with improving control over what they can access. However, while the spectrum of resources continues to broaden, most developments in Web search unfolded in the back-end of search engines concerning the technical infrastructure and algorithms for crawling, indexing, and retrieving billions of Web resources. The appearance of the interfaces used for Web-based information seeking has been evolving at a much slower pace. The canonical search interface is still a text-based query box, followed by results that are typically broken up into paginated, textual lists. While this approach usually leads to some relevant resources, it lacks overviews of the information space. We see visual exploration as the next navigation technique on the Web, in addition to searching and browsing. Visual exploration involves the use of Web-based visualizations integrating visual overviews with interactive querying. It is well understood that information visualization can make large volumes of data more accessible through visual representation and interaction [Card et al. 1999]. Leveraging the predisposition of human cognition towards visual perception, visualizations can provide summarized views of information that can be more easily grasped by the viewer [Healey et al. 1996]. Drawing from visual information seeking in databases [Ahlberg and Shneiderman 1994] and faceted navigation along multiple categorizations [English et al. 2002], visual exploration is part of an ongoing evolution towards higher-level and more engaging ways of interacting with information spaces. For example, interactive geographic maps and tag clouds can be seen as the harbingers of visual exploration on the Web. As much as searching is tightly connected with browsing, we anticipate that visual exploration will be complementary to these existing navigation techniques. In this work, we develop the concept of visual exploration as a novel type of navigation combining the power of visualization with information seeking. So far, visualization is rarely deployed in the context of information seeking, which is why there is little evidence for its potential. The main research question behind this work is: What are the potential benefits and performance challenges of visual exploration? To answer this question, we conducted a large-scale, Web-based study using previously introduced visualization widgets (VisGets) that integrate graphical summarization with interactive query formulation [Dörk et al. 2008]. Based on a mixed-method approach, the results provide findings about the system’s performance, participants’ uses of the visualization interface, and their reaction to visual exploration. We discuss the implications for the design of visual exploration systems and challenges for further research. 2. BACKGROUND
The challenge of making sense of growing information spaces is not new. In fact, humans have struggled with information overload since the printing press [Rosenberg 2003]. More recently, we observe the emergence of interdisciplinary fields devoted to the study of information seeking and visualization in the context of digital information spaces, in particular the Web. 2.1. Understanding Web-based Information Seeking
According to the traditional model of information retrieval, the information seeker articulates their information need as a query, after which the system retrieves the best possible set of results [e.g., Baeza-Yates and Ribeiro-Neto 2011]. While the traditional model focuses on search queries and emphasizes the search system and its retrieval performance, there has been considerable research on information seeking behaviour highlighting the searcher’s motivations and needs. ACM Transactions on the Web, Vol. 6, No. 3, Article 13, Publication date: September 2012.
Navigating Tomorrow’s Web: From Searching and Browsing to Visual Exploration
13:3
Several human-centred models compare information seeking with our evolutionary heritage of gathering food. Bates [1989] characterizes online information seeking as berrypicking involving a variety of sources and tools. The metaphor of collecting food is extended with information foraging, during which the searcher weighs the cost of retrieving a given resource against the information value it suggests [Pirolli and Card 1995]. Based on a diary study on email, file, and Web search, orienteering describes an information seeking style that includes small situated steps toward a target, requiring less cognitive effort than explicit search, and providing a sense of orientation [Teevan et al. 2004]. These models of information seeking suggest an engaging and stimulating movement through information spaces, while current search interfaces rely on mostly textual, ranked lists. To study Web-based information seeking, a wide range of methodologies are possible. Early studies include surveys, field work, and lab experiments with data gathering methods such as query logs, observations, and interviews [Hsieh-Yee 2001]. Mixedmethod approaches allow the collection of both qualitative and quantitative data [Choo et al. 2000]. Tracking implicit measures such as mouse movement, dwell time, and text selections does not require active feedback from participants [Kelly and Teevan 2003]. It may be beneficial to ask participants to install customized Web clients that provide such additional tracking functionality [Catledge and Pitkow 1995; Kellar et al. 2007]. It has also been shown that implicit measures can be tracked without modifying the Web client [Atterer et al. 2006]. In order to study information seeking systems holistically it has been argued to integrate methods from information retrieval and information seeking research [Kelly et al. 2009]. Navigating hypertext consists of the complementary dyad of searching and browsing [Marchionini and Shneiderman 1988; Bates 1989; Choo et al. 2000]. Typically involving low-level navigation, the onus is on the information seeker to formulate queries and consider results to gain a sense of overview of the information space. This approach, however, becomes problematic as the number of sources increases, along with the volume of (possibly relevant) information. While keyword search and link browsing have been the dominant interaction techniques on the Web, there is a growing interest in going beyond the ‘10 blue links’ [Broder et al. 2010] and supporting more exploratory search [White et al. 2006; Marchionini 2006]. However, there are few techniques explicitly designed for exploratory search. One prominent exploratory search technique is faceted navigation. Faceted navigation interfaces provide the searcher with multiple content-oriented facets that can be navigated without having to enter queries [English et al. 2002]. Several studies show the benefits of faceted navigation, for example, for exploring photos [Yee et al. 2003] and a library catalog [Kules et al. 2009]. Visualizations can be integrated into faceted interfaces to represent distributions across facet values [e.g., Stefaner et al. 2008]. 2.2. Supporting Information Seeking with Visualization
Another approach for making information seeking more exploratory is using information visualization, which can be understood as “the use of computer-supported, interactive, visual representations of abstract data to amplify cognition” [Card et al. 1999, p.7]. Considerable research has been done to study how visualization can help information seekers to formulate queries and assess retrieved search results. Information workspaces were an early approach to exploring information in digital environments designed to optimize the cost structure of information seeking [Card et al. 1991]. Systems that followed this approach typically featured three-dimensional interfaces for focus+context views [Mackinlay et al. 1991], hierarchy and network visualizations [Robertson et al. 1991; Hendley et al. 1995; Hearst and Karadi 1997], and window or page layouts [Card et al. 1996]. These systems suggested novel ways of repACM Transactions on the Web, Vol. 6, No. 3, Article 13, Publication date: September 2012.
13:4
M. Dörk et al.
resenting information structures such as filesystems and hypertext links through 3D visualizations, however, the metadata or contents of a collection were not visualized. In order to represent several data dimensions and indicate relationships between them, multiple coordinated views integrate several visualizations into one interface [Baldonado et al. 2000]. Zooming into a specific region of one view updates the linked views accordingly [Buja et al. 1991]. Similarly, temporarily selecting items in one visualization highlights all corresponding items in the linked views. For example, geographic information can be explored in an interface where two linked visualizations are provided for spatial and conceptual domains [Cai 2001]. Coordinated views have not yet been utilized for Web-based information seeking. Previous research has explored the role of interactive visualizations for formulating queries primarily against offline databases. For example, dynamic queries provide interactive graphical elements acting as visual filters tightly coupled with visualizations [Ahlberg and Shneiderman 1994; Spence and Tweedie 1998]. It has been shown that interactive selections in an information visualization can be used to successively reduce data to subsets [Hofmann and Theus 1998; Theus 2002] and adjust visual representations of query terms [Spoerri 1993; Jones 1999]. These early attempts to utilize interactive visualization for formulating search queries have so far not been widely applied to Web-based information seeking. Besides query formulation, there has been considerable research on using information visualization for the display of search results. Result visualizations can be distinguished between preview and overview displays [Greene et al. 2000]. In order to help searchers assess the relevance of search results, small per-result visualizations can represent document-query similarities and document characteristics integrated into list or table layouts [e.g., Hearst 1995; Klein et al. 2002]. Results can also be displayed as enhanced visual previews that combine thumbnails with text snippets [Woodruff et al. 2001; Teevan et al. 2009]. Many visual search tools that are available on the Web1 focus almost entirely on the visual content of resources and display simple thumbnails, but rarely use visualization to provide enhanced previews or overviews. One approach to add higher-level visual overviews of search results is to utilize the layout. For example, result thumbnails can be positioned according to a visualization such as a bar chart, as demonstrated by the zoomable search interface PivotViewer2 . Overview visualizations can provide context for retrieved search results [Clarkson et al. 2009] and interactive access to whole document collections or result sets using spatialization methods, such as multi-dimensional scaling [Wise et al. 1995; Cribbin 2009]. Generating visual overviews of entire collections is still computationally expensive, especially for large information spaces, such as the Web. Recently there has been work at the intersection between faceted navigation and information visualization. For small collections and databases, novel visual interfaces integrate query formulation with result representation. For example, the FacetMap and FacetLens interfaces represent multiple interactive facets of personal information collections and databases [Smith et al. 2006; Lee et al. 2009]. The Elastic Lists technique also encodes the number of members per facet value using relative height per list item to represent content distribution across facets [Stefaner and Müller 2007; Stefaner et al. 2008]. These advances are very promising and hint at what we will describe later in this article as visual information exploration. So far there has not been any formal research on the performance of such systems and the benefits for Web-based information seeking.
1 For
example, oSkope: http://www.oskope.com/.
2 http://www.microsoft.com/silverlight/pivotviewer/
ACM Transactions on the Web, Vol. 6, No. 3, Article 13, Publication date: September 2012.
Navigating Tomorrow’s Web: From Searching and Browsing to Visual Exploration
13:5
2.3. Web-based Information Visualization
Since the beginning of the Web, not only have the range and number of resources been expanding, but also the possibilities for interactivity and graphics. However, until recently most visualization research focused on static data sources and local visualization logic. Since the Web is becoming a powerful medium for information visualization that can be utilized as both a data source and a delivery mechanism [Rohrer and Swing 1997], we are increasingly seeing information visualization running in Web browsers and representing Web data. At first, Web-based information visualization relied on browser extensions such as Flash and Java. Now, rich graphics and interactivity are becoming natively supported by current Web browsers as the HTML standard is maturing. Furthermore, we have seen a push towards asynchronous communication between browser and server logic, allowing for much larger information spaces to be explored [Garrett 2005]. We are seeing work on client-side libraries that support interactive visualizations in the Web browser [Huynh et al. 2007; Bostock and Heer 2009]. These and other advances of the Web as a platform have made Web-based visualization much more feasible. Enabling a responsive interface is still a significant challenge, especially when the data to be displayed is distributed across the Internet. While some research on this has been done (e.g., using preview and refinement phases for queries [Plaisant et al. 1999], or dividing data manipulation between client and server based on the complexity of the visualization [Wood et al. 1996]), it remains an open problem to ensure responsiveness and interactivity when large amounts of data are distributed over the Web. With information visualization moving onto the Web, a novel type of visualization practice is evolving that is targeted to support casual uses of information visualization [Pousman et al. 2007]. For example, Web-based visualizations of historic baby names [Wattenberg 2005] and emotions expressed in social media [Harris and Kamvar 2006] share a sense of playfulness and artistic appeal. Furthermore, visualizations are increasingly becoming part of Web communities where data and visualizations are shared and actively discussed [Viégas and Wattenberg 2007]. Another trend is that we see more and more data on the Web that are increasingly structured and semantically organized [Berners-Lee et al. 2001]. While this allows for more sophisticated queries against Web data [Berners-Lee et al. 2006], a particular problem is making this information easily accessible without requiring training or specific knowledge [Heath 2008]. A large portion of research on visualizing hypertext and semantic data focused on navigation hierarchies [Nation et al. 1997] and node-link diagrams [Reeve et al. 2006]. Large-scale information repositories, such as Wikipedia, can be transformed into semantic information repositories [Auer et al. 2007], which enable sophisticated queries, custom visualization creation [Chan et al. 2008], and automatic visualizations via schema matching [Cammarano et al. 2007]. Furthermore, RSS (Really Simple Syndication) feeds containing structured metadata can be explored with spatial and temporal filters [Chen et al. 2007]. However, these controls do not provide multi-dimensional visual overviews or multi-level granularities. Two visualization techniques that have become prevalent on the Web are tag clouds and geographic maps. A tag cloud is a simple technique that visualizes free-form keywords and their occurrences among shared resources such as bookmarks or photos. There have been suggestions to improve layout and drawing of tag clouds [HassanMontero and Herrero-Solana 2006; Kaser and Lemire 2007]. However, the simple alphabetically sorted tag cloud of differently sized keywords is probably the most widely used. Studies have shown that tag clouds support a range of information seeking tasks through different ways of formatting and positioning text [Rivadeneira et al. 2007]. Interestingly, tag clouds have become popular visualizations without any involvement
ACM Transactions on the Web, Vol. 6, No. 3, Article 13, Publication date: September 2012.
13:6
M. Dörk et al.
of the academic information visualization community [Viégas and Wattenberg 2008]. While tag clouds are often used to summarize topical aspects of Web resources, interactive geographic maps have become widely used to display geospatial aspects of shared resources. With the introduction of Google Maps and its Web-based API, Web developers were able to embed rich interactive maps into their applications and represent their resources on ‘slippery maps’. There has also been considerable work on combining geographic maps with tag clouds. Many Web resources feature both topical and geospatial aspects, which can then be explored using integrated displays that combine maps and tag clouds [Slingsby et al. 2007]. Furthermore, the co-occurrence of tags and GPS information in photos can be used to find representative tags that describe different regions of the world [Ahern et al. 2007]. 3. VISUAL EXPLORATION ON THE WEB
In this section, we describe visual exploration as an emerging approach to interacting with Web-based information spaces. Current advances around Web-based visualization and faceted navigation enable this novel type of information seeking that embraces the Web as both an information space and a visualization platform. 3.1. Searching and Browsing the Web
The Web is a collection of large information spaces with many diverse resources. The canonical interaction techniques for exploring Web resources (searching and browsing) require the information seeker to formulate and adjust search queries, evaluate retrieved documents, and navigate along multiple hyperlinks. There are fundamental limitations to this approach of information seeking: — Specific. Conventional Web search interfaces require the information seeker to transform a possibly vague information need into specific search terms. This can be problematic when the person is interested in learning about a new subject and cannot explicitly express the information need in words. — Low-level. Searching and browsing follow a bottom-up approach in which the information seeker engages in low-level tasks scanning result items and skimming individual Web pages. This approach does not scale well to very large information spaces like library catalogs, photo collections, or the Web itself. — Ranked. Search interfaces display results as ranked text snippets or thumbnails. The ranking criteria are typically unknown and only the tip of an iceberg is displayed. This approach works very well when the information seeker is looking for a specific resource, however, it is difficult to grasp the extent of an information space and get an overview of many resources. — Textual. While search queries are typically formulated in text form, most search interfaces also display results using textual snippets. With the integration of thumbnails and maps into Google’s search result listings, there are promising developments away from an over-emphasis of text. As information spaces are growing and changing, we need new exploration mechanisms in order to make better sense of them. Current technical trends suggest that it may now be more possible than ever to apply visualization to information seeking on the Web. Web-based information is becoming increasingly semantic, or can be turned into a more structured form, and today’s Web browsers allow for richer interaction and graphics without requiring specific browser plugins to be installed. Furthermore, more recent approaches blending information visualization and faceted navigation seem promising and need to be carried further forward. ACM Transactions on the Web, Vol. 6, No. 3, Article 13, Publication date: September 2012.
Navigating Tomorrow’s Web: From Searching and Browsing to Visual Exploration
13:7
3.2. Towards Visual Exploration
Exploring information on the Web today requires the information seeker to gradually develop a sense of orientation by entering search queries and following selected Web links. The idea behind visual information exploration is to combine interactive visualization with retrieval tools to support a new type of information seeking that is engaging, high-level, multi-faceted, and multi-modal: — Engaging. Information seekers can choose the way they interact with the information space. Interactive visualizations support direct manipulation of graphical elements as query constraints. As search queries are created and adjusted by using interactive visualizations, these same visualizations instantly reflect the current query integrating query refinement with information overview. — High-level. Visualizations summarize meaningful aspects of an information space providing high-level perspectives on the resources. Visual cues for rapid comprehension are designed to support the information seeker in surveying relevant items or possibly discovering interesting topics more easily. — Multi-faceted. With most resources on the Web featuring several data dimensions, visual exploration provides visual and interactive access to meaningful facets that can be regarded as complementary perspectives for navigating through a collection and viewing its resources. — Multi-modal. Depending on the information need, the searcher can choose how to express queries using visual and/or textual representations. If present, the visual exploration interface displays both textual and visual previews of resources as well as visual summaries of the information space or a subset thereof. To support visual information exploration, the relationship between the system and the information seeker should be complementary. This idea is related to the notion of human-computer symbiosis [Licklider 1960], which assigns low-level routines to computers and high-level activities to humans. In the case of visual information exploration, low-level tasks such as data aggregation and mapping are carried out by the system, in order to support the information seeker in higher-level cognitive tasks such as exploring, learning, and reasoning. 3.3. Multiple Human-oriented Facets
With visual information exploration, we shift away from system-oriented dimensions to human-oriented conceptual facets as the basis for visualization and information seeking. System-oriented dimensions are directly derived from storage and data structures, such as database fields, index terms, and directory hierarchies. Human-oriented facets refer to facets of an information space that are meaningful and significant to the information seeker. Human-oriented facets can be derived from low-level data dimensions available within the information space. For example, timestamps or geospatial tuples of latitude and longitude are low-level representations that can be converted into accessible conceptual representations, such as the publication date of a document or the country of origin of an author. We assume that information needs are easier to describe using facets that fit better with the mental models of information seekers. Database fields, link graphs, or hierarchies are system-oriented dimensions, but they do not adequately represent human information needs or the content of information sources. Web resources are unique in their inter-linked structure, but they have many more types of facets that cannot be sufficiently captured by link graphs alone. As an individual human-oriented facet is unlikely to suffice for visual exploration of an information space, a combination of multiple facets offers greater expressiveness, ACM Transactions on the Web, Vol. 6, No. 3, Article 13, Publication date: September 2012.
13:8
M. Dörk et al.
especially if they are relevant to the information seeker and suitable for the information space. A visual exploration system should therefore expose multiple humanoriented facets as interactive visualizations. 4. VISGETS: A WEB-BASED VISUAL EXPLORATION SYSTEM
To empirically investigate the concept of visual exploration, we use the previously introduced VisGets as a functional exemplar. Offering a faceted visualization interface, VisGets were designed to provide interactive and visual methods for formulating multi-dimensional queries against items in RSS feeds [Dörk et al. 2008]. In the following, we briefly summarize the functionality of the system.
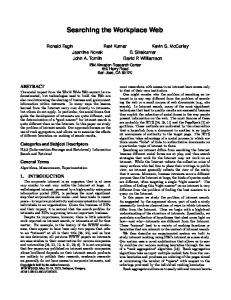
Fig. 1. The visual exploration interface includes a data collection chooser, three visualization widgets (VisGets), a textual search query box, and the current set of results. Complex queries can be specified by interacting with sliders, a geographic map, and a tag cloud; here the parameters are set to late May 2010, Central America, and ‘politics’. By hovering over an element, other related elements are highlighted; here the mouse pointer hovers over a cluster near Cuba highlighting results, certain days of the month, and related tags such as ‘internationalrelations’ and ‘law’.
The VisGets interface provides three interactive visualizations representing resource distributions along time, location, and tags (see Figure 1). An individual VisGet is a visualization widget that combines visual aggregation with interactive query formulation along a particular dimension. It can be thought of as an interactive lens on a particular facet of the information space. Query parameters can be interactively changed within a VisGet through direct manipulation with a mouse pointer. The visual elements that enable interaction are either embedded into the visualization or provided as associated controls. In addition, a conventional text search can complement a visual search. While an individual visualization represents one aspect of an information space, several coordinated visualizations provide multi-faceted access to the data. Setting and changing query parameters in multiple visualizations allows the interactive formulation of multi-dimensional queries. Furthermore, VisGets provide weighted brushing, a transient interaction technique that only requires hovering the mouse pointer over a visual element in any visualization. This causes related elements in the interface to ACM Transactions on the Web, Vol. 6, No. 3, Article 13, Publication date: September 2012.
Navigating Tomorrow’s Web: From Searching and Browsing to Visual Exploration
13:9
be highlighted. The degree of relatedness between the “brushed” element (where the mouse is currently hovering) and “linked” elements (related to the brushed element) is indicated by opacity. The darker the highlight is, the stronger the relationship is. For example, the tag ‘internationalrelations’ has a stronger relationship with the hovered location than ‘elections’ (see Figure 1). The information items that comply with the multi-dimensional query are displayed in the results area below the VisGets (Figure 1: bottom). While only a limited number of results can be displayed at once, the visualizations represent all results within the current constraints. As the information seeker interacts with the visualizations by changing query parameters, items are removed and added through animated transitions. Each result item constitutes a hyperlink to the actual information source. Hovering over a result item shows a preview of the resource. The architecture of the VisGets system is distributed between Web server and browser: presentation and interaction logic runs as JavaScript in the browser, while data-centric functionality is implemented in PHP on the server. The first iteration of the system [Dörk et al. 2008] situated aggregation logic on the client side, which implied that for any high-level overview of voluminous results, the browser needed to retrieve the facet information (time, location, tags) of all items being visualized. During casual use of the system, we observed intensive client-side processing and high bandwidth use on relatively large selections. It became apparent that the load distribution between client and server needed to be adjusted in order to support large information spaces. We have since re-designed the visualization logic so that the server primarily sends aggregate information to the browser, instead of requiring large data transfers. 5. WEB STUDY
To better understand the potential of visual exploration we undertook a large-scale, Web-based study that attracted 763 participants over a period of 16 weeks. The aim of our study was to empirically examine how people would use a visual exploration system, what their reaction would be to visualization-enabled search, and how the components of the system would operate. The main research questions are: What are the possible benefits and problems of visual exploration? How does a visual exploration system perform during use? In order to answer our research questions, we chose a mixed-method approach that relies on qualitative and quantitative data collection. It is not possible to provide generalizable, realistic, and precise findings with one method alone [McGrath 1995]. By utilizing multiple methods it was possible to learn about both human use and system performance as well as their interrelationships [Jick 1979]. This allows us to contextualize and disambiguate findings from one method by using another. Furthermore, we can explore correlations between different types of measurements. It was our intention to keep the study open-ended to get a more general sense of the potential of visual exploration. For this reason, we included a wide range of measurements and let participants provide unstructured feedback. Since visual exploration is still a relatively new area, we reasoned that an overly focused or comparative study would be less useful to learn about visual exploration, when it is not clear what important factors are. Instead, we see the study as an initial step to better understand visual exploration and identify future research challenges. In the following, we first describe the study setup and procedure, followed by details about the data collection and an overview of participants’ demographics and study sessions. As quantitative and qualitative data require different analytical methods, we discuss the analysis and results for the quantitative data separately from the analysis and results for the qualitative data. ACM Transactions on the Web, Vol. 6, No. 3, Article 13, Publication date: September 2012.
13:10
M. Dörk et al.
5.1. Setup and Procedure
The visual exploration system under study was hosted by our computer science department on shared Web and database servers.3 The study was publicized mostly by postings on mailing lists and Web sites that are related to visualization and Web research. For example, the study recruitment notice was featured on the popular visualization blog information aesthetics.4 Due to compatibility issues, only participants with recent Web browser versions of Mozilla Firefox, Apple Safari, and Google Chrome could participate. These were the browsers with the most consistent standard support at the time of the study. We did not include Microsoft Internet Explorer as it had several inconsistencies in the interface rendering. When an unsupported browser was detected, the index page of the study stated these requirements and displayed links to the three browser Web sites. There was no restriction on the operating system used by the participant. After indicating informed consent on a dedicated page, participants were guided through four main steps of the study. For each of the steps the interface displayed a link at the bottom of the screen, allowing participants to return or skip parts of the study. Participants could leave the study at any time by closing the window or navigating to another Web site. The four parts of the study are described in the following with the corresponding screenshots shown in Figures 2 and 3. (1) Questionnaire. The pre-study questionnaire sought voluntary information about the age, gender, and Web experience of participants. (2) Introduction. Some background information was provided about the Web-based dataset, with an invitation to freely explore the resources using the interface. (3) Interaction. The main part was the interaction with the visual exploration interface during which the quantitative performance measures were collected. (4) Feedback. The last step asked participants to provide free-form comments and suggestions. The interface displayed a confirmation dialog box when closing the window without leaving feedback. 5.2. Data Collection
In order to learn about the system performance and the end-user experience, both quantitative and qualitative data were collected. The quantitative measures were collected during interaction with the visual exploration interface, focusing on the usage and performance of the system. The post-study form allowed us to elicit unstructured feedback from participants as qualitative information. Performance measures. The quantitative measures collected by the visual exploration system were chosen in part to characterize system performance. These measures can be regarded as implicit as suggested by Atterer et al. [2006], since the data collection did not require explicit interaction by the participants beyond the use of the system. We focused on queries and query changes as basic interactions for which performance can be measured. When participants change query constraints in any of the visualizations, queries are initiated in the client and sent to the server, which generates the corresponding responses and returns them to the client. For this, the following system performance-related measurements are logged: — Message sizes of query responses, — Server-side processing time, and — Client-side waiting and processing time. 3 The exploration interface is still accessible at http://pages.cpsc.ucalgary.ca/~mdoerk/view, but with questionnaires removed and data collection disabled. 4 http://infosthetics.com/
ACM Transactions on the Web, Vol. 6, No. 3, Article 13, Publication date: September 2012.
Navigating Tomorrow’s Web: From Searching and Browsing to Visual Exploration
13:11
1) Questionnaire
2) Introduction
Fig. 2. After having indicated informed consent via the consent form, the participant is guided through a four-step process. The first two steps are a questionnaire and introductory information.
ACM Transactions on the Web, Vol. 6, No. 3, Article 13, Publication date: September 2012.
13:12
M. Dörk et al.
3) Interactive Session
4) Feedback
Fig. 3. During the main part of the study the participant uses the visual interface, after which they are asked to provide free-form feedback.
ACM Transactions on the Web, Vol. 6, No. 3, Article 13, Publication date: September 2012.
Navigating Tomorrow’s Web: From Searching and Browsing to Visual Exploration Client
Network
13:13
Server
Query initiated
Time
Network transit Server processing
Client waiting Network transit
Client processing Response rendered
Fig. 4. Client waiting, server processing, and client processing times were measured and logged by the system. Based on these times, the network transit times were estimated.
In prior work, it was shown that distributed hosts can introduce significant temporal inaccuracies, when system clocks are not synchronized [Paxson 1998]. However, for this study we mitigate the problem of time synchronization by using relative timestamps, with microsecond resolution whenever possible. For the order of queries, however, we use absolute times. It is possible to estimate the network transit time by subtracting the server processing time from the client waiting time (see Figure 4). The client processing and waiting times together constitute the total elapsed time between a query initiation and the rendering of the response. With these measures, we can study the delays contributed by client, server, and network. Application measures. In order to understand the system performance, we need to consider it in the context of the application behaviour. For capturing application behaviour, the following information was logged for each query modification: — Query strings (featuring query types and parameters), — Cookie strings, — Number of results corresponding to query (total, displayed, and new), — Number of visual marks representing dates, locations, and tags. Session cookies and per-query timestamps provide information to infer some measures about how many queries are issued per session and how much time elapsed between them. Using the query strings, we can determine what types of queries are issued, i. e., which visualization or control element was used to alter the query parameters. Both performance and application measures, except the client-side waiting and processing times, are measured by the server. To store the client-side measurements, they are ‘piggybacked’ on the following query message sent from the client to the server. This has the advantage that there are no additional logging messages confounding performance metrics. The downside, however, is that the client-side measures of the last query-response exchange cannot be captured. Feedback information. The free-form comments and suggestions from participants were stored with each session in the database. After the study concluded, a researcher applied a stepwise coding process that is discussed in detail in Section 5.5. 5.3. Study Overview: Demographics and Sessions
In order to give an overview of the study and participants, we provide general information about the collected data. The study was launched on March 29, and lasted until July 20, 2009, for a total duration of 16 weeks. The information collection that was preACM Transactions on the Web, Vol. 6, No. 3, Article 13, Publication date: September 2012.
200
300
268
100 77
29
Chrome
Other
0
99
Apr 15 May 2
May 26 Jun 17 Jul 17
Firefox
Study days
43
10
Linux
Other
0
200 100
10 5 2 Mar 29
442
400
500 400
558
300
100 20
50
M. Dörk et al.
1
Participants (log scale)
13:14
Safari
Windows
Web browsers
Mac OS
Operating systems
140 40 20
55 7
27
0
0
0
50
10
100
60
150
20
190
80
200
100
30
250
120
300
340
40
Fig. 5. The study was carried out over a period of 16 weeks (left). Participants used different Web browsers and operating systems (middle and right).
Beginner
Competent
Expert
Experience with the Web
18 24 30 36 42 48 54 60 66 72 78 84
Age
US
CA
DE
UK
FR
IT
NL
AU
ES
EU
Top 10 countries
Fig. 6. Based on the pre-study questionnaire, study participants were experienced Web users, their median age was 30 years, and most of them were from industrialized countries.
sented in the interface were blog articles from the Global Voices project.5 The collection was continually updated by the system, resulting in a growing dataset from 12,978 at the beginning to 16,150 articles at the end of the study. The temporal distribution of participation (see Figure 5, left), indicates higher activity during the first quarter of the study period. The spike of participants on April 8 was most likely caused by the posting on the blog information aesthetics,6 accounting for 184 (24.1%) study participants. As shown in Figure 5, middle and right, most study participants used Mozilla Firefox as their Web browser and Microsoft Windows as their operating system. Demographics. 763 people participated in this study. The pre-study questionnaire was filled out by most participants: Web experience was disclosed by 81.1%, gender by 72.0%, and age by 66.7% of the participants. Based on the information from the prestudy form, the sample population of this study can be described as technologicallyskilled, young adults from industrialized countries (see Figure 6). More than half of our participants self-classified themselves as Web experts, and the vast majority of the study participants considered themselves at least competent. Most participants were young adults (20-40 years) with a median age of 30 years. 79.2% of participants were male and 20.8% female. Using an IP lookup service7 we were able to determine the countries of 50.2% of the participants, which showed that the majority of participants were located in North America and Western Europe. 5 http://globalvoicesonline.org/ 6 http://infosthetics.com/archives/2009/04/participate_in_an_online_survey_visual_information_
exploration_on_the_web.html 7 http://www.hostip.info/
ACM Transactions on the Web, Vol. 6, No. 3, Article 13, Publication date: September 2012.
Navigating Tomorrow’s Web: From Searching and Browsing to Visual Exploration
13:15
Table I. Overview of study sessions and queries. Length of session (s) Queries per session Query interval (s)
Min. 0 1 0
Median 161.5 11 6.3
Mean 416.5 15.3 27.8
St. Dev. 768.3 13.9 145.8
Max. 6689 146 3599
Table II. Overview of performance measures. Sizes of server response (bytes) Server processing times (s) Client processing times (s) Network transit times (s) Total delays (s)
Min. 87 0 0 0 0
Median 2,742 0.28 0.46 0.71 1.65
Mean 11,032 0.65 0.70 1.01 2.35
St. Dev. 14,407 1.09 0.85 2.13 2.77
Max. 55,428 14.8 21.9 62.5 67.2
Sessions. During the study, we captured quantitative data about 9,012 queries, which we subdivided into 684 sessions using cookie strings as identifiers. A session represents an exploration period consisting of a participant’s successive interactions with the exploration system over a reasonable time duration. To distinguish between multiple sessions by the same participants, an idle time of one hour was chosen as a threshold. This way a query issued after an hour of inactivity was interpreted as the beginning of a new session by the same participant. Based on this method of subdividing sessions, we determined that 42 (6.8%) participants revisited the system, creating 105 additional sessions. Of all measured sessions, 94 (13.7%) sessions included only the initial default query, which means that the participant did not interact any further with the visual interface. The information that has been captured and calculated per session includes its duration, the number of queries issued, and the time elapsed between consecutive queries during a visit (see Table I). Based on the medians, a typical participant spent about 2.5 minutes with the system and issued 11 queries per visit. The mean values are considerably larger, as there were many participants that engaged with the system for much longer time periods even longer than an hour. In fact, there was an increased likelihood of feedback submission with longer lasting visits. Those participants that gave feedback spent on average 82% more time with the interface and submitted 93% more queries than the participants that did not leave feedback. 5.4. System Performance and Behaviour: Quantitative Data Analysis and Results
In the following, we present the quantitative data analysis and results, grouped by system performance, application behaviour, and correlations between those two. System performance. Table II summarizes the measurements of response sizes and processing times. As indicated by a median response size of less than 3 kilobytes, and a median total delay of less than 2 seconds, most queries resulted in relatively small and quick responses. Plots for the probability density functions (pdf) and cumulative distribution functions (CDF) for the response sizes and time delays are shown in Figure 7. The pdf for response sizes shows a sharp peak for very small response messages. In the CDF for response sizes, it is apparent that approximately two-thirds of the messages were below 10 kilobytes. The time delay distribution plots show that server and client processing delays were similarly short, while network transit times were slightly longer. Using the delays over all queries issued by participants, we can calculate how much client, server, and network delays have each added to the total time elapsed between query initiation and response generation (see Figure 4). Network transit (42.8%) contributed the most to the total time, while client (29.5%) and server (27.6%) processing times were approximately balanced. ACM Transactions on the Web, Vol. 6, No. 3, Article 13, Publication date: September 2012.
13:16
M. Dörk et al.
CDF
0.6
P(X ≤ x)
0.4 0.0
0e+00
0.2
2e−05
4e−05
density
6e−05
0.8
8e−05
1.0
pdf
10000 20000 30000 40000 50000
0
10000 20000 30000 40000 50000
x ~ Response sizes (bytes)
x ~ Response sizes (bytes)
pdf
CDF 1.0
0
0.8 0.6
P(X ≤ x)
0.4
Server processing Client processing Network transit
0.0
0.0
0.2
0.5
1.0
density
1.5
2.0
Server processing Client processing Network transit
0
2
4
6
8
10
0
2
x ~ Response times (s)
4
6
8
10
x ~ Response times (s)
Fig. 7. Probability density functions (left) and cumulative distribution functions (right) for response sizes (top) and response times (bottom) show that two thirds of the queries resulted in responses smaller than 10,000 bytes and faster than two seconds.
0
305 d
q
t
i
Query types
o
n
1.0 0.4
P(X ≤ x)
0.6
0.8
0.10
141
New results Displayed results
0.0
590
l
0.08 0.02
985
0.2
1316
New results Displayed results
0.06
2000 1000
1618
density
l = location d = dates q = text search t = tags i = initial query o = order/sorting n = refresh
CDF
0.04
4057
3000
4000
pdf
0
5
10
15
20
25
30
x ~ Results per query
35
0
5
10
15
20
25
30
35
x ~ Results per query
Fig. 8. Distribution of query types (left), and probability density function (middle) and cumulative distribution function (right) for number of results.
Application behaviour. A general overview of query types issued by study participants is shown in Figure 8, left. Most queries were issued using the location visualization; the next most popular types were date, text, and tag queries. Besides dimension or control types, we characterized queries also by the number of results and visual marks. Results were counted as total sum of results complying to the query, number of results displayed in the interface, and the newly loaded results. Visual marks are the ACM Transactions on the Web, Vol. 6, No. 3, Article 13, Publication date: September 2012.
Navigating Tomorrow’s Web: From Searching and Browsing to Visual Exploration
13:17
Table III. Overview of application measures. Min. 0 0 0 0
Total results Displayed results New results Visual marks
Median 6 6 0 21
Mean 731.5 14.5 9.3 33.7
St. Dev. 2518 15.6 13.3 32.8
1.0 0.8 0.6
P(X ≤ x)
0.4 0.2 0.0
density
CDF
0.000 0.005 0.010 0.015 0.020 0.025
pdf
Max. 15923 36 36 123
0
20
40
60
80
100
x ~ Visual marks per query
120
0
20
40
60
80
100
120
x ~ Visual marks
Fig. 9. Probability density function (left) and cumulative distribution function (right) for number of visual marks displayed for a given query.
sum of visual elements in the three visualizations representing all results complying to the query. A statistical overview of these measures per query is given in Table III. The large spread between median and mean results per query indicate that the majority of queries leads to small result sets, while there are some queries with many results. The pdf and CDF plots for number of results per query are shown in Figure 8, middle and right. The pdf plot of displayed and newly loaded results has peaks on both sides of the plot. The peak around the minimum shows that there were many queries with few or no results. In comparison to displayed results, the pdf for new results is slightly skewed towards the minimum, which is expected as newly loaded results cannot exceed the number of displayed results. To investigate why relatively many queries resulted in very small result sets, we took a closer look at the data. It turned out that 23% of queries led to zero results. In order to better understand the causes of empty selections we found that 47% of noresult queries were triggered using the map visualization and 36% by the text search. Considering that most study participants were located in North America and Western Europe, it could be that participants were trying to look for their own country or region. The fact that text search queries contributed to many empty selections reflects the specific and small information space—an observation to which we will return later. On the other extreme, we measured 30% of queries leading to more than 36 results, which was the maximum of results that the system displays at once in the results area of the interface. Result sets larger than that were explorable using pagination. The density plot for visual marks (see Figure 9, left) approximately resembles the aforementioned distribution for results, which is expected as the visual marks should roughly correlate with the number of results. Relating performance and application measures. We have applied Pearson correlation analyses to the performance measures (message sizes and delays) and application states (number of visual marks and results). This way we can explore the relationship between visualization (i. e., interface complexity) and system performance (i. e., bandwidth use and responsiveness). We expect larger response sizes and longer delays when there are more visual marks and results displayed. This is partially confirmed by ACM Transactions on the Web, Vol. 6, No. 3, Article 13, Publication date: September 2012.
13:18
M. Dörk et al.
Table IV. Correlation coefficients r(8809) with p < .001 for correlation analyses between performance and application measures. Response size Server processing time Client processing time Network transit time
Visual marks 0.927 0.420 0.421 0.061
Displayed results 0.886 0.359 0.416 0.053
New results 0.868 0.305 0.446 0.062
Total results 0.610 0.704 0.179 0.033
the correlation analysis (see Table IV). We found strong correlations between response size and the application measures, namely number of visual marks and results. With the exception of number of total results, the application measures were at least modestly correlated with server and client processing times. While the number of total results was strongly correlated with server processing, it was only weakly correlated with client processing time. As expected, the network transit time was not strongly correlated with any application measure. The relationships between performance and application measures are visualized using scatterplots in Figure 10. There are three particularly noteworthy graphs: (1) response sizes versus number of visual marks (top left), (2) response sizes versus total number of results (bottom left), and (3) server processing delays versus total number of results (bottom middle). First, the shape of the response sizes/visual marks plot suggests a non-linear relationship, which may be partially caused by the co-occurrence matrix that is transmitted with each query response to facilitate weighted brushing. With each additional mark, there is a new column and row in the brushing matrix, possibly contributing to growing response sizes. While the matrix was carefully designed to avoid redundancy, we did not anticipate this strong dependency, which is supported by the high correlation coefficient for response sizes and visual marks (see Table IV). Second, the response sizes/total results plot shows a steep growth until around 1000 results, where the plot starts to plateau. This shows that even when many results match a query, the response sizes are capped to a certain message size. Third, the server processing/total results plot exhibits linearity, suggesting that server-side processing is strongly correlated with total number of results. This observation is also reflected in the corresponding correlation coefficient in Table IV. 5.5. Participant Feedback: Qualitative Data Analysis and Results
In the following, we present the qualitative data analysis of participant feedback and the resulting findings. The goal of the qualitative part of the study was to gain insight into the end-users’ experience with the visual exploration interface, and their thoughts about it. In particular, we wanted to see whether participants perceive value in interactive visualization for information seeking. 195 (25.6%) participants provided feedback information after having used the visual exploration interface. In order to make sense of the free-form submissions and find interesting patterns, we have carried out a stepwise, bottom-up coding approach: (1) Read all comments and suggestions as a first pass to gain an overview of the participants’ feedback (167 comments and 140 suggestions). (2) Read all submissions again in a second pass to extract and associate codes that represent reoccurring patterns of observations, praise and critique, types of preferences, and suggestions for improvement (69 codes). (3) Develop common themes and topics based on the extracted codes (25 themes). (4) Categorize themes into the main types of feedback (4 categories). ACM Transactions on the Web, Vol. 6, No. 3, Article 13, Publication date: September 2012.
Navigating Tomorrow’s Web: From Searching and Browsing to Visual Exploration
13:19
Fig. 10. Scatterplots for performance measures (response sizes, and server and client processing) and application states (visual marks and results).
The resulting themes summarized in Table V provide an overview of the reactions and ideas guiding further investigation into visual exploration. General feedback. We have classified comments and suggestions according to their general tone to have an overall gauge of participants’ appreciation of the system. We found the majority of submissions to be positive (59%), while there was also negative (23%) and neutral (18%) feedback. This result does not provide specific insight, but it indicates general interest in visual exploration and its potential. The two most common observations made by participants can be attributed to the prototypical nature of our study system. Many of the participants that submitted feedACM Transactions on the Web, Vol. 6, No. 3, Article 13, Publication date: September 2012.
13:20
M. Dörk et al. Table V. Overview of common themes of comments and suggestions among participants’ feedback. Figures in brackets are the numbers of participants that shared the corresponding type of feedback. General feedback
Reactions to components
Usefulness and learning
Critique of interface
positive: mostly favourable statements (115) negative: mostly critical statements (44) neutral: ambiguous submission without critique or praise (36) specific or limited data set, interest in other data or for Web search (48) slow query updates (30) time visualization: positive (14), negative (12) map visualization: positive (20), negative (18) tag visualization: positive (13), negative (9) weighted brushing: positive (13), negative (8) dimension preference: favoured one or two dimensions over another (26) praised existence of multiple dimensions (22) suggested value or purpose (18) / questioned value or purpose (9) stated that it took a while to learn and understand interface (16) compared to conventional search as complement or alternative (15) noted ease and intuitiveness (13) results as squares hard to read; list view better (25) frozen interaction while loading problematic; suggesting delays (16) map too small, not detailed enough (15) improve time slider, e.g., sliding windows, last x days (14) interface too small; suggesting fluid layout (13)
back pointed out the limited data set for exploration and the slow performance of query responses. With regard to the limited data set, many participants (48) expressed significant interest in using visual exploration for general Web search and for data they are personally interested in. This can be interpreted as evidence of the potential usefulness that participants ascribe to visual exploration. “I would like to use this on other data sources such as flickr or blogs I am actually interested in. It would be great if I can connect it to blogs I have subscribed.” [P15] “I could use it for monitoring the new information for my research and to monitor ebay auctions that are appearing. I actually think it is a good idea.” [P123] “If it were more inclusive (of information available on the Web), so that any old search term would get a hit, then I think it would be very useful for drilling down to information.” [P375] While delays of about 2 seconds for query-responses appeared reasonably fast to us, several participants (30) identified the slowness of the system as a problem that would interrupt interactions. “Loading/reloading whenever I changed anything took a while though - felt cumbersome.” [P53] “It’s slow - I’m not sure if it’s because of my connection, or because of your system.” [P180] Reactions to components. We also found recurring comments on particular components of the interface, i. e., the three interactive visualizations and weighted brushing. While the majority of reactions towards interface components were positive, there were almost as many negative or critical responses. Interestingly, there were many feedback submissions (26) in which participants explicitly expressed a relatively strong preference for one or two dimensions while downplaying another, however, different participants had different preferences. ACM Transactions on the Web, Vol. 6, No. 3, Article 13, Publication date: September 2012.
Navigating Tomorrow’s Web: From Searching and Browsing to Visual Exploration
13:21
“geo- and time- search are awesome criteria, and generally much better in this visual format than in text boxes/drop downs” [P47] “I found the map really useful, the word cloud less so.” [P156] “I enjoy the contextual tagging as a mechanism for filtering as well as the date range filter - I did not find the locational system as useful.” [P247] Usefulness and learning. Possibly the most encouraging reactions from participants were about the potential usefulness of the visual exploration system and its learnability. Several feedback submissions (22) explicitly commended the presence of multiple dimensions for searching instead of just one: “I like the complete integration of all these channels of search.” [P61] “I liked how I could easily switch from locale to subject searching and how I could see then those interrelated.” [P564] “It’s very interesting to visualise a search with the tools that we already know and use, but together for once.” [P627] On more general terms, several feedback submissions (18) discussed the value or purpose of a visual exploration interface for particular types of information seeking: “The system seems a lot more useful as a tool for exploration than a tool for finding something specific.” [P155] “It could for instance be very useful for the search interface of a hotel booking system. The user would easily see when rooms are available, where they are clustered and what attributes the hotels have.” [P182] “This interface is resourceful for certain type of information need which I can’t explicitly describe.” [P572] There were also some feedback submissions (9) in which participants expressed doubt about the usefulness of a visual exploration interface: “I found myself clicking around at random and I can’t get a feel for how useful this would be in a real day-to-day task.” [P151] “I don’t see why anyone would want to take the trouble to use this, except for very random Web tourism.” [P472] “If I had a choice I would just browse news Websites.” [P658] Several participants (16) mentioned the effort and time required to get used to the interface and learn its functionalities: “It is not as intuitive as I thought it would be. It took me a bit to understand how to work it.” [P11] “it took me about 15 minutes to discover every feature of this rich interface. After that, it was a real pleasure to use” [P383] On the other hand, almost as many participants (13) emphasized the ease of using the visual exploration interface, for example: “Simple, doesn’t take too long to get familiar with it, even without instructions.” [P109] “very user friendly. It only takes a couple of mouse moves to get familiar with the engine” [P627] ACM Transactions on the Web, Vol. 6, No. 3, Article 13, Publication date: September 2012.
13:22
M. Dörk et al.
Critique of interface. The last category of themes that came up in the feedback submissions relates to the usability of the visual exploration interface. Most of these suggestions are typically straightforward to address and do not question the overall viability of visual exploration. Instead they provide opportunities for improvement of our particular interface. Several participants (25) mentioned that the tiled squares representing results made it hard to read titles. Some submissions suggested list views for better scanning. Another problem that was articulated several times (16), is the frozen state while the system is processing a query update—this observation is related to the aforementioned statements on slow query responses. Furthermore, participants suggested larger screen areas devoted to the map visualization (15) and the interface in general (13). Several submissions (14) proposed improvements for the time visualization, including the idea of sliding windows for the last x days. 6. DISCUSSION
The Web study gave us insight into the performance behaviour of a visual exploration system and feedback from information seekers. The quantitative results can be seen as initial achievements, yet also indicators of major challenges. The qualitative feedback provides context for our performance measures and a better understanding of the potential of visual exploration. In the following, we discuss the implications of our results and explore open challenges for research and design. 6.1. Rapid and Fluid Exploration
Response sizes were relatively small and primarily correlated with the number of elements displayed or changed in the interface. This indicates that having allocated the intensive data processing to the server and sending only aggregate data to the client helped limit bandwidth use. However, even with a median response time of less than 2 seconds per query change, many participants commented on the slowness of query responses, in particular, because further interaction was suspended during response generation. Considering that the median interval between queries was six seconds, this means participants spent about a third of their time waiting. A closer look revealed that the server-side delays were strongly correlated with the total number of results, which suggests that our current system does not yet scale well with regard to responsiveness on much larger collections. Rapid responsiveness. Being used to near-instantaneous results from conventional search engines, information seekers will similarly expect rapid responses from visual exploration systems. Conventional indexing approaches for information retrieval are based on text-based keywords, not on multiple facets represented as interactive, interlinked visualizations. Processing complex queries against large, dynamic information spaces in the shortest time possible requires more research on pre-computation methods and indexing schemes. Considering the substantial computational resources necessary to provide mostly textual result lists for Web search, it is apparent that generating multiple visualizations representing results of equally large information spaces can be considered a grand research challenge. Fluid interaction. The current design of our visual exploration system requires the information seeker to wait between queries, obviating further interaction with the system until the response has been processed. The feedback from participants suggests that this behaviour can be frustrating and that a non-blocking interaction would be preferable. Ideally, a visual exploration interface should always be ready to receive user input, with imperceptible processing delays. The question is how to achieve an always-ready, non-blocking interface when each interaction typically leads to some delay until changes to visual interface elements are finished. ACM Transactions on the Web, Vol. 6, No. 3, Article 13, Publication date: September 2012.
Navigating Tomorrow’s Web: From Searching and Browsing to Visual Exploration
13:23
6.2. Flexible and Diverse Facets
Many participants highlighted the value of some particular facets over others, and many praised the fact that the interface featured multiple facets. These observations support the idea of multi-faceted exploration, but also reveal that information seekers may have substantial preferences for certain facets. Participants also noted that it could be very useful to combine visual exploration with conventional Web search. While the studied version of the visual exploration system had a fixed number of facets and an inflexible layout of visualizations, these results suggest that future exploration interfaces need to provide higher levels of diversity and flexibility. Visualization diversity. In order to access a wide range of information spaces, and possibly even the Web as a whole, with a common visual exploration interface, a wealth of interactive visualizations have to be designed to represent all significant facets of the resources. The main requirements for a visualization are to visually summarize the resources along a facet and enable interactive query formulation. Interface flexibility. As information seekers’ preferences can vary greatly, visual exploration interfaces need to be designed with flexibility in mind. The interface could first suggest a set of visualizations most likely to be used with the given search query, but the information seeker should also be able to change the selection and size of the visualizations. Aggregating the choices of facets made by many information seekers could help improve the initial selections. 6.3. Suitable Application Areas
A considerable number of participants indicated that they were not interested in the blog articles displayed by the system, yet preferred exploring other information spaces that they were personally more interested in. Examples ranged between hotel bookings and academic literature review. From this the question arises, which application areas are suitable for visual exploration? Would visual exploration be useful for a wide range of information spaces and exploration tasks? Participants of our study mentioned a broad range of tasks and domains, such as exploring social media, professional documents, commercial products and services, and even general Web resources. While we can only speculate as to which of these application areas would actually benefit from visual exploration, we can approach this question from two angles: information tasks and resource types. Information tasks. We defined visual exploration as a high-level form of information seeking. In contrast to searching and browsing, visual exploration is not primarily aimed to access specific resources, but rather to see overviews of an information space. This distinction excludes focused information tasks such as locating a known resource (e.g., a specific book) or finding a simple fact (e.g., the outside temperature). Visual exploration is likely to be more useful for open-ended information tasks such as exploring what is trending in social media a given day, comparing products along several dimensions, or gaining an overview of a research area. The main distinction is the objective of the task. Searching and browsing aims for accessing individual resources, while visual exploration targets accessing information spaces at a higher level using interactive visualizations. Resource types. To determine whether visual exploration is suitable for a given information space, one has to examine the relevant aspects of the resources. To expose these aspects, a visual exploration interface relies either on well-structured metadata or robust content analysis. It might be easier to apply visual exploration to homogenous information spaces with resources that share the same data facets. For example, the bibliographic information associated with books typically has a high consistency including at least publication date, publisher, and subject headings. One could devise ACM Transactions on the Web, Vol. 6, No. 3, Article 13, Publication date: September 2012.
13:24
M. Dörk et al.
specific visual representations for these facets, but it is also possible to map them to more generic representations, such as the visualizations for time, location, and tags used in the study prototype. While these generic visualizations might not capture all data intricacies, they allow for integrated exploration of a range of resource types that have similar facets. Applying visual exploration to more heterogenous information spaces would require mechanisms that harmonize similar facets to coexist in the same visualizations. Furthermore, a subset of resources may share a very specific facet that may be irrelevant for the larger information space. For example, price does not make much sense for Web resources in general, but is an essential aspect of commercial products and services. A visual exploration system designed for diverse information spaces needs to support flexible mechanisms for choosing and changing facets and their visualizations. 6.4. Learning to Visually Explore Information
Study participants compared the interface with other search tools and suggested that it could be very useful for exploratory information seeking. However, the novelty of visual exploration in contrast to conventional search tools was apparent, with several participants highlighting the need to take some time to understand how the interface worked. We observed a prevalent information retrieval problem when going through the usage logs: 23% of queries triggered empty result sets. This suggests that a considerable number of participants had some problems using the interface to find resources or used the visualizations regardless of the number of returned results. Queries that led to no results were mostly initiated using the location visualization and text search, possibly due to the limited dataset of blog posts about non-Western regions. Supporting new visual explorers. While the concept of visual exploration can be seen as a continuation of previous related research, it is likely that many information seekers used to the search-and-browse paradigm need help in understanding and utilizing visual exploration for their needs. One way of introducing visual exploration to information seekers is to integrate interactive visualizations into conventional search-andbrowse interfaces, and provide optional gateways to visual exploration. For example, in a conventional search interface, interactive query visualizations could be suggested based on the initial search query submitted by the information seeker. Another way is to integrate help into the interface providing explanations of the different functionalities of a visual exploration interface. Avoiding empty result sets. Queries leading to no results can be discouraging and participants of this study produced many of them. Instead, visual exploration interfaces should help information seekers find relevant and interesting resources. One strength of faceted navigation interfaces is that empty results never occur, as only facet values that actually lead to results are displayed as links. The question is how a visual exploration interface would indicate that an interaction would not yield any results. 6.5. Studying Visual Exploration
The mixed methodology comprising both quantitative and qualitative data collection allowed us to relate different types of insight: the performance and potential of visual exploration systems. The measurements and logs provided a rich picture of system behaviour and performance, and the feedback from 195 participants was generally supportive and constructive. Compared to lab-based studies, we were able to record many more sessions. However, we noticed also a great variance in participation levels and session durations. In the following, we briefly discuss limitations of our study and the implications for future research. Limited population. Based on the questionnaire, our sample population is not representative of all Web users with regard to age, gender, origin, and background. While ACM Transactions on the Web, Vol. 6, No. 3, Article 13, Publication date: September 2012.
Navigating Tomorrow’s Web: From Searching and Browsing to Visual Exploration
13:25
this prevents us from making generalizable claims about visual exploration, we have significant evidence for its potential utility to some information seekers. Realistic tasks and relevant information. Many participants commented on the particular dataset, and suggested other information collections that are more relevant to them. These suggestions show that participants considered using visual exploration for personally relevant tasks and information. These suggestions also point at future studies to provide visual exploration interfaces for information spaces that are more relevant to the information seekers. It would be valuable to investigate the use of visual exploration in particular domains with realistic scenarios. Deeper understanding. With our study approach, we rely on logs recorded by the system and voluntary feedback from interested participants. Our understanding of the experience that participants have while using the system remains at a certain level. To gain a deeper understanding, we need to find ways to learn more about participants’ curiosity, satisfaction, and insight while using interactive visualizations for exploring information spaces. The question remains as to whether Web-based studies can be designed for this level of understanding, or whether observational lab studies with semi-structured interviews are more appropriate. 7. CONCLUSION
Searching and browsing have been the main techniques for seeking and navigating information resources on the Web. Over recent years the rise of interactive maps and tag clouds suggests the potential of visualization for information seeking. The main contribution of this work is a conceptual and empirical investigation into a new approach to interacting with large information spaces using interactive visualizations. Based on previous work on information seeking and visualization, we introduced the notion of visual exploration as a novel type of information seeking that uses interactive visualizations for query formulation and graphical overviews. Complementing the established navigation methods of searching and browsing, visual exploration continues the trend towards high-level and more engaging ways of navigating information on the Web. Using a Web-based visual exploration system providing three coordinated visualizations for visual overviews and query formulation, we carried out a large-scale Web study on the performance and benefits of visual exploration for information seeking on the Web. The results of this mixed-method Web study underline the potential of visual exploration as a new form of information seeking, and reveal difficult challenges for designing, engineering, and studying visual exploration systems. While the study results are very encouraging, more research is necessary to create highly responsive, flexible, and intuitive interfaces for visually exploring growing information spaces. ACKNOWLEDGMENTS The authors thank the anonymous reviewers for their constructive feedback. We would also like to thank the participants for taking part in the study.
REFERENCES A HERN, S., N AAMAN, M., N AIR , R., AND YANG, J. H.-I. 2007. World explorer: Visualizing aggregate data from unstructured text in geo-referenced collections. In JCDL ’07: Proceedings of the Joint Conference on Digital Libraries. ACM/IEEE, 1–10. A HLBERG, C. AND S HNEIDERMAN, B. 1994. Visual information seeking: Tight coupling of dynamic query filters with starfield displays. In CHI ’94: Proceedings of the SIGCHI Conference on Human Factors in Computing Systems. ACM, 313–317. A TTERER , R., W NUK , M., AND S CHMIDT, A. 2006. Knowing the user’s every move: user activity tracking for website usability evaluation and implicit interaction. In WWW 2006: World Wide Web Conference. ACM, 203–212.
ACM Transactions on the Web, Vol. 6, No. 3, Article 13, Publication date: September 2012.
13:26
M. Dörk et al.
AUER , S., B IZER , C., K OBILAROV, G., L EHMANN, J., C YGANIAK , R., AND I VES, Z. 2007. DBpedia: A nucleus for a web of open data. In International Semantic Web Conference. Semantic Web Science Association. B AEZA -YATES, R. AND R IBEIRO -N ETO, B. 2011. Modern Information Retrieval: the concepts and technology behind search 2nd Ed. Addison Wesley. B ALDONADO, M. Q. W., W OODRUFF , A., AND K UCHINSKY, A. 2000. Guidelines for using multiple views in information visualization. In AVI 2000: Advanced Visual Interfaces. ACM, 110–119. B ATES, M. J. 1989. The design of browsing and berrypicking techniques for the online search interface. Online Information Review 13, 5, 407–424. B ERNERS -L EE , T., C HEN, Y., C HILTON, L., C ONNOLLY, D., D HANARAJ, R., H OLLENBACH , J., L ERER , A., AND S HEETS, D. 2006. Tabulator: Exploring and analyzing linked data on the semantic web. In SWUI06: workshop on Semantic Web User Interaction. B ERNERS -L EE , T., H ENDLER , J., AND L ASSILA , O. 2001. The semantic web. Scientific American 284, 5, 28–37. B OSTOCK , M. AND H EER , J. 2009. Protovis: A graphical toolkit for visualization. TVCG: Transactions on Visualization and Computer Graphics 15, 6, 1121–1128. B RODER , A., C HURCHILL , E. F., H EARST, M., P ELL , B., R AGHAVAN, P., AND T OMKINS, A. 2010. Search is dead!: long live search (panel). In WWW 2010: World Wide Web Conference. ACM, 1337–1338. B UJA , A., M C D ONALD, J. A., M ICHALAK , J., AND S TUETZLE , W. 1991. Interactive data visualization using focusing and linking. In VIS ’91: conference on Visualization. IEEE, 156–163. C AI , G. 2001. GeoVIBE: A visual interface to geographic digital library. In Workshop on Visual Interfaces to Digital Libraries (at JCDL 2001). C AMMARANO, M., D ONG, X. L., C HAN, B., K LINGNER , J., T ALBOT, J., H ALEVY, A., AND H ANRAHAN, P. 2007. Visualization of heterogeneous data. TVCG: Transactions on Visualization and Computer Graphics 13, 6, 1200–1207. C ARD, S. K., M ACKINLAY, J. D., AND S HNEIDERMAN, B. 1999. Using Vision to Think. Morgan Kaufmann, Chapter 1: Information Visualization, 1–34. C ARD, S. K., R OBERTSON, G. G., AND M ACKINLAY, J. D. 1991. The information visualizer, an information workspace. In CHI ’91: Proceedings of the SIGCHI Conference on Human Factors in Computing Systems. ACM, 181–186. C ARD, S. K., R OBERTSON, G. G., AND Y ORK , W. 1996. The WebBook and the Web Forager: an information workspace for the world-wide web. In CHI ’96: Proceedings of the SIGCHI Conference on Human Factors in Computing Systems. ACM. C ATLEDGE , L. AND P ITKOW, J. 1995. Characterizing browsing strategies in the world-wide web. Computer Networks and ISDN systems 27, 6, 1065–1073. C HAN, B., W U, L., T ALBOT, J., C AMMARANO, M., AND H ANRAHAN, P. 2008. Vispedia: Interactive visual exploration of wikipedia data via search-based integration. TVCG: Transactions on Visualization and Computer Graphics 14, 6, 1213–1220. C HEN, Y.-F., FABBRIZIO, G. D., G IBBON, D., J ANA , R., J ORA , S., R ENGER , B., AND W EI , B. 2007. GeoTracker: geospatial and temporal rss navigation. In WWW 2007: World Wide Web Conference. ACM, 41–50. C HOO, C. W., D ETLOR , B., AND T URNBULL , D. 2000. Information seeking on the web: An integrated model of browsing and searching. First Monday 5, 2. C LARKSON, E. C., D ESAI , K., AND F OLEY, J. D. 2009. ResultMaps: Visualization for search interfaces. TVCG: Transactions on Visualization and Computer Graphics 15, 6, 1057–1064. C RIBBIN, T. 2009. Visualising the structure of document search results: A comparison of graph theoretic approaches. Information Visualization, 1473–8716. D ÖRK , M., C ARPENDALE , S., C OLLINS, C., AND W ILLIAMSON, C. 2008. VisGets: Coordinated visualizations for web-based information exploration and discovery. TVCG: Transactions on Visualization and Computer Graphics 14, 6, 1205–1212. E NGLISH , J., H EARST, M., S INHA , R., S WEARINGEN, K., AND Y EE , K.-P. 2002. Flexible search and navigation using faceted metadata. In SIGIR ’02: conference on Information Retrieval. 11–15. G ARRETT, J. J. 2005. Ajax: A new approach to web applications. http://www.adaptivepath.com/ideas/ ajax-new-approach-web-applications (Retrieved 2012-04-15). G REENE , S., M ARCHIONINI , G., P LAISANT, C., AND S HNEIDERMAN, B. 2000. Previews and overviews in digital libraries: designing surrogates to support visual information seeking. Journal of the American Society for Information Science 51, 4, 380–393. H ARRIS, J. AND K AMVAR , S. 2006. We Feel Fine. http://www.wefeelfine.org (Retrieved 2012-04-15).
ACM Transactions on the Web, Vol. 6, No. 3, Article 13, Publication date: September 2012.
Navigating Tomorrow’s Web: From Searching and Browsing to Visual Exploration
13:27
H ASSAN -M ONTERO, Y. AND H ERRERO -S OLANA , V. 2006. Improving tag-clouds as visual information retrieval interfaces. In InSciT2006: Proceedings of the International Conference on Multidisciplinary Information Sciences and Technologies. H EALEY, C. G., B OOTH , K. S., AND E NNS, J. T. 1996. High-speed visual estimation using preattentive processing. TOCHI: Transactions on Computer-Human Interaction 3, 2, 107–135. H EARST, M. A. 1995. TileBars: Visualization of term distribution information in full text information access. In CHI ’95: Proceedings of the SIGCHI Conference on Human Factors in Computing Systems. ACM, 59– 66. H EARST, M. A. AND K ARADI , C. 1997. Cat-a-cone: an interactive interface for specifying searches and viewing retrieval results using a large category hierarchy. In SIGIR ’97: conference on Information Retrieval. ACM, 246–255. H EATH , T. 2008. How will we interact with the web of data? IEEE Internet Computing 12, 5, 88 –91. H ENDLEY, R., D REW, N., W OOD, A., AND B EALE , R. 1995. Case study: Narcissus: visualising information. In InfoVis 1995: Symposium on Information Visualization. IEEE. H OFMANN, H. AND T HEUS, M. 1998. Selection sequences in MANET. Computational Statistics 13, 1, 77–88. H SIEH -Y EE , I. 2001. Research on web search behavior. Library & Information Science Research 23, 2, 167– 185. H UYNH , D. F., K ARGER , D. R., AND M ILLER , R. C. 2007. Exhibit: Lightweight structured data publishing. In WWW 2007: World Wide Web Conference. ACM, 737–746. J ICK , T. D. 1979. Mixing qualitative and quantitative methods: Triangulation in action. Administrative Science Quarterly 24, 4, 602–611. J ONES, S. 1999. VQuery: A graphical user interface for boolean query specification and dynamic result preview. In UIST 1999: Symposium on User Interface Software and Technology. ACM, 143–151. K ASER , O. AND L EMIRE , D. 2007. Tag-cloud drawing: Algorithms for cloud visualization. In Tagging and Metadata for Social Information Organization at WWW ’07. K ELLAR , M., WATTERS, C., AND S HEPHERD, M. 2007. A field study characterizing web-based informationseeking tasks. Journal of the American Society for Information Science and Technology 58, 7, 999–1018. K ELLY, D., D UMAIS, S., AND P EDERSEN, J. O. 2009. Evaluation challenges and directions for informationseeking support systems. Computer 42, 3, 60–66. K ELLY, D. AND T EEVAN, J. 2003. Implicit feedback for inferring user preference: A bibliography. In ACM SIGIR Forum. Vol. 37. ACM, 18–28. K LEIN, P., M ULLER , F., R EITERER , H., AND E IBL , M. 2002. Visual information retrieval with the SuperTable + scatterplot. In IV ’02: conference on Information Visualization. IEEE, 70–75. K ULES, B., C APRA , R., B ANTA , M., AND S IERRA , T. 2009. What do exploratory searchers look at in a faceted search interface? In JCDL ’09: Proceedings of the Joint Conference on Digital Libraries. ACM/IEEE, 313–322. L EE , B., S MITH , G., R OBERTSON, G. G., C ZERWINSKI , M., AND T AN, D. S. 2009. FacetLens: exposing trends and relationships to support sensemaking within faceted datasets. In CHI ’09: Proceedings of the SIGCHI Conference on Human Factors in Computing Systems. ACM, 1293–1302. L ICKLIDER , J. 1960. Man-computer symbiosis. IRE Transactions on Human Factors in Electronics HFE-1, 1, 4–11. M ACKINLAY, J. D., R OBERTSON, G. G., AND C ARD, S. K. 1991. The perspective wall: Detail and context smoothly integrated. In CHI ’91: Proceedings of the SIGCHI Conference on Human Factors in Computing Systems. 173–176. M ARCHIONINI , G. 2006. Exploratory search: From finding to understanding. Communications of the ACM 49, 4, 41–46. M ARCHIONINI , G. AND S HNEIDERMAN, B. 1988. Finding facts vs. browsing knowledge in hypertext systems. IEEE Computer 21, 1, 70–80. M C G RATH , J. E. 1995. Methodology matters: Doing research in the behavioral and social sciences. In Readings in Human Computer Interaction: Towards the Year 2000. Morgan Kaufmann, 152–169. N ATION, D., P LAISANT, C., M ARCHIONINI , G., AND K OMLODI , A. 1997. Visualizing websites using a hierarchical table of contents browser: WebTOC. In Proc. 3rd Conference on Human Factors and the Web. PAXSON, V. 1998. On calibrating measurements of packet transit times. In SIGMETRICS 1998: Proceedings of the ACM joint international conference on Measurement and modeling of computer systems. 11–21. P IROLLI , P. AND C ARD, S. K. 1995. Information foraging in information access environments. In CHI ’95: Proceedings of the SIGCHI Conference on Human Factors in Computing Systems. ACM, 51–58.
ACM Transactions on the Web, Vol. 6, No. 3, Article 13, Publication date: September 2012.
13:28
M. Dörk et al.
P LAISANT, C., S HNEIDERMAN, B., D OAN, K., AND B RUNS, T. 1999. Interface and data architecture for query preview in networked information systems. TOIS: Transactions on Information Systems 17, 3, 341. P OUSMAN, Z., S TASKO, J. T., AND M ATEAS, M. 2007. Casual information visualization: Depictions of data in everyday life. TVCG: Transactions on Visualization and Computer Graphics 13, 6, 1145–1152. R EEVE , L., H AN, H., AND C HEN, C. 2006. Visualizing the Semantic Web: XML-Based Internet and Information Visualization. Springer, Chapter Information Visualization and the Semantic Web, 19–44. R IVADENEIRA , A., G RUEN, D. M., M ULLER , M. J., AND M ILLEN, D. R. 2007. Getting our head in the clouds: Toward evaluation studies of tagclouds. In CHI ’07: Proceedings of the SIGCHI Conference on Human Factors in Computing Systems. ACM, 995–998. R OBERTSON, G. G., M ACKINLAY, J. D., AND C ARD, S. K. 1991. Cone trees: Animated 3d visualizations of hierarchical information. In CHI ’91: Proceedings of the SIGCHI Conference on Human Factors in Computing Systems. ACM, 189–194. R OHRER , R. M. AND S WING, E. 1997. Web-based information visualization. Computer Graphics and Applications 17, 4, 52–59. R OSENBERG, D. 2003. Early modern information overload. Journal of the History of Ideas 64, 1, 1–9. S LINGSBY, A., D YKES, J., W OOD, J., AND C LARKE , K. 2007. Interactive tag maps and tag clouds for the multiscale exploration of large spatio-temporal datasets. In IV ’07: International Conference on Information Visualisation. 497–504. S MITH , G., C ZERWINSKI , M., M EYERS, B., R OBBINS, D., R OBERTSON, G., AND T AN, D. S. 2006. Facetmap: A scalable search and browse visualization. TVCG: Transactions on Visualization and Computer Graphics 12, 5, 797–804. S PENCE , R. AND T WEEDIE , L. 1998. The attribute explorer: Information synthesis via exploration. Interacting with Computers 11, 2, 137–146. S POERRI , A. 1993. InfoCrystal: A visual tool for information retrieval. In VIS ’93: Conference on Visualization. IEEE, 150–157. S TEFANER , M. AND M ÜLLER , B. 2007. Elastic lists for facet browsers. In DEXA 2007: conference on Database and Expert Systems Application. IEEE, 217–221. S TEFANER , M., U RBAN, T., AND S EEFELDER , M. 2008. Elastic lists for facet browsing and resource analysis in the enterprise. In DEXA 2008: conference on Database and Expert Systems Application. IEEE, 397– 401. T EEVAN, J., A LVARADO, C., A CKERMAN, M., AND K ARGER , D. 2004. The perfect search engine is not enough: a study of orienteering behavior in directed search. In CHI ’04: Proceedings of the SIGCHI Conference on Human Factors in Computing Systems. ACM, 415–422. T EEVAN, J., C UTRELL , E., F ISHER , D., D RUCKER , S., R AMOS, G., A NDRÉ , P., AND H U, C. 2009. Visual snippets: summarizing web pages for search and revisitation. In CHI ’09: Proceedings of the SIGCHI Conference on Human Factors in Computing Systems. ACM, 2023–2032. T HEUS, M. 2002. Interactive data visualization using mondrian. Journal of Statistical Software 7, 11, 1–9. V IÉGAS, F. B. AND WATTENBERG, M. 2007. Artistic data visualization: Beyond visual analytics. In Online Communities and Social Computing. Lecture Notes in Computer Science Series, vol. 4564. Springer, 182–191. V IÉGAS, F. B. AND WATTENBERG, M. 2008. Tag clouds and the case for vernacular visualization. interactions 15, 4, 49–52. WATTENBERG, M. 2005. Baby names, visualization, and social data analysis. In InfoVis 2005: Symposium on Information Visualization. IEEE, 1–7. W HITE , R. W., K ULES, B., D RUCKER , S. M., AND M . C. SCHRAEFEL. 2006. Supporting exploratory search: Introduction. Communications of the ACM 49, 4, 36–39. W ISE , J. A., T HOMAS, J. J., P ENNOCK , K., L ANTRIP, D., P OTTIER , M., S CHUR , A., AND C ROW, V. 1995. Visualizing the non-visual: Spatial analysis and interaction with information from text documents. In InfoVis 1995: Symposium on Information Visualization. IEEE, 51–58. W OOD, J., B RODLIE , K., AND W RIGHT, H. 1996. Visualization over the world wide web and its application to environmental data. In VIS ’96: conference on Visualization. IEEE, 81–86. W OODRUFF , A., FAULRING, A., R OSENHOLTZ , R., M ORRSION, J., AND P IROLLI , P. 2001. Using thumbnails to search the web. In CHI ’01: Proceedings of the SIGCHI Conference on Human Factors in Computing Systems. ACM, 198–205. Y EE , K.-P., S WEARINGEN, K., L I , K., AND H EARST, M. 2003. Faceted metadata for image search and browsing. In CHI ’03: Proceedings of the SIGCHI Conference on Human Factors in Computing Systems. ACM, 401–408.
ACM Transactions on the Web, Vol. 6, No. 3, Article 13, Publication date: September 2012.