Jul 17, 1999 - 1993; John, 1995; Beard, Smith, and Denelsbeck, 1996; John and Kieras, ... calculation application developed to run under Windows (Beard, ...
UMTRl 99-17
July, 1999
Navigation System Data Entry: Estimation of Task Times
Paul Green
@ ; "': The University of Michigan ',,,, Transportation Research Institute
5\11 0,e A-,
UMTRl
s
6
Technical Report Documentation Page 1. Report No.
2. Government Accession No.
3. Recipient's Catalog No.
UMTRI-99-17 4. Title and Subtitle
5 . Report Date
Navigation System Data Entry: Estimation of Task Times
Julv, 1999
I.
laccount1 6. Performing Organization Code
8. Performing Organization Report
Author(s)
Paul Green 9. Performing Organlzation Name and Address
10. Work Unit no. (TRAIS)
The University of Michigan Transportation Research Institute (UMTRI) 2901 Baxter Rd, Ann Arbor, ~ichigan48109-2150
11. Contract or Grant NO.
12. Sponsoring Agency Name and Address
13. Type of Report and Period
Society of Automotive Engineers 400 Commonwealth Drive Warrendale, Pennsylvania 15096-0001 USA
3/97-6198 14. Sponsoring Agency Code
15. Supplementary Notes
This report proposes a method (for SAE Recommended Practice J2365) to estimate in-vehicle task times and reviews the related human factors literature. This met:hod will be used to evaluate alternative driver interface designs and to check complliance with the 15-second task time limit specified in SAE Recommended Practice J2364 (Navigation Function Access While Driving). Application of this method will enhance the safety and usability of driver information systems. A review of the human factors literature (Kurokawa's dissertation, Levison's Integrated Driver Model, the NASA MlDAS software, the Integrated Performance Modeling Environment, etc.) revealed that there was no personal computer software avaiilable or hand calculation methods tailored for this purpose. Therefore, the approach taken was to extend the Keystroke-Level Model (popular in human-computer interaction) using data from automotive navigation studies for calibration. The resulting I 1-step calculation procedure begins with identifying all major goals (e.g., obtain guidance) and subgoals for each task the user performs along with identifying the method used (e.g., the street address method without short cuts). Exactly how each step is carried out is then described using pseudocode. Next, the associated elemental tasks (reaching for a device, keying (cursor, letter, space, enter), mental activity, searching, etc.) and their times are determined. 'Those times are adjusted for driver age, and entered into a spreadsheet where they are totaled. Finally, times are checked for reasonableness and the task sequences are adjusted as needed. 17. Key Words
ITS, human factors, ergonomics, driving, navigation, route guidance, usability, input devices, controls, displays, GOMS, Keystroke-Level Model 19. Security Classify. (of this report)
none Form DOT F 1700 7 (8-72)
18. Distribution Statement
No restrictions. This document is available to the public through the National Technical Information Service, Springfield, Virginia 22161
20. Security Classify. (of this page)
none I
21. No. of pages
47 I
22. Price
I
Reproduction of completed page authorized
Navigation System Data Entry: Estimation of Task TimesUMTRl Technical Report 99-17 University of Michigan Paul Green Ann Arbor, Michigan, USA h l y , 1999
-
PURPOSE
provide information to enhance the safety and usability of driver interfaces provide background material to help develop SAE Recommended Practice J2:365 (Calculating the Time to Complete In-Vehicle Navigation and Route Guidance Tasks) propose a computational method for J2365
LITERATURE SUMMARY
-
Findings and Comments dissertation with extensive data from on-road and simulator studies of control and display use emphasis on conventional systems Hypercard program to predict task times, hand-off-wheel time, number of glances and total glance time to the instrument panel, number of glances to road requires extensive data for predictions (driver age, wo~rkload, exact location of device, size and luminance of labels, etc.) software is not publicly available being incorporated into model being developed for FI-{WA Levison (1993), development of lntegrated Driver Model Levison and Corker includes optimal control model for steering and proceldures model for in-vehicle tasks (1995) software is not publicly available software requires modification for each application being incorporated in FHWA lntegrated Highway Safety Design Model NASA MlDAS used to model aircraft cockpit tasks and control roomsl requires Silicon Graphics workstation key elements are Jack anthropometric software, Legibility Modeling Tool, and Cockpit Design Editor no automotive applications to date HOS and lntegrated commercial software used by human factors professionals Human Performance Monte Carlo simulation software for discrete tasks Modeling no automotive applications [Environment I Study Kurokawa (1990)
.
A
PROPOSED METHOD (based on Keystroke-Level Model and UMTRl data) 1. Obtain a working model or step-by-step operational description of the device. 2
Identify the major user operational goals (and 3, subgoals).
4. ldentify the methods used to achieve all goals and subgoals 5. Generate pseudocode for all methods. 6. ldentify the assumptions (users' knowledge of methods, extent to which switch operation and cognitive activities occur in parallel, the use of shortcuts, etc.). 7. Determine the appropriate mental, keystroke, and other operators for each step. Mental times are 2.2 s. Search times are 2.29 s.
Key Category Cursor Enter Letters Numbers Shift Space
Keystroke 1st 2nd >2nd 1.71 0.69 0.47 1.55 1.54 0.99 1.15 0.47 1.46 0.60
8. Enter the times for each operator. 9. Add up the execution times for each operator using a spreadsheet. 10. Adjust the keystroke times using the age multiplier (1.4 for drivers ages 40-55, 2.2 for drivers over 65. 11. Verify that the times are reasonable and adjust as needed.
KEY REFERENCES Green, P. (1999). The 15-Second Rule for Driver Information Systems, ITS America Ninth Annual Meetina Conference Proceedinas, Washington, D.C.: Intelligent Transportation Society of America, CD-ROM. Green, P. (1999). Estimating Compliance with the 15-Second Rule for DriverInterface Usabilty and Safety, Proceedinas of the Human Factors and Eraonomics Society 43rd Annual Meetinq, Santa Monica, CA: Human Factors and Ergonomics Society (to appear). Society of Automotive Engineers (1998). SAE Recommended Practice for Calculatina the Time to Complete In-Vehicle Naviaation and Route Guidance Tasks (SAE J2365), Committee Draft of November 23, Warrendale, PA: Society of Automotive Engineers. Society of Automotive Engineers (1999). SAE Recommended Practice for Naviaation and Route Guidance Function Accessibility While Driving (SAE 2364), Committee Draft of June 8, Warrendale, PA: Society of Automotive Engineers.
PREFACE This report was produced for the Navigation Subcommittee (Jim Foley, chair) of the Society of Automotive Engineers (SAE) Intelligent Transportation Systems (ITS) Safety and Human Factors Committee (Gene Farber, chair). The report and other related activities were funded by the Society of Automotive Engineers as part of a U.S. Department of Transportation program to support the development of ITS standards. The content and wording of this report were determined by the author and represent his views. This report is a working document written to provide the background for the development of SAE J2365 (Recommended Practice for Calculating the Time to Complete In-Vehicle Navigation and Route Guidance Tasks). This Recommen~ded Practice serves as a design guide for SAE J2364 (SAE Recommended Practice for Navigation and Route Guidance Function Accessibility While Driving) in that it provides a means to estimate compliance with SAE J2364. SAE J2364 states that invehicle tasks, when measured staticly, should not take more than 15 seconds to complete ("The 15-Second Rule"). SAE J2364 provides an experimental procedure for testing interfaces to determine compliance. The unstated focus of J2364 is on data entry tasks, the tasks of greatest concern in a moving vehicle. The procedure specified here provides a quick means to estimate compliance, one that can be applied in the conceptual stage when the interface is still easy to modify. This will support iterative design, leading to safer and easier-to-use driver interfaces for navigation systems. In parallel SAE efforts, a standard is being contemplated by the International Standards Organization (ISO) for the same purpose. In the interests of international harmonization, the two standards should be identical. At the time this report was being written, the I S 0 document was not yet a preliminary work item. The author would like to thank Dr. Jim Foley of Visteon for serving as the techn~ical monitor for SAE for this project and for review of this report. The patience shovvn by the SAE ITS Safety and Human Factors Committee while this thorough effort was conducted is greatly appreciated.
TABLE OF CONTENTS
........................................................................................ 1 MODELS FOR DRIVER INTERFACES ...................................... 2
INTRODUCTION
TASK TIME Software for Interface Evaluation.............................................................. ..........3 Kurokawa (1990) ..................... . . . .................................................................3 Levison's Work ..................................................................................................... 4 MIDAS.................................................................................................................... 5 Integrated Performance Modeling Environment............................................5 GOMS Family of Models................................................................................................. 5 Model Hurnan Processor.................................................................................... 6 7 Keystroke-Level Model....................................................................................... UMTRl Work on Keystroke-Level Models........................................................ 8 Extensions to Display Evaluation ...................... . .....................................................12 12 Namba's Method................................................................................................ 14 Evans and Stevens (1996) .............................................................................. Summary ......................................................................................................................... 15
. .
.......................... ............................................................1 7
REFERENCES APPENDIX A
. RESEARCH AT
APPLIED PSYCHOLOGICAL
.......................................................................2 1 . EXAMPLE CALCULATION.......... . ..................................2 3 SERVICES
APPENDIX B
vii
INTRODUCTION This is the second of two reports describing the research relating to in-vehicle navigation system use. The first report (Green, 1999c) addressed 11 questions that provided a basis for the development of SAE Recommended Practice J2364 (Navigation and Route Guidance Function Accessibility While Driving). Those questions are listed in Table 1. Table 1. Questions to be Addressed Question 1 Is there statistical evidence that crashes are more when a navigation system is used, in particular during1 destination input? 2 Are there cases in which navigation system use cause of a crash? 3 What is the relationship between visual demand and crashes? 4 Does the input and retrieval of destinations degrade driving performance? 5 How long do input-related navigation system complete and how do they compare with 6 How often and for how long do drivers prefer vehicle and how safe/comfortable do drivers feel they are when they do such? 7 What is the relationship between actual glance ratings of comfort and safety? #
Designation and Driving Performance Preferences and I Free Glance
1 comfort and
8 How much time do drivers actually spend glancing at 9
existing vehicle controls and displays and, during entry tasks, navigation displays? How often do lane departures occur for in-vehicle
Departures
j
10 What is the relationship between mean number of glances, mean time, and lane departures for existing controls 11 What do existing guidelines require I navigation systems in a moving vehicle?
Based on the evidence in that report and ITS Navigation Subcommittee discus;sions, a consensus was developed to use static task time as the performance measure (Green, 1999b). In addition, an experimental procedure for measuring task time was developed, and from this effort, a draft SAE Recommended Practice has emerged, SAE J2364 (Society of Automotive Engineers, 1999). In brief, SAE J2364 specifies that in-vehicle tasks, when measured staticly, should not take more than 15 seconds to complete ("The 15-Second Rule").
SAE J2364 relies upon an experimental procedure to determine compliance. A drawback of that approach is that testing requires a working prototype for compliance verification, something that often is not available until late in the development process, often too late to make changes. Therefore, to compare concepts, a design and evaluation aid is necessary for use early in development. The iterative cycle of design, calculate, and redesign is the manner in which most engineering occurs. Efforts to promote safety and usability that are consistent with common engineering practice are likely to be used by engineers. In the early stages of this SAE project, the need for two SAE documents was envisioned. Initially, the thinking was that the second document would provide guidelines of some sort, for example, specifying the number of items that could be in menus, the types of controls appropriate for particular tasks, etc. However, it was clear to the author and others that what was really needed were calculation methods to assess alternative interface configurations. Such methods have proven to be extremely useful to those developing user interfaces to computer systems. Further, since navigation-system interfaces are evolving rapidly, there was the possibility of focusing on interface characteristics that were obsolete. In fact, at the time of this report, task completion times for interface elements (e.g., menu selection time as a function of menu length) did not exist for automotive-navigation interfaces. For these and other reasons, the second effort in this project emphasized a computational method. Accordingly, the purpose of this report is to (1) review the data and methods in the literature that have potential use for predicting data-entry task-completion times with navigation systems, and (2) to propose a method for calculating those times. Each of those goals is treated separately, It is important to realize that the literature on human performance modeling is significant, and that within the framework of this project, the resources for a comprehensive review do not exist. The report scope has been set accordingly. In parallel with the development of this report, a draft Recommended Practice (SAE J2365, Society of Automotive Engineers, 1998) has been developed and submitted to the Navigation Subcommittee. At the time of this report, SAE J2365 had not been discussed as the Subcommittee has focused on SAE J2364. In addition, a paper summarizing the calculation method has been written (Green, 1999b). Given the number of changes that occurred during the development of J2364, J2365 is unlikely to be implemented exactly as described in this report. However, the report should provide a solid foundation for the development of J2365. TASK TIME MODELS FOR DRIVER INTERFACES
Tasks times can be (1) predicted directly or (2) based on task characteristics such as the number of glances, estimated using the equations in Green (1999). Direct computation is more likely to provide the most accurate estimates. Three topics related to task times are covered in this report: (1) software for the evaluation of interfaces, (2) GOMS (Goals, Operators, Methods, and Selection Rules) models, and (3) model extensions to display evaluation. Related research that considers the characteristics of control and display systems, the work of Applied Psychological
Services, is covered in Appendix A, and fundamental research on control use appears in Green (1979) and Faerber and Faerber (1988). Other, more current work of Faerber of the University of the Armed Forces (Munich) is not included in this review as English translations of his research were not available to the author, though it is known that evaluation software that runs on Silicon Graphics hardware has been developed. (See a forthcoming publication, Farber and Muller (1999), for a summary,)
Software for Interface Evaluation Kurokawa (1990) Kurokawa's dissertation (Kurokawa, 1990) contains extensive data from both on the road and in a driving simulator on the time to complete tasks such as selecting a button from an array while driving. (See also Hayes, Kurokawa, and Wierwille, 1989; Kurokawa and Wierwille, 1990.) The primary emphasis was conventional controls and displays. The Hypercard program developed is extremely complex and has numerous adjustment factors as shown in Table 2. The model computes task tiime, the desired measure, and presumably could be tailored to predict task performance in navigation-data-entrytasks. However, the model is so detailed that it is not readily amenable to hand calculation and the software is not publicly available at this time. However, development is ongoing (Wierwille, Dingus, and Hanowski, 1999), so the software could be available at some future date. The report (Kurokawa, 1990) describing the development and implementation of this model is quite comprehensive, so reconstructing the niodel is a time-consuming possibility. Table 2. Selected Data Utilized by Kurokawa's Model Characteristics Category task completion time output performance hand-off-wheel time number of glances to the instrurnent panel total glance time to the instrurnent panel mean number of glances to the road mean eye-transition time visual output figures of manual merit overall frequency of use adjusted figure
Comment
visual = 40 * (mean IP glance time)M2 + 3 * (# IP g l a n ~ e s ) ~ 2 / 3 manual = 11 * (hand.off.whe1el time) overall = 0.7 * visual + 0.3 * manual adjusted = overall * frequency.of.use/hr 1 10
.
Characteristics Comment age (18-24, 25-49, 55+, all) low workload = low traffic density, sex (men, women, both) straight and level roads, no unusual workload (low, medium, high, events all levels) medium = moderate traffic or road curvature, or substantial up or down grade high = high traffic density, unanticipated events requiring frequent monitoring, extreme curvature, minimal forward view horizontal and vertical instrument distance between line of sight panel and center of panel location horizontal angle vertical angle distance between eye and center of panel panel tip back angle instrument coordinates label character size (minutes control label of arc) factors label luminance (high, low) degree of driver reliance on labels For each task, additional details are 'control task primarily visual, primarily generally required. manual, complex manipulation, type complex cognitive, auditory feedback, continuous control, discrete control, discrete control and display visual task' check reading (label, odometer, For each task, additional details are generally required, For example, for fuel, speedometer), detection tYPe check reading, the character color, (which mirror luminance, and size are needed. Category driver
.
.
Levison's Work Levison (1993) and Levison and Corker (1995) describe the development of the Integrated Driver Model (IDM). This model is the combination of a submodel for driver completion of in-vehicle task procedures and an optimal control model used to predict steering performance. The emphasis of the model was on predicting task-switching behavior and providing a precise description of when steering corrections would occur. Some work was done to calibrate the model to predict performance when timesharing between tracking and dialing a phone. However, the model required use of a particular unique combination of hardware present at Bolt, Beranek and Newman and considerable tailoring for each application. Hence, the primary value of the work is in describing how a model should be developed for automotive applications rather
than as ready-to-run software. At one time, work on this model was continuing as one of the modules in the Federal Highway Administration Interactive Highway Safoty Design Model (IHSDM). (See http://www.tfhrc.gov/.) The driver performance module will consist of 6 major functional components: (1) perception, (2) speed decision, (3) path decision, (4) speed control, (5) path control, and (6) attention. MlDAS The MlDAS project is run by the Computational Human Engineering Research Office of the Aviation Operations Branch of the NASA Ames Research Center (Anonymous, 1999; Corker and Smith, 1999). The purpose of the project is to produce software tools and methods to improve the human-engineering design process for advancedtechnology crew workstations. MlDAS is a 3-D prototyping and task analysis environment. It allows designers to ask "what-if" questions about crew performance. MlDAS contains routines to describe the operating environment, equipment, and goals of operators. The software contains detailed models of human anthropometry, vision, memory, and decision making. Key elements include the Jack human figure model, the Legibility Modeling Tool, and the Cockpit Design Editor. The software runs; on Silicon Graphics equipment. Applications of MlDAS include several aircraft applications (taxing, clearance to land, tilt rotor, flight suits, high speed civil tramsport) and two control room applications (nuclear power plant, 91 1 center). There have been no automotive applications. lntegrated Performance Modeling Environment The Integrated Performance Modeling Environment (http:/lwww.maad.com/ipme.html), a product of Micro Analysis and Design, is a collection of UNIX-based software tools to answer human-performance questions. The primary applications of the lntegrated Performance Moceling Environment has been toward military problems. Tool elements include the environment modeling capabilities (temperature, time of day, etc.) operator characteristics (e.g., fatigue, ability), performance-shaping factor,s (e.g., task time limits), the Human Operator Simulator (HOS), and the MicroSaint application package. The HOS elements of this environement have the capability to allow1for the specification of physical workspaces. Micro models of human behavior, such (as reading rate, are key features of HOS. MicroSaint is a discrete-event Monte Carlo simulator engine that uses a graphic interface to define a task network. MicroSaint allows for the distribution of task: times to be specified along with distribution parameters, sequential dependencies, anti other task characteristics. Within the human factors profession, the MicroSaint portion of that environment is the most commonly used simulation package. GOMS Family of Models The most commonly applied approach for determining task completion time for tasks that are highly cognitive, especially in human-computer interaction is the GOh4S family of models (Card, Moran, and Newell, 1983; Kieras, 1988; Gray, John, and Atwrood, 1993; John, 1995; Beard, Smith, and Denelsbeck, 1996; John and Kieras, 1996). GOMS is a group of models developed by Card and his colleagues at Xerox to predict
the time required to complete routine cognitive activities using a computer system. The model is intended to provide engineering approximations of task times. The model set assumes the user is reasonably familiar with the task of interest (hence the term routine) and that primary human limitations are cognitive (thinking), not physiological (aerobic capacity, muscle strength, etc.). Also, it is important to note that GOMS was designed for single tasks, and not timesharing as in the automotive case, though there is no reason why timesharing extensions could not be developed. The key to a GOMS analysis is task decomposition. For example, suppose the task was to change the time on a car clock. Typically, this might involve pressing the set button, then pressing the hour or minute button, either separately or in conjunction with set button, to advance the time. In this case, the top-level goal is to "set the clock" with subgoals of "entering the set mode" and "advancing the hour." For each low level goal, operators and methods ("push the set button to enter the set mode') are created. Selection rules determine the sequence chosen when more than one alternative exists. There are four commonly cited implementations of the GOMS concept: (1) Card, Moran, and Newell GOMS (CMN-GOMS), (2) the Keystroke-Level Model, (3) New GOMS Statement Language (NGOMSL), and (4) Critical-Path Method GOMS (CPMGOMS, John and Kieras, 1996). CMN-GOMS, sometimes called the Model Human Processor, is the original version of GOMS as implemented by Card, Moran, and Newell (1983). The Keystroke-Level Model is a simplified version of GOMS. NGOMSL is a rigorous version of GOMS written in pseudocode. NGOMSL contains numerous applications rules. CPM-GOMS is a modification of the basic GOMS approach designed to handle parallel activities. CMN-GOMS and the Keystroke-Level Model are described in greater detail in the sections that follow. Finally, for the sake of completeness, readers should be alerted to Quick and Dirty GOMS (QGOMS), a calculation application developed to run under Windows (Beard, Smith, and Denelsbeck, 1996),
Model Human Processor The Model Human Processor is a computer-system representation of the human thought process consisting of three memory systems and four processors. These components are organized into three subsystems (perceptual, cognitive, motor). Processors (Table 3) have one parameter, cycle time. Memories (Table 4) have three parameters: storage capacity, storage code, and decay time. For each parameter, three values are given: middleman, slowman, and fastman. Middleman is the most typical value. Slowman and fastman represent reasonable minima and maxima. The model also includes eye-fixation times. The choice of the value depends upon the prediction needed-best case, worst case, or typical. For most automotive tasks, using the Model Human Processor to predict the entire task may be more detailed than is needed as times of elements are on the order of 100 ms.
Table 3. Processor Cycle Times (ms) Processor perceptual cognitive motor
fastperson 50 25 30
middleperson 100 70 70
slowperson 200 17'0 100
Table 4. Memory Capacity Ierson 100 7 ' 500 1.2 inite inite tantic 34 9
Keystro ke-Level Model The Keystroke-Level Model (Card, Moran, and Newell, 1983; Chi and Chung, 1996) may be a more appropriate implementation for automotive tasks. Table 5 shows the commonly used values. These values emerged from research at Xerox on the time to complete tasks involving use of a CRT, keyboard, and a mouse. It is important to note that times for typing are for touch typing, a situation that does not occur in present-day vehicles. Also note the wide range of values (0,50 to 1.2 s) to choose from for the K (keystroke) parameter, especially when the material is complex or unfamiliar, or the user is unskilled, conditions that could occur for automotive-navigation data-entry tasks.
Table 5. Keystroke-Level Model Parameters Symbol Comment Parameter P point with a mouse to a target on a display Pointing home hand(s) to keyboard or to device H Homing D draw N straight lines of length L cm Draw M mentally prepare Mental R context-specific response time, empirically System Response determined K best typist (135 wpm) Keystroke good typist (90 wpm) average skilled typist (55 wpm) average nonsecretary typist (40 wpm) typing random letters Typing complex codes worst typist (unfamiliar with keyboard)
Time (s) 1.I 0.4 .9N + .15L 1.35 t 0.08 0.12 0.20 0.28 0.50 0.75 1.20
Since this original set of values were obtained, other element time estimates have appeared in the literature. Olson and Nilsen (1987-1988) from their work on spreadsheet use estimate M to be 1.62 s and K to be 0.36 s. In addition, they also added a parameter to the set S (2.29 s), the time to scan a row to find an item in a matrix. UMTRl Work on Keystroke-Level Models Two sets of studies have been conducted for the purpose of validating the use of the GOMS approach for predicting task times in motor vehicles. Paelke (1993) had drivers enter destinations using four different interfaces. Table 6 shows the results obtained using NGOMSL. Although the rank order for the predictions agreed quite well with the actual task-completion times, there were substantial differences between the model and actual times, with the GOMS times being somewhat larger than the actual times. The reason for this is unclear. Nonetheless, this did establish that GOMS models have practical value for automotive-interface evaluation. Table 6. Paelke's Comparison of Keystroke-Level Predictions and Prototype Execution Times
Manes, Green, and Hunter (1996) describe an extension of the research by Steinfeld, Manes, Green, and Hunter (1996) in which Keystroke-Level Models were used to predict entry and retrieval times for the Ali-Scout navigation system. The experiment
conducted involved 36 subjects from three age groups (18-30, 40-55, and over 65), all of whom were licensed drivers but unfamiliar with navigation systems (as called for by J2364). Subjects watched a videotape on using the interface, and then practiced entering and retrieving five destinations, exactly the amount of practice envisioned in SAE J2364. In the test segment, subjects entered and retrieved five other sets of destinations three times (one using a touch screen simulation, and twice using real interfaces, both for simulated dusk and night conditions). Entering and retrieving destinations involved typing in text, entering numeric strings (destination longitudes and latitudes), and scrolling through alphabetized lists, sequences common to many destination-entry tasks. Admittedly, the Ali-Scout interface had very small keys with poor feedback and the entry scheme was confusing, so elemental times could overestimate times for more typical interfaces. However, the additional test trials in the experiment should have caused subjects to reach a level of performance consistent with J2365. Hence, use of that data set as an initial basis for J2365 is reasonable. To determine how well task performance could be predicted, Manes, Green, and Hunter (1996) provide an Excel spreadsheet that describes each step in the Keystroke-Level Model of the entry and retrieval tasks for each of the 15 destinations evaluated. Only the data for the real interfaces (not the touch-screen simulation) were included in the analysis as the lack of tactile feedback for the touch screen elevated task times by several percent. Based on a regression analysis, linear equations based on pure Keystroke-Level Models accounted for 41 (all subjects) to 78 percent (young subjects only) of the variance of retrieval times but only 12 to 39 percent of the entry times. Retrieval tasks took about 10 s while entry tasks took about a minute. For tailored Keystroke-Level Models (with experimentally based values for keystroke times, and adjustments for age and lighting) the variance accounted for was 58 and 83 percent (all subjects and young subjects, respectively) for retrieval, and 47 and 49 percent for entry. Use of linear equations and tailored models significantly reduced the size of prediction errors, making the predictions useful for engineering evaluations of alternative interfaces. Table 7 shows the full set of predictions. The author has no theory-based explanation for why these corrections were needed.
Table 7. Regression Equations and Correlations for Various Keystroke-Level Models. Y is the actual time, X is the prediction. Retrieval
Young All Subjects R2 Equation Equation Y=-2.381 0.78 Y=-1.839 + 1.380 X + 1.759 X Y=-2.381 0.78 Y=-1.839 + 1.104X + 1.407 X Y=-0.352 + 0.935 X Y=-0.853 + 1.851 X
standard Keystroke-Level Model (K=1.2, M=1.35) modified keystroke model (K=1.5, M=2.2) standard model (K=1.2, M=1.35) with age adjustment (young=l, mid=1.4, old=2.2) tailored model (various K's, M=2.2, lighting values, no age adjustments) tailored model Y=-1,585 (various K's, M=2.2, lighting values, + 1.447 X age adjustments)
0.83 Y=0.039 + 1.054 X
R2 0.41 0.41 0.54 0.44 0.58
Entry standard Keystroke-Level Model Y=-17.057 0.39 (K=1.2, M=1.35) + 1.613 X modified keystroke model Y=-18.379 0.39 (K=1.5, M=2.2) + 1.290 X standard model (K=1.2, M=1.35) with age adjustment (young=l , mid=1.4, old=2.2) tailored model (various K's, M=2.2, lighting values, -no age adjustments) tailored model Y=-17.494 0.49 (various K's, M=2.2, lighting values, + 1.445 X age adjustments)
Y=-12.962 + 1.851 X Y=-14.479 + 1.480 X Y=13.57 + 0.692 X Y= -7.689 + 1.498 X
0.1 2
Y=12.288 + 0.644 X
0.47
0.1 2 0.45 0.1 2
Based on these results, Manes, Green, and Hunter (1996) suggest a process similar to what follows for predicting entry and retrieval times. Although not formally stated, prior to computations, the goals and methods for each task and subtask must be identified, and from that information a detailed pseudocode description of all user actions must be created. This initial effort, in fact, is expanded elsewhere in this report into a series of steps. Completing this initial effort requires some experience in task analysis, an activity well suited to a human factors engineer. The time required for the initial effort is a significant fraction of the time for the complete analysis. Step 1: Based on the pseudocode listing, select the base keystroke time from Table 8.
Table 8. Keystroke times for young drivers. Key Category Cursor Enter Letters Numbers Shift Space
Keystroke 1st 2nd >2nd 1.71 0.69 0.47 1.55 1.54 0.99 1.15 0.47 1.46 0.60
Note: The standard Keystroke Level Model assumes that times for all keystrokes are equal. In this case, the differences between categories may be unique to the Ali-Scout keyboard, so these differences warrant further experimental investigation. However, more importantly, notice that the times for repeated keystrokes are much less than single or initial keystrokes. In navigation data entry, repeated keystrokes (scrolling though a list, repeated numbers or letters in an address) are common. Step 2: Adjust for the lighting conditions. Increase the time by 6 percent for night conditions. Decrease the time by 6 percent for dusk conditions. Since this effect is relatively small, this step can be omitted if quick calculations are needed. Step 3: Adjust for age. Multiply the time by 1.4 for middle-aged drivers (40-55), 2.2 for older drivers (over 65). If other age groups are to be the test group, use regression analysis to develop a multiplier for that age group. For older drivers, the times for shift and enter will be underestimated. Since there is usually only one enter keystroke and few shifts, if any, in a typical sequence, underestimating the time of one or two keystrokes leads to minimal errors. Step 4: Use 2.22 s for mental time. Step 5: Compute total time. Insert the appropriate values for K, M, and other parameters in the Keystroke-Level Model and compute the total task time. Step 6. Use the regression equations that follow to adjust the time estimates. For tasks on the order of 10 s, use the retrieval corrections. For tasks on the order of 1 minute, use the corrections for entry times. An expansion of this approach, the method proposed for SAE Recommended Practice J2365, appears in Appendix B along with a detailed example of obtaining guidance using the street-address entry method for the Magellan PathMaster. The step:;
identified represent a combination of the ideas found in the literature with insights gained when applying this approach to the analysis of real interfaces.
Extensions to Display Evaluation The emphasis of most computational models (especially the keystroke model) is on tasks where manipulating controls is significant. However, there are trends towards expanding the information content presented to drivers. As that occurs, methods are needed to predict task times for visual tasks. Although aspects of the Keystroke-Level Model allow for such, models and methods tailored towards automotive applications are likely to be required. The psychological and human factors literature on display design, evaluation, and user performance is huge, and there is no way it can be comprehensively reviewed here. However, there are two approaches in the literature that have already shown potential value for automotive-display evaluation: Namba's Method and the computational methods suggested by Evans and Stevens.
Namba's Method Namba's method is an attempt to predict the time necessary to view a display based on information theory. Namba (1980) asserts that since there are 46 kana (basic Japanese) characters, each kana contains 5.5 bits of information (log2 46), assuming all kana are equally likely (not true, but a reasonable first assumption). However, as Namba points out, treating voiced sound symbols and long vowels as equivalent to kana, there are actually 106 characters, so each contains 6.7 bits of information. As a compromise, Namba considered egch kana to be 6.0 bits. Given there are approximately 1850 common kanji (Chinese ideographic characters), each kanji contains 10.85 bits of information. (For related information on this approach, see Fukuda, 1992a,b.) To determine acceptable presentation rates, Namba examined three sources of data on reading text, two from the popular visual media (text on TV, film subtitles), and one from a reading experiment he conducted. For text shown on TV newscasts, he assumed that since the public was able to read them, the duration should be acceptable. Assuming human-channel capacity to be 50 bitsls, the typical rate was about 114 of that (12.5 bitsls) with most displays falling between 118 and 112 of channel capacity. All of the data points were above 1/12 of channel capacity. (See Namba's 1980 paper for a listing of the sources of information used to determine channel capacity and the programs from which text was obtained.) In the experiment he conducted, 30 subjects were shown a variety of text displays. Subjects either (1) read (and recognized) the characters, or (2) transcribed them. The reading rate was between channel capacity and half of it (depending on the subject). The transcription rate was between 118 and 1112 of channel capacity. Finally, Namba examined the text presentation rates normally used for subtitles in film and dubbed speech. Interestingly, the subtitle rate was 112 that of dubbed speech. His assumption was that these rates were selected to assure reasonably high rates of comprehension by most viewers, but the rates would not be so slow as to lead to boredom.
As a whole, these data sets suggest a range of acceptable presentation rates 08ftext. Kamiya, Nakamura, and Matsumoto (1994) describe the application of Namba's method to display times for in-vehicle information based on data collected in the VlCS project, a project conducted in Japan concerning the presentation of navigation and traffic information. (See also Ito, 1996.) Drivers were asked nine questions (Table 9) in the context of city and highway driving three times each, for a total of 54 responses. Regression analysis indicated the amount of information (for text) was equal to 44.26(bit/s) * eyes-off-road-time -15.74(bits). If channel capacity is 50 bitsls, and 1.49 s is required to process 50 bits, the difference, 0.49 s is the time required to look from the road to inside the vehicle, refocus, and then look back to the road. This is reasonably close to an estimate based on 200 ms to transition in each direction^. For objects, the amount of information (again from regression analysis) was equal to 49.67 * eyes-off-road time - 18.56. In all cases, time is measured in seconds. Table 9. Experimental Displays in VlCS Experiment
1
# 1 2 3
display text: 10 letter deformed traffic-conaestion displav (schematic) 1 traffic-congestion display #1
I
Based on Kamiya, Nakamura, and Matsumoto (1994), the information content of an image is computed as follows: 1, Identify all elements in the display. Assign 2.2 bits to each letter, 6.0 bits to each kana, 10.85 to each kanji, and 14 bits to each object. 2. Identify the information that is relevant to the driver's decision. This includes all street, city, and district names, all major roads intersecting with the current position, roads onto which the driver might turn, and other graphical elements such as arrows and the current location icon. It is not apparent if this general description is sufficient for determining which elements to include in the calculations, an issue that clesewes further exploration. 3. Compute the recognition time using the appropriate equation: for text: Information in image = 44.26 * time - 15.74 or timo = (information 15.74) / 44.26 where information is in bits, time is in seconds
-
for graphics: or
information in image = 49.67 * time - 18.56 time = (information - 18.56) / 49,67
This method appears to be a reasonable first approximation for estimating display task completion time. However, it must be recognized that one must not only consider the graphical elements of interest, but also how they are manipulated. For example, finding a particular street relative to one's location (find the second cross street, a counting task) is quite different from identifying where a particular street is on a map. Identifying the steps required to compute information content for specific tasks for specific example maps (both in English and in Japanese) could provide useful clarification. Evans and Stevens (1996) This paper describes research to develop measures of graphical complexity for maps and map like images (Table 10). Evans and Stevens (1996) had 10 subjects rate three types of stimuli (navigation displays, route guidance displays, and text) on a 1 to 5 scale of complexity and also had subjects press a key when they had finished reading those displays in a dual-task context. In addition, they also examined the number of bytes required to represent the displays using various compression algorithms, though the description of them and the rationale for their selection is brief. Although this method is computationally efficient, a theory to explain which characteristics are important and why is desired. Table 10. Measures of Graphical Complexity from Evans and Stevens (1996) Description total number of line segments contained within an arrow plus the number of roads that intersect the arrow, any lane markers, and any other features. In counting, each segment of an arrow is a separate feature. weighted count certain features (such as the number of side roads that had to be passed before an exit was reached) are given more weight. A of discrete reproducible method for such is not described. features the display is divided into 8 squares, and the number of features is mean local counted density maximum local the number of features in the cell with the highest count density the number of features within two degrees of the vehicle location critical local icon expressed as the percentage of total features density Measure total count of discrete features
Table 11 shows the results. This paper should be viewed as a source of ideas as to how the complexity of navigation displays might be predicted rather than as a definitive source of predictions. Further details on this research should be forthcoming.
Table 11. Results from Evans and Stevens (1996)
Summary 1. There at least five major efforts to model human performance in complex, timesharing situations that duplicate or are similar to driving a motor vehicle; (1) Kurokawa, (2) Levison, (3) MIDAS, (4) the Integrated Performance Modeling Environment (a HOS-derivative), and (5) Faerber's work. Because it is written in German, little is known about Faerber's research in the U.S. 2. Kurokawa's method has been validated for conventional instrument panel tasks, but not for navigation tasks that require considerable cognitive input. However, his software, a Hypercard program, is not publicly available and recreation of his software would be expensive. Enhancements of his method may become available in the future.
3. Levison's work concerned the coordinated development of optimal control niodels to predict steering performance and a procedural model to predict in-vehicle system use. The resulting software has been demonstrated to provide good predictions of path maintenance and task interruptions. However, the software runs on unique hardware and is not widely accessible. Development of this model continues under FHWA sponsorship. 4. The NASA MlDAS software has been used recently for several high-technollogy applications, primarily related to aircraft. However, this application requires an Silicon Graphics workstation. There are no known automotive uses of MIDAS.
5. The HOS-based tools are well structured for predicting human task performance in that micro models for many tasks are a part of the software. The software is readily available and is the most commonly used simulation package by human factors professionals. However, the software, being a Monte Carlo simulation, was not intended to support continuous-control tasks (e.g., steering). 6. For human-computer-interactionproblems quite similar to automotive data entry, the use of the GOMS family of models is preferred for task-time estimation. Of the models in the GOMS family, the Keystroke-Level Model is most appropriate for use, though the parameter values need to be adjusted to fit the UMTRl data. Those estimates should give reasonable engineering estimates for task-completion times. 7. This report proposes an II-step method (presented in Appendix 6) to estimate in-
vehicle task times. Those steps are:
1. Obtain a working model or step-by-step description of device operation. 2
ldentify the major user goals relating to device operation.
3. Identify the major user goals and subgoals relating to device operation.
4. For each particular goal or subgoal, identify the methods used to achieve them. 5. Convert the wordlsentence-based description of the methods into pseudocode. 6.
ldentify the assumptions with regard to test-users' knowledge of various methods of task completion, such as the extent to which switch operation and cognitive activities are completed in parallel, the use of shortcuts, etc.
7. Determine the appropriate mental, keystroke, and other operators for each step. 8.
Enter the times for each operator.
9. Add up the execution times for each operator. This is easiest to do using a spreadsheet.
10. Adjust the keystroke times using the age multiplier, 11. Verify that the times make sense and revise as needed. 8. Further development and validation to the procedure described in this report is desired. The only examples of navigation data-entry task-time estimates are the UMTRl work on the Ali-Scout cited earlier and the street-address-entry case for the PathMaster in the appendix to this report.
9. Several authors (Evans and Stevens, Namba) have proposed methods for computing the information demands of displays, and they should be considered for addition to future versions of task-time calculations. Several individuals in Japan have found Namba's method to be of practical value. These two methods do not consider control operation.
10. Finally, two methods described in the appendix provide figures of merit for user interfaces (Display Evaluation Index, Analytic Profile System). Although these methods are not used in contemporary practice, the underlying characteristics in these models should be considered as the calculation model is enhanced to improved the predictions for display tasks.
REFERENCES Anonymous (1999). MlDAS - Machine Interface Design and Analysis System (http:/lccf.arc.nasa.gov:80laflafflmidas/MlDAS~home~page. html). Beard, D.V., Smith, D.K., and Denelsbeck, K.M. (1996). Quick and Dirty GOMS: A Case Study of Computed Tomography Interpretation, Human-Computer I n t e r a ( m , 11, 157-180. Card, S.K., Moran, T.P., and Newell, A. (1983). The Psvcholoav of Human-Cornputer Interaction, Hillsdale, NJ: Lawrence Erlbaum Associates. Chi, C-F. and Chung, K-L. (1996) Task Analysis for Computer-Aided Design (CAD) at a Keystroke Level, &lied Eraonomics, 27(4), 255-265. Corker, K.M. and Smith, B.R. (1999). An Architecture and Model for Cognitive Simulation Analysis: Application to Advanced Aviation Automation (http://ccf.arc.nasa.gov~80/af/afflmidaslwwlAIAA~Final.txt). Evans, J.L. and Stevens, A. (1996). Measures of Graphical Complexity for Navigation and Route Guidance Displays, Displays, 17, 89-93 (also distributed as lSO/TC 22ISC 13NVG 8lN 158). Card, S.K., Moran, T.P., and Newell, A. (1980). The Keystroke-Level Model for User Performance Time with Interactive Systems, Communications of the ACM, July, 23(7), 396-410. Farber, B. and Muller, M. (1999). Evaluation of the Attentional Demand of Conltrols: A Computerised Tool Kit, paper to be presented at Vision in Vehicles 8, Boston, August. Faerber, B. and Faerber, B. (1988). Sicherheitsorientierte Bewertung von Anzeigeund Bedienelementen in Krafifahrzeugen - Empirische Ergebnisse; Safety oriented Evaluation of Instrument and Control Displays in Vehicles - Empirical Results (Technical report 74), Tuebingen Universitaet, Psychologischen Institut, Germany. Gray, W.D., John, B.E., and Atwood, M.E. (1993). Project Ernestine: Validating a GOMS Analysis for Predicting and Explaining Real-World Task Performance, LiumanComputer Interaction, 8, 237-309. Green, P. (1979). Automobile Multifunction Stalk Controls: Literature, Hardwa.reand Human Factors Review (Technical Report UM-HSRI-79-78). Ann Arbor, MI: Thle University of Michigan Highway Safety Research Institute. Green, P. (1999a). The 15-Second Rule for Driver Information Systems, ITS America Ninth Annual Meetina Conference Proceedings, Washington, D.C.: Intelligent Transportation Society of America, CD-ROM.
Green, P. (1999b). Estimating Compliance with the 15-Second Rule for Driver lnterface Usability and Safety, to appear in Proceedinas of the Human Factors and Eraonomics Societv 43rd Annual Meeting, Santa Monica, CA: Human Factors and Ergonomics Society. Green, P. (1999~).Visual and Task Demands of Driver lnformation Svstems (Technical Report UMTRI-98-16), Ann Arbor, MI: The University of Michigan Transportation Research Institute. Hayes, B.C., Kurokawa, K., and Wierwille, W.W. (1989). Age-Related Decrements in Automobile lnstrument Panel Task Performance, Proceedinas of the Human Factors Societv 33rd Annual Meetinq, Santa Monica, CA: Human Factors and Ergonomics Society, 159-163. John, B.E. (1995). Why GOMS? Interactions, October, 80-89. John, B.E. and Kieras, D.E. (1996). Using GOMS for User lnterface Design and Evaluation: Which Technique?, ACM Transactions on Computer-Human Interaction, December, 3(4), 287-319. Kamiya, H., Nakamura, Y., and Matsumoto, H. (1994). A Study on Recognition of InCar Visual Information, 1994 Vehicle Naviaation and lnformation Svstems International Conference Proceedinas, New York: Institute of Electrical and Electronics Engineers, 469-472. Kieras, D. (1988). Towards a Practical GOMS Model Methodology for User lnterface Design, Chapter 7 in M. Helander (ed.) Handbook of Human-Computer Interaction, New York: Elsevier Science, 135-157. \
Kieras, D.E. and Meyer, D.E. (1997). An Overview of the EPIC Architecture for Cognition and Performance with Application to Human-Computer Interaction, Human391-438. Computer Interaction, 2, Kurokawa, K. and Wierwille, W.W. (1990). Validation of a Driving Simulation Facility for lnstrument Panel Task Performance, Proceedinas of the Human Factors Societv 33rd Annual Meetinq, Santa Monica, CA: Human Factors and Ergonomics Society, 1299-1303. Kurokawa, K. (1990). Development of an Evaluation Proaram for Automotive lnstrument Panel Desian (unpublished Ph.D. dissertation), Blacksburg, VA: Virginia Polytechnic Institute and State University. Levison, W.H. (1993). A Simulation Model for the Driver's Use of In-Vehicle lnformation Systems (TRB Paper 930935), paper presented at the Transportation Research Board Annual Meeting, Washington, DC., January 10-14, 1993. Levison, W.H., and Cramer, N.L. (1993). Description of the lntearated Driver Model (BBN Technical Report 7840), Cambridge, MA: Bolt Beranek and Newman.
Manes, D., Green, P., and Hunter, D. (1998). Prediction of Destination Entry a r d Retrieval Times Usina Keystroke-Level Models, (Technical Report UMTRI-96-37), Ann Arbor, MI: The University of Michigan Transportation Research Institute (in review). Namba, S. (1980). The Amount of lnformation in a Still-Picture and the Dis~layTime Reauired (NHK Technical Note 248), Tokyo, Japan: NHK Technical Research Laboratories. Olson, J.R. and Nilsen, E (1987-1988). Analysis of Cognition Involved in Spreadsheet Software Interaction, Human-Computer Interaction, 3, 309-349. Paelke, G, and Green, P. (1993). Entry of Destinations into Route Guidance Svstems: A Human Factors Evaluation (Technical Report UMTRI-93-45), Ann Arbor, MI: The University of Michigan Transportation Research Institute. Paelke, G.M. (1993). A Comparison of Route Guidance Destination Entry Methods, Proceedinas of the Human Factors and Eraonomics Society 37th Annual M e e t u 1993, Santa Monica, CA: The Human Factors and Ergonomics Society, 569-5;73. Siegel, A.I., Fischl, M.A., and MacPherson, D. (1975). The Analytic Profile Sysl;em (APS) for Evaluating Visual Displays, Human Factors, 17(3), 278-288. Siegel, A,, Miehle, W., and Federman, P. (1963). Short Calculations for and Villiditv of the DEI Technique (technical report), Wayne, PA: Applied Psychological Services. Siegel, A.I., Miehle, W., and Federman, P. (1964). The DEI Technique for Evaluating ~, Equipment Systems from the Information Transfer Point of View, Human F a c t o ~June, -6(3), 279-286. Society of Automotive Engineers (1999). SAE Recommended Practice for Naviaation and Route Guidance Function Accessibility While Driving (SAE J2364), Comm~ittee Draft of June 8, Warrendale, PA: Society of Automotive Engineers. Society of Automotive Engineers (1998). SAE Recommended Practice for Calculating the Time to Complete In-Vehicle Naviaation and Route Guidance Tasks (SAE J2365), Committee Draft of November 23, Warrendale, PA: Society of Automotive Engineers. Steinfeld, A,, Manes, D., Green, P., and Hunter, D. (1996). Destination Entry and Retrieval with the Ali-Scout Navigation System (Technical Report UMTRI-96-30), Ann Arbor, MI: The University of Michigan Transportation Research Institute. Tijerina, L. (1999). A Test Track Evaluation of the 15-Second Rule, presentation at the SAE ITS Safety and Human Factors Committee meeting, February 26, 1999, Dearborn, Michigan. Tijerina, L., Parmer, E., and Goodman, M.J. (1998). Driver Workload Assessrr~entof Route Guidance System Destination Entry While Driving: A Test Track Study, Proceedinas of the 5th ITS World Conaress, Seoul, Korea, CD-ROM.
Wietwille, W.W., Dingus, T.A., and Hanowski, R.J. (1999). Development of a Model and Updated Computer Program for Assessment and Evaluation of Task Demands Associated with Complex In-Vehicle Information Systems, paper to be presented at Vision in Vehicles 8, Boston, MA, August.
APPENDIX A
-
RESEARCH AT APPLIED PSYCHOLOGICAL SERVICES
Siegel and his colleagues developed two methods for evaluating displays usirig figures of merit, the Display Evaluation Index (DEI) and the Analytic Profile System (APS). Although these methods do not strictly predict task time, the parameter!; that affect task time are the same as those that influence the figures of merit. DEI is the weighted product of several factors, with each factor varying from 0 to 1 (perfect), as well as the product of those factors (Siegel, Miehle, and Federman, 1964). The implication of the multiplicative combination is that "a chain is only as stror~gas its weakest link." The factors in DEI include complexity, directness, data transfer, encoding, time, match, and critical links (Table 12). Siegel, Miehle, and Feder~man (1964) report that DEI ratings of various radar and radio units were in higher agreement with the mean ratings of human factors experts than the individual experts with each other. There are no published automotive examples of DEI use. Table 12. Factors in DEI
-i
Explanation To compute this factor, links are established between displays and I - I controls in accordance with the probability of successful information I transfer. (See Siegel, Miehle, and ~ederman,1963.) Ideally, there is only one link between each display and each control. directness ~ l t h o u g hredundancy can reduce the likelihood of -a user error, multiple links are not desired. Redundancy is the sum of the number of controls and display squared divided by 2 times the number of information and instruction links times the sum of the number of controls and displays. data transfer This represents the extent to which information is in a ready-to-use form. To compute the data transfer factor, the interface must first be represented as an analog circuit or a logical equivalent. The factor is equal to 2 divided by the number of control and display element!; times the number of gate,mixer, and computation boxes in (he diagram. encoding The encoding factor only applies to controls and displays with I:? or more independent states and are controlled by binary devices (c?.g., toggle switches). Siegel, Miehle, and Federman (1964) provide a nomogram to determine this factor. This is the relationship between the time required to complete the task time (estimated using information theory) and the time available to complete 1 it. The estirr~atedtime is equal to 0.15 + 0.49 times the number of digits. The factor is equal to the number of digits divided by 16, with tha~t expression multiplied by the cube of the time available divided by the actual tirne. Where the time available exceeds the actual time an additional complex value is added to the cube ratio term. The match factor considers if the amount of information resented is match to complete the intended act. Usually it is 0. factor, represents the extent to which transfers, I completed correctly, cannot be repeated and will result in a task failure. Factor complexity
1 1
In the Analytic Profile System raters score a display interface on seven dimensions (stimulus numerosity, primary coding, contextual discrimination, structure scanning, critical relationships, cue integration, cognitive processing activity) by responding to a series of questions for each dimension (Siegel, Fischl, and Macpherson, 1975). For example, the stimulus numerosity dimension, a sample question might be "At first glance, the interface seems to be relatively uncluttered." The values from the seven dimensions are combined to form a total score. See Table 13. Although Siegel, Fischl and Macpherson (1975) present an example of an automobile instrument-panel evaluation, no other automotive applications of this method have appeared in the literature. Table 13. Example Questions for the Analytic Profile System Example item At first glance the interface seems to be relatively . uncluttered. The overall format of this display seems to be a natural primary coding and proper one. contextual discrimination The things presented seem to fall into natural groupings. The information seems well presented for the decisions structure scanning which have to be made. The influence that most displayed items have on other critical relationships displayed items is reasonably apparent, The way the information is presented seems quite cue integration conducive to user integration of this information. Considerable intermediate information processing is cognitive processing required of the user. activity Dimension stimulus numerosity
7
APPENDIX B
- EXAMPLE CALCULATION
4.0 Calculation Method 4.1 Overview The basic approach involves top-down, successive decomposition of a task. Tlhat is, the analyst takes a task performed by the driver and breaks the task down into steps, and for each step identifies the human and device task operators. As a matter of practice, analysts sometimes get stuck using this approach because they are not sure how to decompose a subtask. In those cases, utilizing a bottom-up approach rnay overcome such roadblocks. The original approach assumes error-free performance, well-learned tasks, and particular locations of controls, assumptions all violated in motor vehicles. Accordingly, compensations have been included in the method described here. The original method is described in some detail in Card, Moran, and Newell (1980), though modifications have been made (e.g., Kieras, 1998) to improve the accuracy of lthe method and modify the parameters to more closely approximate the time in motor vehicles. More specifically, the general process is: 1. Obtain a working model of the device, a simulation of it, a videotape of someone using it, or a step-by-step operational description along with all supporting documentation (quick reference card, user manual). Also needed is the city and street database used, as well as any other data the system might access (e.g., dynamic traffic information). Have those items in hand while calculating estimates. 2. Identify the major operational goals (for example, obtain guidance).
3. For each major goal, identify the associated subgoals. Subgoals may be at multiple levels.
4. For each particular goal or subgoal, identify the methods used to achieve each goal or subgoal. Use words to describe the methods. For this step, camcorder-quality records of a few typical users operating the interface can be helpful in identifying where users may choose to pause to make decisions. Videotapes provide a useful record of screen actions and example screens serve to document the interface for analysis. When recording, be sure the camcorder is almost perpendicular to the test screen and blockage due to the user's hand is minimized. Slight departures from normality combined with painting the sides of switches contrasting colors makes the depression of short-throw switches easier to see on the recording. Also make sure the image is closely cropped around the display so the change of single characters is readily apparent on the recording.
5. Convert the wordlsentence-based description of the methods into a computerprogram-like format (pseudocode).
6. Identify the assumptions with regard to the knowledge of test users of various methods of task completion, the extent to which switch operation and cognitive activities are completed in parallel, the use of shortcuts, etc. Table 14 shows some of the basic assumptions. For actions performed in parallel, use the completion time of the most time consuming of the parallel actions to estimate total task-completion time.
Table 14. Computational Assumptions Assumption error-free performance
routine cognitive task
automotive context (The original model was developed for predicting task times in an office.) warm start use only visible, noncognitively loading shortcuts
Comments The computational method assumes drivers do not make any mistakes in obtaining and entering information. In fact, errors can be quite high, ranging from 10 to 50 % of the trials.
Adjustment Rather than attempting to determine the probability of each error and the time to correct it, an overall correction penalty may be included in the estimate. The method assumes that drivers Model estimates are know what to do at each step. In fact, improved by including navigation system use is not a highly additional mental learned task and drivers sometimes operations where forgetting forget what to do. is likely to occur. Adjustments for this are made by using parameters from in-vehicle tasks rather than office tasks. The position of a mouse varies from Utilize automotive-specific movement to movement but estimates of reach and automotive controls do not. However, movement time. Evaluators automotive controls may require may wish to develop their greater reach accuracy. In addition, own operator value or vehicle motion may elevate times to correction factors, as well as reach for controls slightly additional application rules to improve estimates. For most tasks, the navigation is Assume starting from the assumed to be on and the disclaimer "main menu." screen is cleared. Ignore methods of which Many of the goals can be achieved using more than one method. Some only experts would be shortcuts, while visible, are not simple, aware, or that are For example, if the goal was to scroll cognitively loading (such as reciting the alphabet to a name starting with the letter "u" and the initial point was the letter "a," backwards). Data on the in some systems, the optimal method frequency of use of shortcuts is needed. to get there would be to scroll backwards in the alphabet (a->z, z -> y, y -> x, x -> w, w -> v). See note 1,
include system response time (except for computationally interrupted tasks Perfect knowledge of the address
Delays occur as systems scroll lists, update maps, and so forth.
Since the individual waits for these updates, system response time should be included in the task time.
For ease of computat:ion, Likely problems include (1) incomplete knowledge of the city of assume the complete the destination (is the street address address is known. in Ann Arbor or Ann Arbor Township), (2) missing compass headings for streets (N 1st St vs. S 1st St), and missing street descriptors (Allen Drive vs. Allen Road). Normally people try ta en,ter destinations, and only when they get to the last step of entering an address can they determine if the address is the desired one, or even if it is in the data base. Correctness is often determined by having a route computed and then looking at a map for the destination.
Note 1: By observation, only expert users make use of alphabetic entry combined with backwards scrolling to retrieve city and street names. For example, the quickest way to select the city "Aurora" in the Great Lakes data base for the PathMaster navigation system (a scrolling list interface) is to use the alphabetic advance (right arrow key) to go from Aida (1st "A" entry) directly to Bannockburn (1st "B" entry) and then scroll backwards one entry, rather than pressing the down arrow 11 times (Aida, Addison, Algonquin, Allen Park, Alsip, Alto, Ann Arbor, Antioch, Arlington Heights, Auburn Hills, Aurora). 7. Determine the appropriate mental, keystroke, and other operators for each step. Entry into a spreadsheet is recommended.
The most challenging aspect of this step is to decide where to include mental operators. Suggested rules for where to include them follow. a. Provide at least one mental operator when a menu must be read or a major decision needs to be made. b. If a decision can be fully anticipated because all of the information needed is visible well in advance of the sequence, a mental operator is not included in the sequence. So, when scrolling through a list entry-by-entry (assuming the entries are shown on a display), the sequence of operators would be "cursor, cursor, cursor," not "mental, cursor, mental, cursor, mental, cursor" because the user could think about what needed to be done next in parallel with pressing a cursor key. However, if the cursor action clears the screen (e.g., in alphabetic advance), then a mental operator would be included because the user needs to read the display.
The sequence would be "mental, next screen, mental, next screen," etc. There are times, such as when scrolling well into the alphabet, that this exception needs to be modified, such as when scrolling to the middle of the alphabet (and some of the mental operators are omitted). This situation will be covered in future revisions of this document. c. When scrolling through long lists, a mental operator occurs just before pressing the enter key to confirm the correct item is to be selected. 8. Enter the times for each operator. 9. Add up the execution times for each operator. This is easiest to do using a spreadsheet. 10. Adjust the keystroke times using the age multiplier. 11. Verify that the times make sense and revise as needed. Where to include mental operators needs particular attention. This may also be a useful time to review a videotape of a typical user interacting with the system. When played back at slow speed on a frame-accurate VCR (such as a Panasonic AG550), those tapes can be used to provide rough estimates of screen update and calculation times. Review of Tijerina's (Tijerina, Parmer, and Goodman, 1998; Tijerina, 1999) and UMTRl's research (Manes, Green, and Hunter, 1998) may prove to be useful. One quick method to verify the time estimates is to have a colleague, most likely a young engineer who has some familiarity with the interface, perform the task in question without using shortcuts only an expert would know. The colleague's time will serve as a ballpark estimate of the total task time for young drivers, though the colleague's familiarity with the interface may lead to some mental operators being omitted.
Annex 1
- Calculation Example
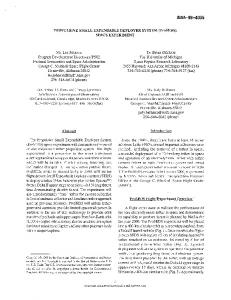
Following is an example of entering Paul Green's office address (2901 Baxter Road, Ann Arbor, Michigan) into a Rockwell Pathmaster/Hertz Neverlost, Magellan Pathmaster (software version 3.31) with the Great Lakes data base (version 30J.0372.01) loaded. Readers should note that the data base is fluid, so that some short cuts may be available depending upon the recent driving history. The example that follows uses the street address method. It assumes that the address has not been recently visited (so it is not on the guidance history list) nor has Ann Arbor (so the city is not on the city shortcuts list). 1. Obtain a working model of the device and the software. Figure 1 shows the driver interface of the Magellan PathMaster, the example case.
display
I
1
(-) zoom inw (+) zoom out brightness dial Figure 1. PathMaster user interface 2. Identify the major operational goals (enter a street address, enter an intersection). 3.
For each major goal, identify the associated subgoals. Subgoells may be at multiple levels. In this example, the goal is to enter an address using the street-address meithod. Below are the major subgoals.
Assumption: The starting point is the destination-method selection screen. After the title screen clears (by itself) and the driver clears the disclaimer screen, this screen appears. Goal: Enter the destination using the street-address method. Goal 0: Move a hand to the device. Goal 1: Select destination entry via street-address mode. Goal 2: Select a city. Goal 3: Select a street. Goal 4: Select a street address. Goal 5: Select route criteria.
4. For each particular goal or subgoal, identify the methods used to achieve each goal or subgoal. Goal 0: Move a hand to the device, Reach for the navigation device. Goal 1: Select destination entry via street-address mode. Find the destination entry item on the initial menu and select it. Goal 2: Select a city. Scroll through the list of cities until the desired city is found. If the first letter of the city name does not match the first letter for the desired name, use the up and down arrow keys until a matching first letter is found. Then use the right and left arrows to scroll through the list of cities one city at a time, When a match is found, select it. Shortcut: If the city was recently visited, it appears on the recent list at the beginning of the city list. Use the up arrow keys to scroll to a possibly matching name. In all cases, when a match is found, select it. Goal 3: Select a street. This procedure is similar to that for selecting a city, except that a street name is being matched, not a city name. Goal 4: Select a street address. Compare the first column of the desired street address with the display address. If the columns values match, move to the next column (using the right and left arrow keys). If they do not match, then use the up and down arrow keys to increase or decrease the displayed value to match the desired address. When all the values match, select the address (by hitting enter). Goal 5: Select route criteria. Select the desired criteria from the list of three shown.
5. Convert the wordlsentence-based description of the methods into a computer-program-like format. Identify the calculations assumptions with regard to knowledge of , various methods, the extent to which switch operation and cognitive activities are completed in parallel, etc. Table 14 shows some of the basic assumptions. Goal 0:Move a hand to the device. Reach for the device. Goal 1: Get to the desired destination entry mode. Find the destination entry item on the initial menu and select it.
Where do you want to go?
I Street address Intersection Points of Interest Freeway Entrancelexit Guidance Historv ~ s e to A select, and press ENTER
v
Figure 2. Route Criteria Screen Read the "destination mode" (where) screen and search for "street address'" Press the enter key to select the first entry. Assumption: The normal process of selecting an item from a list is: 1: Read the list and find the desired item. 2. Scroll down to the desired item. 3. Confirm the desired item is highlighted. 4. Select the item by pressing the enter key. However, when the desired item is the first item in the list, steps 2 and 3 are! omitted. For long lists, the process of pressing keys (to scroll) down and reading the list appear to occur in parallel, with the keypress times determining the scrolling completion time. The final confirmation, however, still occurs. Goal 2: Select a city. After the city menu has appeared, scroll through the list of cities until the desired city is found. (See Figure 3.) If the first letter of the city name does not match the first letter for the desired name, use the up and down arrow keys until a match of thle first
letter is found. Then use the right and left arrows to scroll through the list of cities one city at a time. When a match is found, select it. Shortcut: If the city was recently visited, it appears on the recent list at the beginning of the city list. Use the up arrow keys to scroll to a possibly matching name. In all cases, when a match is found, select it. How often this shortcut is possible is unknown.
I
Select City STATE: MICHIGAN
Select City
I AIDA
ADDISON ALGONQUIN ALLEN PARK
Use
A
v to select, and press ENTER
~seA to select, and press ENTER
v
Figure 3. City screens Method for goal: find matching entry in alphabetized list using scrolling method wait for the beginning of the city listing to appear 1: read highlighted item and decide if 1st letter of current entry matches desired city 2: if first pass, then select method (pure or alpha scroll) if not matching Ist letter press bottom of round switch (4-way cursor) to go to next letter go to step 1 (decide if match, note: reading occurred earlier) if matching 1st letter current letter = second letter compare current letter of highlighted item with spelling of desired city 2.1 if current letter matches and last letter confirm correct entry hit enter go to exit: next goal if current letter matches and not last letter increment current letter go to 2.1 (compare current letter) if current letter does not match press key to scroll down 1 entry (see note 1) go to 2.1 exit: next goal Note 1: As noted above, when scrolling long lists for in-vehicle systems, observation has shown that reading text and pressing keys to scroll the list appear to occur in parallel. The predominant times are for keypresses.
Note 2: By observation, only expert users make use of alphabetic entry combined with backwards scrolling to retrieve city and street names, so the reverse alphabetic scrolling method was not considered. Goal 3: Select a street. This procedure is similar to that for selecting a city, except that a street namle is being matched, not a city name. For convenience, it is repeated here. After the list of streets has appeared, scroll through the list of streets until the desired street is found. If the first letter of the street name does not match the fi~rstletter for the desired name, use the up and down arrow keys until a match of the first letter is found. Then use the right and left arrows to scroll through the list of streets one street at a time. When a match is found, select it. (See Figure 4.) Note: There is no shortcut list of recently visited streets.
Select Street Name
Select Street Name
S 4TH AVE N 4TH ST
3 LS DR 3 RD DR N 4TH AVE or scroll upldown 4 or skip map letter
A
v
Select Street Name AVON RD AVONDALE AVE AWIXA RD nR
BALDWIN AVE BALDWIN PL BALMORAL CT BANDER DR A or 7 scroll up/down 4 or b skip map letter
ABERDEENDR ACADEMIC DR ACER CT
A or scroll upldown 4 or b skip map letter
Select Street Name BANDER DR BARBER AVE BARCLAY CT TRI
BARNYARDBEND BARRINGTON PL BARRISTER DR BARRISTER RD A or 7 scroll up/down 4 or b skip map letter
1
Select Street Name
Select Street Name
BARRISTER RD BARRY KNOLL DR BURTON DR
BARTON FARM DR N BARTON SHORE DR BATESON CT
F RARTnN I N
I
BARTON FARM CT N BARTON SHORE DR BATESTON CT BATH CT or 7 scroll upldown 4 or skip map letter
A
.
RATH CT
I BAXTER RD
BAY HILL CT BAY RIDGE DR BAYBERRY CIR BAYLIS DR o r 7 scroll upldown 4 or skip map letter
A
I
.
Figure 4. List of Street Names Method for goal: find matching entry in alphabetized list using scrolling method wait for list of streets to appear 1: read highlighted item, decide 1st character if name of current entry matches desired street (see note 1) 2: if first pass, selected method (pure or alpha scroll) if not matching 1st character press bottom of round switch (4-way cursor) to go to next character go to step 1 (to read the next item) if matching Ist character current character = second character compare current character of highlighted item with spelling of desired street 2.1 if current character matches and last character is current character confirm correct entry hit enter go to next goal if current character matches and not last character increment current character go to 2.1 (compare current character ) if current character does not match displayed character press key to scroll down 1 entry (see note 2) go to 2.1 exit: next goal Note 1: In the initial name comparison, N, S, El and W (e.g., N 1ST ST) are ignored. Note 2: This sequence only approximates that which subjects use as some chunking of the street designators (St., Ave., Dr., etc.) is likely. However, that chunking has only a minor impact on the total task time, so for ease of calculation, chunking can be ignored.
Goal 4: Select a street address. After the screen showing the range of streets appears, compare the first column of the desired street address with the display address. If the columns values match, move to the next column (using the right and left arrow keys). If they do not match, then use the up and down arrow keys to increase or decrease the displayed value to match the desired address. When all the values match, select the address (by hitting enter). (See Figure 5.) -
I
Enter Street Number
Enter Street Number
ADDRESS: 3299
ADDRESS: 2299
increase
increase
A move left
1
A b move right
v decrease
move left 4
b move right
v decrease
-
Enter Street Number
Enter Street Number
ADDRESS: 2999
ADDRESS: 2909
increase move left 4
A v
increase
A b move right
decrease
move left 4
b move right
v decrease
Enter Street Number
I
ADDRESS: 2901 increase
A move left 4
b move right
v decrease
Figure 5. Street Number Screens Method for incrementingldecrementing numbers using 4-way cursor switch (round key Recall the desired street address, read the maximum allowable street address, and if necessary, pad the desired name with leading zeros to match the number of characters in the maximum value. current digitdeft most digit determine next field to change: Decide if the value in the current display field is the same as that in the recalled field 1, decide if value of currently displayed field c, =, > value of recalled field case 1: currently displayed field = value of recalled field decide if last field if last field confirm displayed = recalled street number hit enter key go to exit if not last field go to next field: press right side of round key (four-way cursor) current digit = next digit go to 1 case 2: displayed > recalled compute difference in current field = displayed - recalled decrease display value by pressing bottom of key "difference" times confirm displayed = recalled go to case 1 case 3: displayed c recalled (note 1) Note 1: Experts realize that addresses form a circularly linked list. So, if the displayed address is 9 Main Street and the desired address is 2 Main Street, the optimum
strategy is to press the up arrow (increase) key three times (9->0, 0->I, 1->2) rather than the down arrow (decrease) seven times (9->8, 8->7, 7->6, 6->5, 5->4, 4->3, 3->2). The efficiency with which this shortcut is used will depend on experience. For example, early in becoming an expert, the user may use the up arrow key to go from 9 -> 0, but not 9->2, evert though use of the up arrow requires fewer keystrokes. Goal 5: Select route criteria. After the route-criteria screen appears, select the desired criteria from the list of three shown. (See Figure 6.) Note: At this point, the task timing ends and the person returns to driving. However, several seconds are required for the system to calculate a route and display the route. That added time is not included in the total task time.
I
Select Route Criteria
1 Shortest Time Route I ~ o suse t of ~ w y s I Least Use of Fwys
I I
~ s e to A select, and press ENTER
v
Figure 6. Route Selection Criteria Read the "route criteria" screen and search for "shortest time route" Press the enter key to select the first entry. Note: Assumptions are the same as for the address-entry method selection described previously. 7. Determine the appropriate mental, keystroke, and other operators that are appropriate for each step. 8. Enter the times for each operator. 9. Adjust the times based on the age distribution of the expected user population. For young subjects (18-30), use the keystroke times as is. For middle-aged subjects (40-55), multiply the keystroke tinnes by 1.4. For older subjects (>65), multiple the keystroke times by :2.2.
10. Add up the execution times for each operator. This is easiest to do using a spreadsheet.
For these steps, see the spreadsheet the follows. 11. Verify that the times make sense and revise as needed.