CMU-CS-05-120, CMU-CALD-05-102. School of Computer Science. Carnegie Mellon University ... that sensors have a fixed sensing radius and to solve the task as an instance of the art-gallery problem (c.f., (Hochbaum ...... Miller, 1992).
Near-Optimal Sensor Placements in Gaussian Processes
Carlos Guestrin
Andreas Krause
Ajit Singh
June 2005 CMU-CS-05-120, CMU-CALD-05-102
School of Computer Science Carnegie Mellon University Pittsburgh, PA 15213
Abstract When monitoring spatial phenomena selecting the best locations for sensors is a fundamental task. To avoid strong assumptions, such as fixed sensing radii, and to tackle noisy measurements, Gaussian processes (GPs) are often used to model the underlying phenomena. A commonly used placement strategy is to select the locations that have highest entropy with respect to the GP model. Unfortunately, this criterion is indirect, since prediction quality for unsensed positions is not considered, and thus suboptimal positions are often selected. In this paper, we propose a mutual information criterion that chooses sensor locations that most reduce uncertainty about unsensed locations. We first show that choosing a set of k sensors that maximizes the mutual information is NP-complete. By exploiting the submodularity of mutual information we propose a polynomial-time algorithm that guarantees a placement within (1 − 1/e) of the maxima. This algorithm is extended to exploit local structure in the Gaussian process, significantly improving performance. Finally, we show that the sensor placements chosen by our algorithm can lead to significantly better predictions through extensive experimental validation on two real-world datasets.
Keywords: Gaussian Processes; Experimental Design; Active Learning; Spatial Learning; Sensor Networks
(b) Temperature correlations
40
0
-0 .15
5 0. 3
0.3 0.2 5
0.3
43
0.2 0 .2 0.1
1 0.
44
45
0.1
46
0
0.1
5
0 .1
0.0
5
0
0.1 5
05 0.
5
0.0
0 0 .1.2 5
51 5 0.00. 0.1 0.2
1
0 .2 5
0 -0.05 0.05 0.1 15 0. 0.2
- 124 35
-0.1
-0 .
0.8
1
30
-0.1 05 -0.
.0 -0
05
0
0.15
0.7 0.7 5
0.8
0 .65
0 . 0.9 75
0 .9
0.95
00.9 .95 0.85
0.8
0. 95
25
0. 95
-0 .
0
15
0 .8 5
05
5 0.0
10
0.6 0.7 20
9 0. 5 0.8
0 .9 5
1 5
- 123
-0 .05
. -0
0
1
1
- 122
0. 95
5 0.9
000. .8 .985
5
- 121
0 0
0.4
0.9
0.85
(a) 54 node sensor network deployment
0.9 5
0.85
0.9
0.95
- 120
5
05 -0.
0.9
0 .95
0
- 119
0 .8
-0 .1
15 -0.
0.75 0.7
5
- 118
0 .75
0.8 5
15
10
-0. 1
- 117
5 -0 .0
9 0.
0.8 0.8 5
0.7 5
0.7
-0.15
0.6 5
75 0.
0.5 5 0.5 0.6
0.85
0.7
5 0.6
0.6
55 0.
65 0. 7 0. 0 .75 0.8 0 .85
0.95
20
0.50.6
0.5 0.65
0.9
25
0.1
0.05 47
48
(c) Precipitation correlations
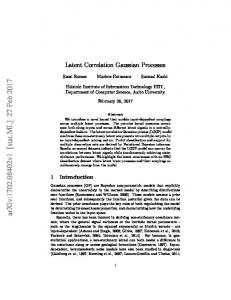
Figure 1: Correlation between a sensor placed on the blue square and other possible locations for: (b) temperature data from the sensor network deployment in Fig. 1(a); (c) precipitation data from measurements made across the Pacific Northwest, Fig. 6(a).
1
Introduction
When monitoring spatial phenomena, such as temperatures in an indoor environment as shown in Fig. 1(a), using a limited number of sensing devices, deciding where to place the sensors is a fundamental task. One approach is to assume that sensors have a fixed sensing radius and to solve the task as an instance of the art-gallery problem (c.f., (Hochbaum & Maas, 1985; Gonzalez-Banos & Latombe, 2001)). In practice, however, this assumption is too strong; sensors make noisy measurements about the nearby environment, and this “sensing area” is not usually characterized by a regular disk, as illustrated by the temperature correlations in Fig. 1(b). Furthermore, note that correlations can be both positive and negative, as shown in Fig. 1(c). Often, correlations may be too weak to enable prediction from a single sensor, suggesting the need for combining data from multiple sensors to obtain accurate predictions. An alternative approach from spatial statistics (Cressie, 1991), making weaker assumptions, is to use a pilot deployment or expert knowledge to learn a Gaussian process (GP) model for the phenomena, a non-parametric generalization of linear regression that allows to represent uncertainty about the sensed field. The learned GP model can then be used to predict the effect of placing sensors at particular locations, and thus optimize their positions. This initial GP is, of course, a rough model, and a sensor placement strategy can be viewed as an inner-loop step for an active learning algorithm (MacKay, 2003). Typical sensor placement techniques greedily add sensors where uncertainty about the phenomena is highest, i.e., the highest entropy location of the GP (Cressie, 1991). Unfortunately, this criterion suffers from a significant flaw: entropy is an indirect criterion, not considering the prediction quality of the selected placements. The highest entropy set, i.e., the sensors that are most uncertain about each other’s measurements, is usually characterized by sensor locations that are as far as possible from each other. Thus, the entropy criterion tends to place sensors along the borders of the area of interest (Ramakrishnan et al., 2005), e.g., Fig. 2(c). Since a sensor usually provides information about the area around it, a sensor on the boundary “wastes” sensed information. In this paper, we address this issue by proposing a new optimization criterion, mutual information, that seeks to find sensor placements that are most informative about unsensed locations. Our optimization criterion directly measures the effect of sensor placements on the posterior uncertainty of the GP. We first prove that maximizing mutual information is an NP-complete problem. Then, by exploiting the fact that mutual information is a submodular function (Nemhauser et al., 1978), we design an approximation algorithm that guarantees a constant-factor approximation of the best set of sensor locations in polynomial time. To the best of our knowledge, no such guarantee exists for other GP-based sensor placement approaches. Though polynomial, the complexity of our basic algorithm is relatively high – O(kn4 ) to select k out of n possible sensor locations. If we trim low covariance entries, exploiting locality in sensing areas, we reduce the complexity to O(kn).
2
Gaussian processes
Consider, for example, a sensor network, such as the one we deployed as shown in Fig. 1(a), that measures a temperature field at 54 discrete locations. In order to predict the temperature at one of these locations from the other sensor readings, we need the joint distribution over temperatures at the 54 locations. A simple, yet often effective (Deshpande
1
22 10
21 20
5
19 0 40
18 17 40
30
30 20
30 20
25
30
20 15
20
10
10 0
10
10
0
5 0
(b) Variance of temperature prediction
2
4
6
8
(a) Temperature prediction using GP
0
0
5
10
15
20
(c) Entropy vs. MI placements
Figure 2: Using all sensors (a) Predicted temperature (b) predicted variance. An example of placements chosen using entropy and mutual information in (c). Diamonds indicate the positions chosen using entropy; squares the positions chosen using MI. et al., 2004), approach is to assume that the temperatures have a (multivariate) Gaussian joint distribution. Here, we have a set of n random variables X with joint distribution: P (X = x) =
1
1
(2π)n/2 |Σ|
e− 2 (x−µ)
T
Σ−1 (x−µ)
,
where µ is the mean vector and Σ is the covariance matrix. If we consider indexing each variable Xi ∈ X by i, then we will have a finite set of indices V, in our sensor network example |V| = 54. Interestingly, if we consider any subset of our random variables, A ⊆ V, then their joint distribution will also be Gaussian. In our sensor network example, we are not just interested in temperatures at sensed locations, but also at locations where no sensors were placed. In such cases, we can use regression techniques to perform such prediction (Golub & Van Loan, 1989). Although linear regression often gives excellent predictions, there is usually no notion of uncertainty, e.g., for Fig. 1(a), we are likely to have better temperature estimates at points near existing sensors, than in the two central areas that were not instrumented. A Gaussian process (GP) is a natural generalization of linear regression that allows us to consider uncertainty about predictions. Intuitively, a GP generalizes multivariate Gaussians to consider an infinite number of random variables. In analogy to the multivariate Gaussian above where the the index set V was finite, we now have an (possibly uncountably) infinite index set V. In our temperature example, V would be a subset of R2 , and each index would correspond to a position in the lab. GPs have been widely studied, c.f., (MacKay, 2003; Paciorek, 2003; Seeger, 2004). An important property of GPs is that for every finite subset A of the indices V, the joint distribution over these random variables is Gaussian, e.g., the joint distribution over temperatures at a finite number of sensor locations is Gaussian. In order to specify this distribution, a GP is associated with a mean function M(·), and a symmetric positive-definite kernel function K(·, ·), often called the covariance function. In this paper, we do not make other limiting assumptions, 2
such as K(·, ·) being stationary or isotropic. For each random variable with index u ∈ V, its mean µu is given by M(u). Analogously, for each pair of indices u, v ∈ V, their covariance σuv is given by K(u, v). For simplicity of notation, we denote the mean vector of some set of variables A by µA , where the entry for element u of µA is M(u). Similarly, we denote their covariance matrix by ΣAA , where the entry for u, v is K(u, v). The GP representation is extremely powerful. For example, if we observe a set of sensor measurements xA corresponding to the finite subset A ⊂ V, we can predict the value at every point y ∈ V conditioned on these measurements, P (Xy | xA ). The distribution of Xy given these observations is a Gaussian whose conditional mean µy|A and variance 2 σy|A are given by: µy|A 2 σy|A
= µy + ΣyA Σ−1 AA (xA − µA ), = K(y, y) −
ΣyA Σ−1 AA ΣAy ,
(1) (2)
where ΣyA is a covariance vector with one entry for each u ∈ A with value K(y, u). Figures Fig. 2(a) and Fig. 2(b) show the posterior mean and variance derived using these equations on 54 sensors at Intel Labs Berkeley. Note that two areas in the center of the lab are not instrumented. These areas have higher posterior variance, as expected. An important property of GPs is that the posterior variance (2) does not depend on the actual observed values xA . Thus, for a given kernel function, the variances in Fig. 2(b) will not depend on the observed temperatures.
3
Optimizing sensor placements
Usually, we are limited to deploying a small number of sensors, and thus must carefully choose where to place them. In spatial statistics this is called sampling design: finding the k best sensor locations out of a finite subset V of possible locations, e.g., out of a grid discretization of R2 . An often used heuristic is to start from an empty set of locations, A = ∅, and greedily add placements until |A| = k. Usually, at each iteration, the greedy rule used is to add the location y ∈ V \ A that has highest variance according to Eq. (2) (McKay et al., 1979; Cressie, 1991), i.e., the location that we are most uncertain about given the sensors placed thus far. Since, for a fixed kernel function, the variance does not depend on the observed values, this optimization can be done before deploying the sensors. Note that the (differential) entropy of a Gaussian random variable Y conditioned on some set of variables A is a monotonic function of its variance: H(Y |A) =
1 1 1 log(2πeσY2 |A ) = log σY2 |A + (log(2π) + 1), 2 2 2
(3)
where, with some abuse of notation, we use A to refer to a set of indices and the corresponding set of random variables. If we define the set of selected locations as A = {Y1 , . . . , Yk }, using the chain-rule of entropies, we have that: H(A) = H(Yk | Y1 , . . . , Yk−1 ) + ... + H(Y2 | Y1 ) + H(Y1 ). Thus, we can view the greedy variance heuristic as an approximation to the problem argmax H(A),
(4)
A:|A|=k
that is, finding the set of sensor locations that has maximum joint entropy. This is an intuitive criterion for finding sensor placements, since the sensors that are most uncertain about each other should cover the space well. Unfortunately, this entropy criterion suffers from the problem shown in Fig. 2(c), where sensors are placed far apart along the boundary of the space and information is “wasted”. This phenomenon has been noticed previously by Ramakrishnan et al. (2005), who proposed a weighting heuristic. Intuitively, this problem arises because the entropy criterion is indirect: rather than considering prediction quality over the space of interest, the entropy criterion only considers the entropy of the selected sensor locations. In this paper, we propose a new optimization criterion that addresses this problem: we search for the subset of sensor locations that most significantly reduces the uncertainty about the estimates in the rest of the space. 3
More formally, we define our space as a discrete set of locations V = S ∪ U composed of two parts: a set S of possible positions where we can place sensors, and an additional set U of positions of interest, where no sensor placements are possible. The goal is to place a set of k sensors that will give us good predictions throughout V. Specifically, argmax H(V \ A) − H(V \ A | A),
(5)
A⊆S:|A|=k
that is, the set A that maximally reduces the entropy over the rest of the space V \ A. Note that our criterion H(V \ A) − H(V \ A | A) is equivalent to finding the set that maximizes the mutual information I(A; V \ A) between A and the rest of the space V \ A. On the same simple example in Fig. 2(c), this mutual information criterion leads to intuitively appropriate central sensor placements that do not have the “wasted information” property of the entropy criterion. Our experimental results in Sec. 6 further demonstrate the advantages in performance of our mutual information criterion. Entropy and mutual information are both hard to optimize. Maximizing either criteria is NP-complete. Theorem 1 (Ko et al. (1995)). Given rational M and rational covariance matrix ΣVV over Gaussian random variables V, deciding whether there exists a subset A ⊆ V of cardinality k such that H(A) ≥ M is NP-complete. Theorem 2. Given rational M and a rational covariance matrix ΣVV over Gaussian random variables V = S ∪ U, deciding whether there exists a subset A ⊆ S of cardinality k such that I(A; V \ A) ≥ M is NP-complete. Proofs of all results are given in the appendix.
4
Approximation algorithm
Optimizing our mutual information criterion is an NP-complete problem. We now describe a poly-time algorithm with a constant-factor approximation guarantee.
4.1
The algorithm
Our algorithm is greedy, simply adding sensors in sequence, choosing the next sensor which provides the maximum increase in mutual information. More formally, using F (A) = I(A; V \ A), our goal is to greedily select the next sensor Y that maximizes: � � ¯ − H(A) − H(A|A¯ ∪ Y ) , F (A ∪ Y ) − F (A) = H(A ∪ Y ) − H(A ∪ Y |A) � � ¯ − H(A) − H(V) + H(A¯ ∪ Y ) = H(A ∪ Y ) − H(V) + H(A) ¯ = H(Y |A) − H(Y |A), where, to simplify notation, we write A ∪ Y to denote the set A ∪ {Y }, and use A¯ to mean V \ (A ∪ Y ). Note that the greedy rule for entropy only considers the H(Y |A) part. In contrast, our greedy mutual information trades off uncer¯ which forces us to pick a Y that is “central” with respect to the unselected locations A. ¯ Using tainty with −H(Y |A), the definition of conditional entropy in Eq. (3), Algorithm 1 shows our greedy sensor placement algorithm.
4.2
An approximation bound
We now prove that, if the discretization V of locations of interest in the Gaussian process is fine enough, our greedy b then algorithm gives a (1 − 1/e) approximation to the optimal sensor placement: If the algorithm returns set A, b V \ A) b ≥ (1 − 1/e) I(A;
max
A⊂S,|A|=k
I(A; V \ A) − kε,
for some small ε > 0. To prove this result, we use submodularity (Nemhauser et al., 1978), a property of set functions that intuitively represents “diminishing returns”: adding a sensor Y when we only have a small set of sensors A gives us more 4
Input: Covariance matrix ΣVV , k, V = S ∪ U Output: Sensor selection A ⊆ S begin A ← ∅; for j = 1 to k do σ 2 −ΣY A Σ−1 AA ΣAY Y ∗ ← argmax Y2 ; −1 σ −Σ Σ ¯ ¯ Y ∈S\A: ¯A ¯ ΣAY YA A Y ¯ A=V\(A∪Y )
A ← A ∪ Y ∗; end Algorithm 1:
Approximation algorithm for maximizing mutual information.
advantage than adding Y to a larger set of sensors A0 . Using the “information never hurts” bound, H(Y |A) ≥ ¯ implies H(Y |A ∪ B) (Cover & Thomas, 1991), note that our greedy update rule maximizing H(Y |A) − H(Y |A) that F (A0 ∪ Y ) − F (A0 ) ≤ F (A ∪ Y ) − F (A), when A ⊆ A0 , i.e., adding Y to A helps more than adding Y to A0 . This is exactly the definition of a submodular function. Hence we have the following result: Lemma 3. The function A 7→ I(A; V \ A) is submodular. � A submodular set function F is called nondecreasing if F (A ∪ Y ) ≥ F (A) for Y ∈ V. In (Nemhauser et al., 1978), it is proven that for nondecreasing submodular set functions F with F (∅) = 0, the greedy algorithm guarantees a performance guarantee of (1 − 1/e)OP T , where OP T is the value of the optimal subset of size k. This greedy algorithm is defined by selecting in each step the element Y ∗ = argmaxY F (A ∪ Y ) − F (A). This is exactly the algorithm we propose in the previous section. It is clear that F (∅) = I(∅; V) = 0, as required by Nemhauser et al. (1978). However, the monotonicity of our objective function is not apparent, since F (V) = I(V, ∅) = 0, our objective function will increase and then decrease, and, thus, is not monotonic. Fortunately, the proof of Nemhauser et al. (1978) does not use monotonicity for all possible sets, it is sufficient to prove that F is monotonic for all sets of size up to 2k. Intuitively, mutual information is not monotonic when the set of sensor selected locations approaches V. If the discretization level is significantly larger than 2k points, then mutual information should meet the conditions of the proof of Nemhauser et al. (1978). Thus the heart of our analysis of Algorithm 1 will be to prove that if the discretization of the Gaussian process is fine enough, then mutual information is approximately non-decreasing for sets of size up to 2k. More precisely we prove the following result: Lemma 4. Let G be a Gaussian process on a compact subset C of Rm with a positive-definite, continuous covariance 2 kernel K : C × C → R+ 0 . Assume the sensors have a measurement error with variance at least σ . Then, for any ε > 0, and any finite maximum number k of sensors to place there exists a discretization V = S ∪ U, S and U having mesh width δ such that ∀Y ∈ V \ A, F (A ∪ Y ) − F (A) ≥ −ε for all A ⊆ S, |A| ≤ 2k. If the covariance function is Lipschitz-continuous, such as the Gaussian RBF kernel, the following corollary gives a bound on the required discretization level with respect to the Lipschitz constant: Corollary 5. If K is Lipschitz-continuous with constant L, then the required discretization is δ≤
εσ 6 , 4kLM (σ 2 + 2k 2 M + 6k 2 σ 2 )
where M = maxx∈C K(x, x), for ε < min(M, 1). Corollary 5 guarantees that for any ε > 0, a polynomial discretization level is sufficient to guarantee that mutual information is ε−approximately non-decreasing. These bounds on the discretization are, of course, worst case bounds considering sensor placements that are arbitrarily close to each other. We expect the bounds to be very loose in the situations that arise during normal operation of the greedy algorithm, since the algorithm is unlikely to place sensors at such a close proximity. 5
Combining our Lemmas 3 and 4 with the Nemhauser et al. (1978) result, we obtain our constant-factor approximation bound on the quality of the sensor placements obtained by our algorithm: Theorem 6. Under the assumptions of Lemma 4, Algorithm 1 is guaranteed to select a set A of k sensors for which I(A; V \ A) ≥ (1 − 1/e)(OP T − kε), where OP T is the value of the optimal placement. Note that our bound has two implications: First, it shows that our greedy algorithm has a guaranteed minimum performance level of 1 − 1/e when compared to the optimal solution. Second, our approach also provides an upper-bound on the value of the optimal placement, which can be used to bound the quality of the placements by other heuristic approaches, such as local search, that may perform better than our greedy algorithm on specific problems. In many real-world settings, the cost of placing a sensor depends on the specific location. Such cases can often be formalized by specifying a total budget, and the task is to select placements whose total cost is within our budget. We have recently extended the submodular function maximization approach of Nemhauser et al. (1978) to address this budgeted case (Krause & Guestrin, 2005). The combination of the analysis in this paper with this new result also yields a constant-factor (1 − 1/e) approximation guarantee for the sensor placement problem with non-uniform costs.
4.3
A note on maximizing the entropy
As noted by Ko et al. (1995), entropy is also a submodular set function, suggesting a possible application of the result of Nemhauser et al. (1978) to the entropy criterion for sensor placement. The corresponding greedy algorithm adds the sensor Y maximizing H(A ∪ Y ) − H(A) = H(Y |A). Unfortunately, our analysis of approximate monotonicity does not extend to the entropy case: Consider H(Y |A) for A = {Z}, for sufficiently small measurement noise σ 2 , we show that H(Y |Z) can become arbitrarily negative as the mesh width of the discretization decreases. Thus, (even approximate) non-decreasingness does not hold for entropy, suggesting that the direct application of the result of Nemhauser et al. (1978) is not possible. More precisely, our negative result about the entropy criterion is: Remark 7. Under the same assumptions as in Lemma 4, for any ε > 0, there exists a mesh discretization width δ > 0 1 . such that entropy violates the monotonicity criteria by at least ε, if σ 2 < 4πe
5
Local kernels
Greedy updates for both entropy and mutual information require the computation of conditional entropies using Eq. (3), which involves solving a system of |A| linear equations. For entropy maximization, where we consider ¯ H(Y |A) alone, the complexity of this operation is O(k 3 ). To maximize the mutual information, we also need H(Y |A) requiring O(n3 ), for n = |V|. Since we need to recompute the score of all possible position at every iteration of Algorithm 1, the complexity of our greedy approach for selecting k sensors is O(kn4 ), which is not computationally feasible for very fine discretizations (large n). We address this issue by exploiting locality in the kernel function: First, we note that, for many GPs, correlation decreases exponentially with the distance between points. Often, variables which are far apart are actually independent. These weak dependencies can be modeled using a covariance function K for which K(x, ·) has compact support, i.e., that has non-zero value only for a small portion of the space. For example, consider the following isotropic covariance function proposed by Storkey (1999): K(x, y) =
(2π − ∆)(1 + (cos ∆)/2) + 3π
3 2
sin ∆
for ∆ < 2π and 0 otherwise, where ∆ = βkx − yk2 , for β > 0. This covariance function closely resembles the Gaussian kernel K(x, y) = exp(−βkx − yk22 /(2π)) as shown in Fig. 3, but has zero values for distances larger than 2π/β. ˜ ≈ H(Y |B) Even if the covariance function does not have compact support, it can be appropriate to compute H(Y |B) where B˜ results from removing all elements X from B for which | K(X, Y )| ≤ ε for some small value of ε. This 6
1
Local Gaussian
Covariance
0.8 0.6 0.4 0.2 0
2 pi
pi 0 pi Euclidean distance
2 pi
Figure 3: Comparison of local and Gaussian kernels
1
2
3
Input: Covariance ΣVV , k, V = S ∪ U, ε > 0 Output: Sensor selection A ⊆ S begin A ← ∅; foreach Y ∈ S do ˜ ε (Y |V \ Y ); δY ← H(Y ) − H for j = 1 to k do Y ∗ ← arg maxY δY ; A ← A ∪ Y ∗; foreach Y ∈ N (Y ∗ ; ε) do ˜ ε (Y |A) − H ˜ ε (Y |A); ¯ δY ← H end Algorithm 2:
Approximation algorithm for maximizing mutual information using local kernels.
truncation is motivated by noting that: σY2 |B\X − σY2 |B ≤
ε2 K(Y, X)2 ≤ 2 . 2 σX σX
2 This implies that the decrease in entropy H(Y |B \ X) − H(Y |B) is bounded by ε2 /(σ 2 σX ) (using a similar argument as the proof of Lemma 4), assuming that each sensor has independent Gaussian measurement error of at least σ 2 . The ˜ − H(Y |B) is bounded by nε2 /σ 4 . This truncation allows to compute H(Y |A) ¯ total decrease of entropy H(Y |B) much more efficiently, at the expense of this small absolute error. In the special case of isotropic covariance functions, the number d of variables X with K(X, Y ) > ε can be computed as a function of the discretization and the covariance ¯ from O(n3 ) to O(d3 ), which is a constant. kernel. This reduces the complexity of computing H(Y |A)
˜ ε refers to Our truncation approach leads to the more efficient optimization algorithm shown in Algorithm 2. Here, H the truncated computation of entropy as described above, and N (Y ∗ ; ε) ≤ d refers to the set of elements X ∈ S for which | K(Y ∗ , X)| > ε. Using this approximation, our algorithm is significantly faster: Initialization (Line 1) requires O(nd3 ) operations. For each one of the k iterations, finding the next sensor (Line 2) requires O(n) comparisons, and adding the new sensor Y ∗ can only change the score of its neighbors (N (Y ∗ ; ε) ≤ d), thus Line 3 requires O(d · d3 ) operations. The total running time of Algorithm 2 is O(nd3 + kn + kd4 ), which can be significantly lower than the O(kn4 ) operations required by Algorithm 1. We summarize our analysis with the following theorem: Theorem 8. Under the assumptions of Lemma 4, guaranteeing ε1 -approximate non-decreasingness and truncation parameter ε2 , Algorithm 2 selects A ⊆ S such that I(A; V \ A) ≥ (1 − 1/e)(OP T − kε1 − 2knε2 /σ 4 ), in time O(nd3 + nk + kd4 ). It is possible to slightly improve the performance of Algorithm 2 under certain conditions by using a priority queue to maintain the advantages δY . Using for example a Relaxed Heaps data structure, the running time can be decreased 7
0
5
10
15
20
25
30
0
5
10
Number of sensors
15
20
25
30
−200 −300 −400 −500
Average Log−Likelihood
−700 0
5
10
Number of sensors
(a) Morning RMS
Mutual Information Variance
−600
−300 −400 −500 −600
Average Log−Likelihood
0.8 0.6
0.6
0.7
Mutual Information Variance
−700
1.4 1.2
Average RMS
Mutual Information Variance
1.0
1.2 1.0 0.9 0.8
Average RMS
1.1
Mutual Information Variance
15
20
25
30
0
5
10
Number of sensors
(b) Noon RMS
15
20
25
30
Number of sensors
(c) Morning log-likelihood
(d) Noon log-likelihood
12
12.0
10
11.5 11.0
8
0.5
25
0.4
24
0.3
23
0.2
22
10.5
6
Greedy heuristic Maximum of 100 random trials Mean of 100 random trials
26
0.1
21 40
0 40 30
4
Mutual information
12.5
Figure 4: Prediction error on test data for temperatures in sensor network deployment.
30
0
5
10
15
20
25
30
10.0
20
random mean
Number of sensors
(a) Comparison of heuristics
random maximum
random+ PE, max.
greedy+ PE
0
(c) Isotropic model
26
0.5
0.5
25
0.4
0.4
24
0.3
0.3
23
23
0.2
0.2
22
22
0.1
21 40
21 40
0 40
20
20 10
10 0
0
(e) Temperature (entropy)
30 20 10
0 40 30 20
20 10
10 0
0.1
30
20
10 0
0
(f) Temperature (mutual inf.)
0
(d) Predicted variance
24
30
10 0
25
30
20 10
0
26
30
30 20
10
greedy heuristic
(b) Objective values
30
20 10
0
(g) Variance (entropy)
30
30 20
20 10
10 0
0
(h) Variance (MI)
Figure 5: Comparison of predictive behavior of subsets selected using mutual information and entropy. to O(nd3 + kd log n + kd4 ): Line 1 uses the insert operation with complexity O(1), Line 2 calls deletemax with complexity O(log n), and Line 3 uses delete and insert, again with complexity O(log n). This complexity improves on Algorithm 2 if d log n � n. This assumption is frequently met in practice, since d can be considered a constant as the size n of the sensing area grows.
6 6.1
Experiments Indoor temperature measurements
In our first set of experiments, we analyzed temperature measurements from the sensor network shown in Fig. 1(a). We used our algorithms to learn informative subsets of the sensors during two times of the day: between 8 am and 9 am and between 12 pm and 1 pm. Our training data consisted of samples collected at 30 sec. intervals on 5 consecutive days (starting Feb. 28th 2004), the testing data consisted of the corresponding samples on the two following days. In our initial experiments, we used an estimate of the empirical covariance matrix as the input to the algorithms. We first compared the mutual information of the sets selected by our greedy algorithm to random selections and to a hill climbing method that uses a pairwise exchange heuristic. Fig. 5(a) shows that the greedy algorithm provided significantly better results than the random selections, and even the maximum of a hundred random placements did not reach the quality of the greedy placements. Furthermore, we enhanced the random and greedy selections with the pairwise exchange (PE) heuristic, which iteratively finds exchanges improving the mutual information score. Fig. 5(b) presents objective values of these enhanced selection methods for a subset size of 12, for which the maximum over 100 random selections enhanced with PE actually exceeded the greedy score (unlike with most other subset sizes, where random + PE did about as well as our algorithm). Typically, the objective values of random + PE, greedy + PE and greedy did not differ much. Note that as mentioned in Sec. 4, the performance guarantee for the greedy algorithm always provides an online approximation guarantee for the other heuristics.
8
1.15
25
0.95
1.00
Average RMS
1.05
1.10
50 45 40 35
Time (seconds)
30
1.3 1.2 1.1 1.0
15
0.90
20
0.9
Average RMS
Mutual Information Variance
0
5
10
15
20
25
0.0
30
(a) Placements of rain sensors
0.5
1.0
1.5
2.0
Truncation parameter
Number of sensors
(b) Precipitation RMS
(c) Running time
2.5
3.0
0.0
0.5
1.0
1.5
2.0
2.5
3.0
Truncation parameter
(d) Approximation error
Figure 6: Placements (diamonds correspond to entropy, squares to MI), prediction error and running times for precipitation data. Secondly, we computed the greedy subsets of sizes up to 30, using entropy and mutual information as objective functions. For testing the prediction accuracy, we provided the sensor measurements of the selected sensors from the test set, and used Gaussian inference to predict the temperature at the remaining sensor locations. We only let the algorithms choose from the locations where sensors are actually deployed in order to have test set data available for comparison. Figures 4(a) and 4(b) show the average root-mean-squares error (RMS) for these predictions, whereas Figures 4(c) and 4(d) show the average log-likelihoods. Mutual information exhibited superior performance in comparison to the entropy heuristic for increasing set sizes. To gain further insight into the qualitative behavior of the selection criteria we learned a GP model using all sensors over one hour starting at noon. The model was fit with a isotropic Gaussian kernel and quadratic trend for the mean, using the geoR Toolkit (Ribeiro Jr. & Diggle, 2001). Figures 5(c) and 5(d) show the posterior mean and variance for the model. Using our algorithms, 22 sensors were chosen using the entropy and mutual information criteria. For each set of selected sensors, additional models were trained using only the measurements of the selected sensors. Predicted temperature surfaces for the entropy and mutual information configurations are presented in Figures 5(e) and 5(f). Entropy tends to favor placing sensors near the boundary as observed in Sec. 3, while mutual information tends to place the sensors on the top and bottom sides, which exhibited the most complexity and should have a higher sensor density. The predicted variances for each model are shown in figures 5(g) and 5(h). The mutual information version has significantly lower variance than the entropy version almost everywhere, displaying, as expected, higher variance in the unsensed areas in the center of the lab.
6.2
Precipitation data
Our second data set consisted of precipitation data collected during the years 1949 - 1994 in the states of Washington and Oregon (Widmann & Bretherton, 1999). Overall 167 regions of equal area, approximately 50 km apart, reported the daily precipitation. To ensure the data could be reasonably modelled using a Gaussian process we applied a log-transformation, removed the daily mean, and only considered days during which rain was reported. After this preprocessing, we selected the initial two thirds of the data as training instances, and the remaining samples for testing purposes. From the training data, we estimated the empirical covariance matrix, regularized it by adding independent measurement noise1 of σ 2 = 0.1, and used our approximation algorithms to compute the sensor placements optimizing entropy and mutual information. We then used the test set to test prediction accuracy. Fig. 6(b) shows the average RMS prediction error. Mutual information significantly outperforms entropy as a selection criteria – often several sensors would have to be additionally placed for entropy to reach the same level of prediction accuracy as mutual information. Fig. 6(a) shows where both objective values would place sensors to measure precipitation. It can be seen that entropy is again much more likely to place sensors around the border of the sensing area than mutual information. To provide estimates on the covariance structure, we report the 25, 50 and 75 percentiles of the absolute covariance entries as 0.122, 0.263 and 0.442, the maximum was 3.51, the minimum 8.78E−6. For the diagonal entries, the median was 1.70, and the minimum was 0.990. Fig. 6(c) shows that the computation time can be drastically decreased as we increase the truncation parameter ε from 0 to the maximum variance. Fig. 6(d) shows the RMS prediction accuracy for the 20 element subsets selected by Algorithm 2. According to the graphs, the range ε ∈ [0.5, 1] seems to provide the appropriate trade-off between computation time and prediction accuracy. 1 The
measurement noise σ 2 was chosen by cross-validation
9
7
Related Work
Our work falls under the rubric of discrete design. In the spatial setting (Cressie, 1991) notes that�minimizing either the average or maximum predicted variance is used, but that the optimization requires evaluating nk placements or simulated annealing. Other methods ignore the GP, attempting to cover the space using various forms of random sampling, which are compared in (McKay et al., 1979). Pairwise exchange has been used, albeit using the Fedorov delta (Nguyen & Miller, 1992). Such algorithms often fall into local minima, and lack quality-of-solution guarantees. Most closely related to our work is (Ko et al., 1995), which selects the best set of k sensors using the entropy (variance) criteria. Ko et. al. formulate a branch-and-bound algorithm that finds the placement corresponding to a global maxima. This approach, however, does not have a polynomial running time guarantee.
8
Conclusions
In this paper we (i) propose mutual information as a criterion for sensor placement in Gaussian processes, (ii) show the exact optimization in NP-complete, (iii) provide an approximation algorithm that is within (1 − 1/e) of the maximum mutual information configuration, (iv) show how to exploit local structure in GPs for significant speed-ups. Our empirical results indicate the mutual information criteria is often better than entropy, both qualitatively and in prediction accuracy. This work can be used to increase the efficacy of monitoring systems, and is a step towards well-founded active learning algorithms for spatial and structured data. Acknowledgements: This work was partially supported by a gift from Intel Corporation. A. Singh acknowledges the support of NSERC.
Appendix Proof of Theorem 2. Our reduction builds on the proof by Ko et al. (1995), who show that for any graph G, there exists a polynomially related, symmetric positive-definite matrix Σ such that Σ has a subdeterminant (of a submatrix resulting from the selection of k rows and columns i1 , . . . , ik ) greater than some M if G has a clique of size at least k, and Σ does not have a subdeterminant greater than M − ε for some (polynomially-large) ε > 0 if G does not have such a clique. Let G be a graph, and let Σ be the matrix constructed in Ko et al. (1995). We will consider Σ as the covariance matrix of a multivariate Gaussian distribution with variables U = {X1 , . . . , Xn }. Introduce additional variables S = {Y1 , . . . , Yn } such that Yi |Xi = x ∼ N (x, σ 2 ). Note that a subset A ⊆ S, |A| = k, has maximum entropy of all such subsets if and only if the parents ΓA ⊂ U of A have maximum entropy among all such subsets of U. Now note that I(A; (U ∪ S) \ A) = H(A) − H(A|(U ∪ S) \ A) = H(A) − H(A|U), because Yi and Yj are conditionally independent given U. Furthermore, again because of independence, H(A|U) is a constant only depending on the cardinality of A. Assume we could decide efficiently whether there is a subset A ⊂ S such that I(A; V \ A) ≥ M 0 . If we choose σ 2 small enough, then this would allow us to decide whether G has a clique of size k, utilizing the gap ε. ˆ ˆ Proof of Lemma 4. Define K(x, y) = K(x, y) for x 6= y and K(x, x) = K(x, x) + σ 2 to include the sensor noise σ 2 . Since C is compact and K continuous, K is uniformly continuous over C. Hence, for any ε1 , there exists a δ1 such that for all x, x0 , y, y 0 , kx − x0 k2 ≤ δ1 , ky − y 0 k2 ≤ δ1 it holds that | K(x, y) − K(x0 , y 0 )| ≤ ε1 . Assume C1 ⊂ C is a finite mesh grid with mesh width 2δ1 . We allow sensor placement only on grid C1 . Let C2 ⊂ C be a mesh grid of mesh width 2δ1 , which is derived by translating C1 by δ1 in Euclidean norm, and let G1 , G2 denote the restriction of the GP G to C1 , C2 . We assume C1 , C2 cover C in the sense of compactness. We use the notation ˜· to refer to the ˆ is a symmetric strictly positive definite covariance function translated version in G2 of the random variable · in G1 . K ˆ ˆ X, ˜ Y˜ )| ≤ ε1 for all X, Y ∈ G1 . Moreover, since K is positive semidefinite, the smallest eigenvalue and |K(X, Y )− K( ˆ is at least σ 2 . of any covariance matrix derived from K 2 Let A be a subset of C1 and X ∈ C1 \ A. Using (3), we first consider the conditional variance σX|A . By definition, ˜ ˆ ˆ ˜ kY − Y k2 ≤ δ1 , and hence |K(X, Y ) − K(X, Y )| ≤ ε1 for all Y ∈ A. Hence we know that kΣAA − Σ ˜ ˜k2 ≤ AA
10
max min kΣAA − ΣA˜A˜kF ≤ k 2 ε1 . We furthermore note that kΣ−1 (Σ−1 (ΣAA )−1 ≤ σ −2 , and hence AA k2 = λ AA ) = λ −1 −1 −1 kΣ−1 ˜A ˜ − ΣAA )ΣA ˜A ˜ k2 = kΣAA (ΣA ˜A ˜ k2 AA − ΣA −1 −4 2 ≤ kΣ−1 k ε1 . ˜A ˜ − ΣAA k2 kΣA ˜A ˜ k2 ≤ σ AA k2 kΣA
√ We derive kΣX A˜ − ΣXA k2 ≤ kε1 1T k2 = ε1 k, hence −1 −1 2 2 − σX| |σX|A ˜ |, ˜ ΣA ˜ | = |ΣXA ΣAA ΣAX − ΣX A ˜A ˜ ΣAX A −1 −1 2 2 ≤ 2kΣXA − ΣX A˜k2 kΣ−1 ˜A ˜ k2 kΣXA k2 + O(ε1 ), AA k2 kΣXA k2 + kΣAA − ΣA √ √ ≤ 2ε1 kσ −2 M k + σ −4 k 2 ε1 M 2 k + O(ε21 ), � ≤ ε1 kσ −2 M 2 + σ −2 k 2 M + O(ε21 ),
where M = maxx∈C K(x, x). We choose δ such that the above difference is bounded by σ 2 ε. We note that (assuming ˜ w.l.o.g. H(X|A) ≥ H(X|A)) σ2 ˜ = 1 log X|A ≤ log(1+ε) ≤ ε . H(X|A)−H(X|A) 2 2 σX| 2 2 ˜ A which concludes the argument. Proof of Corollary 5. The higher order terms O(ε21 ) can be worked out as kσ −2 ε2 (1+M k 2 σ −2 +εk 2 σ −2 ). Assuming that ε < min(M, 1), this is bounded by 3k 3 M σ −4 ε. Using the Lipschitz assumption, we can directly compute δ1 � from ε1 in the above proof, by letting δ = ε1 /L. Let R = kσ −2 M 2 + σ −2 k 2 M + 3k 3 M σ −4 . We want to choose 2 ˜ ≤ ε uniformly as required. Note δ such that ε1 R ≤ σ 2 ε. Hence if we choose δ ≤ σLRε , then |H(X|A) − H(X|A)| that in order to apply the result from Nemhauser et al. (1978), the approximate monotonicity has to be guaranteed for subsets of size 2k, which results in the stated bound. 2
K(Z,Y ) 1 Proof of Remark 7. We have that H(Y |Z) < 0 ⇔ K(Y, Y ) + σ 2 − K(Z,Z)+σ 2 < 2πe . Using a similar argument as the proof of Lemma 4, for very fine discretizations, there exists a Y arbitrarily close to Z, such that for any α > 0, | K(Z, Z) − K(Y, Y )| ≤ α and | K(Z, Z) − K(Z, Y )| ≤ α. Plugging these bounds into the definition of H(Y |Z) and some algebraic manipulation proves the claim.
References Cover, T. M., & Thomas, J. A. (1991). Elements of information theory. Wiley Interscience. Cressie, N. A. (1991). Statistics for spatial data. Wiley. Deshpande, A., Guestrin, C., Madden, S., Hellerstein, J., & Hong, W. (2004). Model-driven data acquisition in sensor networks. VLDB. Golub, G., & Van Loan, C. (1989). Matrix computations. Johns Hopkins. Gonzalez-Banos, H., & Latombe, J. (2001). A randomized art-gallery algorithm for sensor placement. Proc. 17th ACM Symp. Comp. Geom. (pp. 232–240). Hochbaum, D. S., & Maas, W. (1985). Approximation schemes for covering and packing problems in image processing and VLSI. J. ACM, 32, 130–136. Ko, C., Lee, J., & Queyranne, M. (1995). An exact algorithm for maximum entropy sampling. Ops Research, 43, 684–691. Krause, A., & Guestrin, C. (2005). A note on the budgeted maximization of submodular functions (Technical Report). CMU-CALD-05-103. MacKay, D. (2003). Information theory, inference, and learning algorithms. Cambridge UP. McKay, M., Beckman, R., & Conover, W. (1979). A comparison of three methods for selecting values of input variables in the analysis of output from a computer code. Technometrics, 21, 239–245. Nemhauser, G., Wolsey, L., & Fisher, M. (1978). An analysis of the approximations for maximizing submodular set functions. Mathematical Programming, 14, 265–294. Nguyen, N.-K., & Miller, A. J. (1992). A review of some exchange algorithms for constructing discrete D-optimal designs. Comp. Stat. and Data Analysis, 14, 489–498. Paciorek, C. (2003). Nonstationary gaussian processes for regression and spatial modelling. Doctoral dissertation, CMU. Ramakrishnan, N., Bailey-Kellogg, C., Tadepalli, S., & Pandey, V. (2005). Gaussian processes for active data mining of spatial aggregates. SIAM Data Mining. Ribeiro Jr., P. J., & Diggle, P. J. (2001). geor: A package for geostatistical analysis. R-NEWS Vol 1, No 2. ISSN 1609-3631. Seeger, M. (2004). Gaussian processes for machine learning. International Journal of Neural Systems, 14, 69–106. Storkey, A. J. (1999). Truncated covariance matrices and Toeplitz methods in gaussian processes. ICANN99. Widmann, M., & Bretherton, C. S. (1999). 50 km resolution daily precipitation for the pacific northwest. http://www.jisao.washington.edu/data sets/widmann/.
11