natorial optimization problem of maximizing the mutual information between the ...... this approach can improve prediction in Gaussian process regression (Seo et al., ...... Technical report, Jerusalem: Leibniz Center, Hebrew University, 2001.
Near-Optimal Sensor Placements in Gaussian Processes: Theory, Efficient Algorithms and Empirical Studies Andreas Krause, Ajit Singh, Carlos Guestrin May 2007 CMU-ML-07-108
Near-Optimal Sensor Placements in Gaussian Processes: Theory, Efficient Algorithms and Empirical Studies Andreas Krause
Ajit Singh
Carlos Guestrin
May 2007 CMU-ML-07-108
School of Computer Science Carnegie Mellon University Pittsburgh, PA 15213
Abstract When monitoring spatial phenomena, which can often be modeled as Gaussian processes (GPs), choosing sensor locations is a fundamental task. There are several common strategies to address this task, for example, geometry or disk models, placing sensors at the points of highest entropy (variance) in the GP model, and A-, D-, or E-optimal design. In this paper, we tackle the combinatorial optimization problem of maximizing the mutual information between the chosen locations and the locations which are not selected. We prove that the problem of finding the configuration that maximizes mutual information is NP-complete. To address this issue, we describe a polynomialtime approximation that is within (1 − 1/e) of the optimum by exploiting the submodularity of mutual information. We also show how submodularity can be used to obtain online bounds, and design branch and bound search procedures. We then extend our algorithm to exploit lazy evaluations and local structure in the GP, yielding significant speedups. We also extend our approach to find placements which are robust against node failures and uncertainties in the model. These extensions are again associated with rigorous theoretical approximation guarantees, exploiting the submodularity of the objective function. We demonstrate the advantages of our approach towards optimizing mutual information in a very extensive empirical study on two real-world data sets.
Keywords: Gaussian Processes; Experimental Design; Active Learning; Spatial Learning; Sensor Networks
1
Introduction
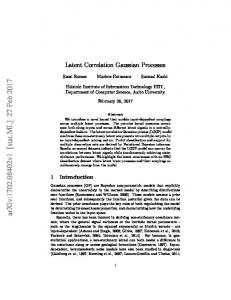
When monitoring spatial phenomena, such as temperatures in an indoor environment as shown in Figure 1(a), using a limited number of sensing devices, deciding where to place the sensors is a fundamental task. One approach is to assume that sensors have a fixed sensing radius and to solve the task as an instance of the art-gallery problem (c.f., Hochbaum and Maas, 1985; GonzalezBanos and Latombe, 2001). In practice, however, this geometric assumption is too strong; sensors make noisy measurements about the nearby environment, and this “sensing area” is not usually characterized by a regular disk, as illustrated by the temperature correlations in Figure 1(b). In addition, note that correlations can be both positive and negative, as shown in Figure 1(c), which again is not well-characterized by a disk model. Fundamentally, the notion that a single sensor needs to predict values in a nearby region is too strong. Often, correlations may be too weak to enable prediction from a single sensor. In other settings, a location may be “too far” from existing sensors to enable good prediction if we only consider one of them, but combining data from multiple sensors we can obtain accurate predictions. This notion of combination of data from multiple sensors in complex spaces is not easily characterized by existing geometric models. An alternative approach from spatial statistics (Cressie, 1991; Caselton and Zidek, 1984), making weaker assumptions than the geometric approach, is to use a pilot deployment or expert knowledge to learn a Gaussian process (GP) model for the phenomena, a non-parametric generalization of linear regression that allows for the representation of uncertainty about predictions made over the sensed field. We can use data from a pilot study or expert knowledge to learn the (hyper-)parameters of this GP. The learned GP model can then be used to predict the effect of placing sensors at particular locations, and thus optimize their positions.1 Given a GP model, many criteria have been proposed for characterizing the quality of placements, including placing sensors at the points of highest entropy (variance) in the GP model, and A-, D-, or E-optimal design, and mutual information (c.f., Shewry and Wynn 1987, Caselton and Zidek 1984, Cressie 1991, Zhu and Stein 2006, Zimmerman 2006). A typical sensor placement technique is to greedily add sensors where uncertainty about the phenomena is highest, i.e., the highest entropy location of the GP (Cressie, 1991; Shewry and Wynn, 1987). Unfortunately, this criterion suffers from a significant flaw: entropy is an indirect criterion, not considering the prediction quality of the selected placements. The highest entropy set, i.e., the sensors that are most uncertain about each other’s measurements, is usually characterized by sensor locations that are as far as possible from each other. Thus, the entropy criterion tends to place sensors along the borders of the area of interest (Ramakrishnan et al., 2005), e.g., Figure 4. Since a sensor usually provides information about the area around it, a sensor on the boundary “wastes” sensed information. An alternative criterion, proposed by Caselton and Zidek (1984), mutual information, seeks to find sensor placements that are most informative about unsensed locations. This optimization criterion directly measures the effect of sensor placements on the posterior uncertainty of the GP. In this paper, we consider the combinatorial optimization problem of selecting placements which maximize this 1
This initial GP is, of course, a rough model, and a sensor placement strategy can be viewed as an inner-loop step for an active learning algorithm (MacKay, 2003). Alternatively, if we can characterize the uncertainty about the parameters of the model, we can explicitly optimize the placements over possible models (Zidek et al., 2000; Zimmerman, 2006; Zhu and Stein, 2006).
1
criterion. We first prove that maximizing mutual information is an NP-complete problem. Then, by exploiting the fact that mutual information is a submodular function (c.f., Nemhauser et al., 1978), we design the first approximation algorithm that guarantees a constant-factor approximation of the best set of sensor locations in polynomial time. To the best of our knowledge, no such guarantee exists for any other GP-based sensor placement approach, and for any other criterion. This guarantee holds both for placing a fixed number of sensors, and in the case where each sensor location can have a different cost. Though polynomial, the complexity of our basic algorithm is relatively high – O(kn4 ) to select k out of n possible sensor locations. We address this problem in two ways: First, we develop a lazy evaluation technique that exploits submodularity to reduce significantly the number of sensor locations that need to be checked, thus speeding up computation. Second, we show that if we exploit locality in sensing areas by trimming low covariance entries, we reduce the complexity to O(kn). We furthermore show, how the submodularity of mutual information can be used to derive tight online bounds on the solutions obtained by any algorithm. Thus, if an algorithm performs better than our simple proposed approach, our analysis can be used to bound how far the solution obtained by this alternative approach is from the optimal solution. Submodularity and these online bounds also allow us to formulate a mixed integer programming approach to compute the optimal solution using Branch and Bound. Finally, we show how mutual information can be made robust against node failures and model uncertainty, and how submodularity can again be exploited in these settings. We provide a very extensive experimental evaluation, showing that data-driven placements outperform placements based on geometric considerations only. We also show that the mutual information criterion leads to improved prediction accuracies with a reduced number of sensors compared to several more commonly considered experimental design criteria, such as an entropy-based criterion, and A-optimal, D-optimal and E-optimal design criteria. In summary, our main contributions are: • We tackle the problem of maximizing the information-theoretic mutual information criterion of Caselton and Zidek (1984) for optimizing sensor placements, empirically demonstrating its advantages over more commonly used criteria. • Even though we prove NP-hardness of the optimization problem, we present a polynomial time approximation algorithm with constant factor approximation guarantee, by exploiting submodularity. To the best of our knowledge, no such guarantee exists for any other GPbased sensor placement approach, and for any other criterion. • We also show that submodularity provides online bounds for the quality of our solution, which can be used in the development of efficient branch-and-bound search techniques, or to bound the quality of the solutions obtained by other algorithms. • We provide two practical techniques that significantly speed up the algorithm, and prove that they have no or minimal effect on the quality of the answer. • We extend our analysis of mutual information to provide theoretical guarantees for placements that are robust against failures of nodes and uncertainties in the model. 2
50
OFFIC E
12
9
54
OFFIC E
51 52
49
QUIET
PHONE
11
8 53
CONFERENCE
16 15
10
13
14 17
7 18
STORAGE
48
LA B ELEC
5
COPY
19
6
47
4
46
20 21 3
45
2 SERVER
44
KITCHEN
39
22
1
43 37
23 33
29
35 40 42
41
27
31 38
25
34
36
32
30
28
24
26
0
-0 .15
43
(b) Temperature correlations
0 .3 0.2 5
5 0. 3
0.2 0 .2 0.1
1 0.
44
0 .3
45
0
0.1
5
0 .1
0.0
5
0
0.1
46
5
0.0
0 0 .1.2 5
1 -0 .
0 .2 5
05 0.
0.15
0.8
40
-0.1
5 0 -0.0 0.05 00..115 0.2
- 124
35
0.0005.1 .15 0. 2
0.1 5
0.8
0.7 0.7 5 0. 95
0 .9
0.95
00.9 .9 0.8 55
0.8
0 . 0.9 75
1
30
0
-0.1 05 -0.
.0 -0
05
0
15
- 123
0. 95
05
-0 .
5 0.0
10
0.85
1 5
0 .8
0.6 5 0.7 20 25
9 0. 5 0.8
0 .9 5
- 122
. -0
0
1
1
0. 95
5 0.9
00.8.8 .95
5
-0 .05
0.4
0.9
- 121
5
05 -0.
0.9 5
0.85
0.9
0 .95
- 120
-0 .1
0 0
15 -0.
0.9
0 .95
0
- 119
0.8 5
0.75 0.7
5
- 118
0 .8
15
10
-0.1
- 117
5 -0 .0
9 0.
0.8 0.8 5
0.7
-0.15
75 0.
0.5 5 0.5 0.6 0 .75
0.7 5
0 .85
0.7
5 0.6
20
0 .6
0.6 5
0.95
25
0.50.6
0. 55 0.6
0 .9
55 0.
65 0. 0.7 0 .75 0.8 0 .85
0 .65
(a) 54 node sensor network deployment
0.1
0.05 47
48
(c) Precipitation correlations
Figure 1: (a) A deployment of a sensor network with 54 nodes at the Intel Berkeley Lab. Correlations are often nonstationary as illustrated by (b) temperature data from the sensor network deployment in Figure 1(a), showing the correlation between a sensor placed on the blue square and other possible locations; (c) precipitation data from measurements made across the Pacific Northwest, Figure 11(b). • Extensive empirical evaluation of our methods on several real-world sensor placement problems and comparisons with several classical design criteria. The paper is organized as follows. In Section 2, we introduce Gaussian Processes. We review mutual information criterion in Section 3, and describe our approximation algorithm to optimize mutual information in Section 4. Section 5 presents several approaches towards making the optimization more computationally efficient. In Section 6, we discuss how we can extend mutual information to be robust against node failures and uncertainty in the model. Section 8 relates our approach to other possible optimization criteria, and Section 7 describes related work. Section 9 presents our experiments. Appendix A discusses learning GP models, with a focus on estimating non-stationary models.
2
Gaussian Processes
In this section, we review Gaussian Processes, the probabilistic model for spatial phenomena that forms the basis of our sensor placement algorithms. 3
22 10
21 20
5
19 0 40
18 17 40
30
30 30
20
30 20
25 20
10
10 0
15
20 10
10
0
5 0
(a) Temperature prediction using GP
0
(b) Variance of temperature prediction
Figure 2: Posterior mean and variance of the temperature GP estimated using all sensors: (a) Predicted temperature; (b) predicted variance.
2.1
Modeling Sensor Data Using the Multivariate Normal Distribution
Consider, for example, the sensor network we deployed as shown in Figure 1(a) that measures a temperature field at 54 discrete locations. In order to predict the temperature at one of these locations from the other sensor readings, we need the joint distribution over temperatures at the 54 locations. A simple, yet often effective (c.f., Deshpande et al., 2004), approach is to assume that the temperatures have a (multivariate) Gaussian joint distribution. Denoting the set of locations as V, in our sensor network example |V| = 54, we have a set of n = |V| corresponding random variables XV with joint distribution: P (XV = xV ) =
1 (2π)n/2 |Σ
1
VV |
e− 2 (xV −µV )
T Σ−1 (x −µ ) V V VV
,
where µV is the mean vector and ΣVV is the covariance matrix. Interestingly, if we consider a subset, A ⊆ V, of our random variables, denoted by XA , then their joint distribution is also Gaussian.
2.2
Modeling Sensor Data Using Gaussian Processes
In our sensor network example, we are not just interested in temperatures at sensed locations, but also at locations where no sensors were placed. In such cases, we can use regression techniques to perform prediction (Golub and Van Loan, 1989; Hastie et al., 2003). Although linear regression often gives excellent predictions, there is usually no notion of uncertainty about these predictions, e.g., for Figure 1(a), we are likely to have better temperature estimates at points near existing sensors, than in the two central areas that were not instrumented. A Gaussian process (GP) is a natural generalization of linear regression that allows us to consider uncertainty about predictions. Intuitively, a GP generalizes multivariate Gaussians to an infinite number of random variables. In analogy to the multivariate Gaussian above where the the index set V was finite, we now have a (possibly uncountably) infinite index set V. In our temperature example, V would be a subset of R2 , and 4
Sensor location
15
Sensor location
15
10
10
5 40
5 40 30
50
30
40
20 20
10 0
50 40
20
30
30 20
10
10
0
0
(a) Example kernel function.
10 0
(b) Data from the empirical covariance matrix.
Figure 3: Example kernel function learned from the Berkeley Lab temperature data: (a) learned covariance function K(x, ·), where x is the location of sensor 41; (b) “ground truth”, interpolated empirical covariance values for the same sensors. Observe the close match between predicted and measured covariances. each index would correspond to a position in the lab. GPs have been widely studied (c.f., MacKay, 2003; Paciorek, 2003; Seeger, 2004; O’Hagan, 1978; Shewry and Wynn, 1987; Lindley and Smith, 1972), and generalize Kriging estimators commonly used in geostatistics (Cressie, 1991). An important property of GPs is that for every finite subset A of the indices V, which we can think about as locations in the plane, the joint distribution over the corresponding random variables XA is Gaussian, e.g., the joint distribution over temperatures at a finite number of sensor locations is Gaussian. In order to specify this distribution, a GP is associated with a mean function M(·), and a symmetric positive-definite kernel function K(·, ·), often called the covariance function. For each random variable with index u ∈ V, its mean µu is given by M(u). Analogously, for each pair of indices u, v ∈ V, their covariance σuv is given by K(u, v). For simplicity of notation, we denote the mean vector of some set of variables XA by µA , where the entry for element u of µA is M(u). Similarly, we denote their covariance matrix by ΣAA , where the entry for u, v is K(u, v). The GP representation is extremely powerful. For example, if we observe a set of sensor measurements XA = xA corresponding to the finite subset A ⊂ V, we can predict the value at any point y ∈ V conditioned on these measurements, P (Xy | xA ). The distribution of Xy given these 2 observations is a Gaussian whose conditional mean µy|A and variance σy|A are given by: µy|A = µy + ΣyA Σ−1 AA (xA − µA ),
(1)
2 σy|A = K(y, y) − ΣyA Σ−1 AA ΣAy ,
(2)
where ΣyA is a covariance vector with one entry for each u ∈ A with value K(y, u), and ΣAy = ΣTyA . Figure 2(a) and Figure 2(b) show the posterior mean and variance derived using these equations on 54 sensors at Intel Labs Berkeley. Note that two areas in the center of the lab were not instrumented. These areas have higher posterior variance, as expected. An important property of GPs is that the posterior variance (2) does not depend on the actual observed values xA . Thus, for a given kernel function, the variances in Figure 2(b) will not depend on the observed temperatures. 5
2.3
Nonstationarity
In order to compute predictive distributions using (1) and (2), the mean and kernel functions have to be known. The mean function can usually be estimated using regression techniques. Estimating kernel functions is difficult, and usually, strongly limiting assumptions are made. For example, it is commonly assumed that the kernel K(u, v) is stationary, which means that the kernel depends only on the difference between the locations, considered as vectors v, u, i.e., K(u, v) = Kθ (u − v). Hereby, θ is a set of parameters. Very often, the kernel is even assumed to be isotropic, which means that the covariance only depends on the distance between locations, i.e., K(u, v) = Kθ (||u − v||2 ). Common choices for isotropic kernels are the exponential kernel, Kθ (δ) = exp(− |δ| θ ), and the δ2 Gaussian kernel, Kθ (δ) = exp(− θ2 ). These assumptions are frequently strongly violated in practice, as illustrated in the real sensor data shown in Figures 1(b) and 1(c). In Section 8.1, we discuss how placements optimized from models with isotropic kernels reduce to geometric covering and packing problems. In this paper, we do not assume that K(·, ·) is stationary or isotropic. Our approach is general, and can use any kernel function. In our experiments, we use the approach of Nott and Dunsmuir (2002) to estimate nonstationary kernels from data collected by an initial deployment. More specifically, their assumption is that an estimate of the empirical covariance ΣAA at a set of observed locations is available, and that the process can be locally described by a collection of isotropic processes, associated with a set of reference points. Details of this method are reviewed in Appendix A.3. An example of a kernel function estimated using this method is presented in Figure 3(a). In Section 9.2, we show that placements based on such nonstationary GPs lead to far better prediction accuracies than those obtained from isotropic kernels.
3
Optimizing Sensor Placements
Usually, we are limited to deploying a small number of sensors, and thus must carefully choose where to place them. In spatial statistics this optimization is called sampling or experimental design: finding the k best sensor locations out of a finite subset V of possible locations, e.g., out of a grid discretization of R2 .
3.1
The Entropy Criterion
We first have to define what a good design is. Intuitively, we want to place sensors which are most informative with respect to the entire design space. A natural notion of uncertainty is the conditional entropy of the unobserved locations V \ A after placing sensors at locations A, Z H(XV\A | XA ) = − p(xV\A , xA ) log p(xV\A | xA )dxV\A dxA , (3) where we use XA and XV\A to refer to sets of random variables at the locations A and V \ A. Intuitively, minimizing this quantity aims at finding the placement which results in the lowest uncertainty about all uninstrumented locations V \ A after observing the placed sensors A. A good 6
placement would therefore minimize this conditional entropy, i.e., we want to find A∗ = argminA⊂V:|A|=k H(XV\A | XA ). Using the identity H(XV\A | XA ) = H(XV ) − H(XA ), we can see that A∗ = argminA⊂V:|A|=k H(XV\A | XA ) = argmaxA⊂V:|A|=k H(XA ). So we can see that we need to find a set of sensors A which is most uncertain about each other. Unfortunately, this optimization problem, often also referred to as D-optimal design in the experiment design literature (c.f., Currin et al., 1991), has been shown to be NP-hard (Ko et al., 1995): Theorem 1 (Ko et al., 1995) Given rational M and rational covariance matrix ΣVV over Gaussian random variables V, deciding whether there exists a subset A ⊆ V of cardinality k such that H(XA ) ≥ M is NP-complete. Therefore, the following greedy heuristic has found common use (McKay et al., 1979; Cressie, 1991): One starts from an empty set of locations, A0 = ∅, and greedily adds placements until |A| = ∗ ∈ V \ A that k. At each iteration, starting with set Ai , the greedy rule used is to add the location yH has highest conditional entropy, ∗ yH = argmaxy H(Xy | XAi ),
(4)
i.e., the location we are most uncertain about given the sensors placed thus far. If the set of selected locations at iteration i is Ai = {y1 , . . . , yi }, using the chain-rule of entropies, we have that: H(XAi ) = H(Xyi | XAi−1 ) + ... + H(Xy2 | XA1 ) + H(Xy1 | XA0 ). Note that the (differential) entropy of a Gaussian random variable Xy conditioned on some set of variables XA is a monotonic function of its variance: H(Xy |XA ) =
1 1 1 2 2 log(2πeσX ) = log σX + (log(2π) + 1), y |XA y |XA 2 2 2
(5)
which can be computed in closed form using Equation (2). Since for a fixed kernel function, the variance does not depend on the observed values, this optimization can be done before deploying the sensors, i.e., a sequential, closed-loop design taking into account previous measurements bears no advantages over an open-loop design, performed before any measurements are made.
3.2
An Improved Design Criterion: Mutual Information
The entropy criterion described above is intuitive for finding sensor placements, since the sensors that are most uncertain about each other should cover the space well. Unfortunately, this entropy criterion suffers from the problem shown in Figure 4, where sensors are placed far apart along the boundary of the space. Since we expect predictions made from a sensor measurement to be most precise in a region around it, such placements on the boundary are likely to “waste” information. 7
8 6 4 2 0
5
10
15
20
Figure 4: An example of placements chosen using entropy and mutual information criteria on a subset of the temperature data from the Intel deployment. Diamonds indicate the positions chosen using entropy; squares the positions chosen using MI. This phenomenon has been noticed previously by Ramakrishnan et al. (2005), who proposed a weighting heuristic. Intuitively, this problem arises because the entropy criterion is indirect: the criterion only considers the entropy of the selected sensor locations, rather than considering prediction quality over the space of interest. This indirect quality of the entropy criterion is surprising, since the criterion was derived from the “predictive” formulation H(V \ A | A) in Equation (3), which is equivalent to maximizing H(A). Caselton and Zidek (1984) proposed a different optimization criterion, which searches for the subset of sensor locations that most significantly reduces the uncertainty about the estimates in the rest of the space. More formally, we consider our space as a discrete set of locations V = S ∪ U composed of two parts: a set S of possible positions where we can place sensors, and another set U of positions of interest, where no sensor placements are possible. The goal is to place a set of k sensors that will give us good predictions at all uninstrumented locations V \ A. Specifically, we want to find A∗ = argmaxA⊆S:|A|=k H(XV\A ) − H(XV\A | XA ),
(6)
that is, the set A∗ that maximally reduces the entropy over the rest of the space V \ A∗ . Note that this criterion H(XV\A ) − H(XV\A | XA ) is equivalent to finding the set that maximizes the mutual information I(XA ; XV\A ) between the locations A and the rest of the space V \ A. In their followup work, Caselton et al. (1992) and Zidek et al. (2000), argue against the use of mutual information in a setting where the entropy H(XA ) in the observed locations constitutes a significant part of the total uncertainty H(XV ). Caselton et al. (1992) also argue that, in order to compute MI(A), one needs an accurate model of P (XV ). Since then, the entropy criterion has been dominantly used as a placement criterion. Nowadays however, the estimation of complex nonstationary models for P (XV ), as well as computational aspects, are very well understood and handled. Furthermore, we show empirically, that even in the sensor selection case, mutual information outperforms entropy on several practical placement problems. 8
9 Upper bound on optimal solution
Mutual information
8 7 6
Best solution found
5
Greedy solution
4 3 2 1
2 3 4 Number of sensors placed
5
Figure 5: Comparison of the greedy algorithm with the optimal solutions on a small problem. We select from 1 to 5 sensor locations out of 16, on the Intel Berkeley temperature data set as discussed in Section 9. The greedy algorithm is always within 95 percent of the optimal solution.
On the same simple example in Figure 4, this mutual information criterion leads to intuitively appropriate central sensor placements that do not have the “wasted information” property of the entropy criterion. Our experimental results in Section 9 further demonstrate the advantages in performance of the mutual information criterion. For simplicity of notation, we will often use MI(A) = I(XA ; XV\A ) to denote the mutual information objective function. Notice that in this notation the process X and the set of locations V is implicit. We will also write H(A) instead of H(XA ). The mutual information is also hard to optimize: Theorem 2 Given rational M and a rational covariance matrix ΣVV over Gaussian random variables V = S ∪ U, deciding whether there exists a subset A ⊆ S of cardinality k such that MI(A) ≥ M is NP-complete. Proofs of all results are given in Appendix B. Due to the problem complexity, we cannot expect to find optimal solutions in polynomial time. However, if we implement the simple greedy algorithm for the mutual information criterion (details given below), and optimize designs on real-world placement problems, we see that the greedy algorithm gives almost optimal solutions, as presented in Figure 5. In this small example, where we could compute the optimal solution, the performance of the greedy algorithm was at most five percent worse than the optimal solution. In the following sections, we will give theoretical bounds and empirical evidence justifying this near-optimal behavior.
4
Approximation Algorithm
Optimizing the mutual information criterion is an NP-complete problem. We now describe a polynomial time algorithm with a constant-factor approximation guarantee. 9
1 2
4.1
Input: Covariance matrix ΣVV , k, V = S ∪ U Output: Sensor selection A ⊆ S begin A ← ∅; for j = 1 to k do σy2 − ΣyA Σ−1 AA ΣAy for y ∈ S \ A do δy ← ; −1 σy2 − ΣyA¯ΣA ¯ ¯A¯ΣAy y ∗ ← argmaxy∈S\A δy ; A ← A ∪ y∗; end Algorithm 1: Approximation algorithm for maximizing mutual information.
The Algorithm
Our algorithm is greedy, simply adding sensors in sequence, choosing the next sensor which provides the maximum increase in mutual information. More formally, using MI(A) = I(XA ; XV\A ), our goal is to greedily select the next sensor y that maximizes: � � ¯ − H(A) − H(A|A¯ ∪ y) , MI(A ∪ y) − MI(A) = H(A ∪ y) − H(A ∪ y|A) � � ¯ − H(A) − H(V) + H(A¯ ∪ y) = H(A ∪ y) − H(V) + H(A) ¯ = H(y|A) − H(y|A),
(7)
where, to simplify notation, we write A∪y to denote the set A∪{y}, and use A¯ to mean V \(A∪y). Note that the greedy rule for entropy in Equation (4) only considers the H(y|A) part of Equation (7), measuring the uncertainty of location y with respect to the placements A. In contrast, the greedy ¯ which forces us to pick a y that is mutual information trades off this uncertainty with −H(y|A), ¯ since those “central” locations will result in “central” with respect to the unselected locations A, ¯ the least conditional entropy H(y | A). Using the definition of conditional entropy in Equation (5), Algorithm 1 shows our greedy sensor placement algorithm.
4.2
An Approximation Bound
We now prove that, if the discretization V of locations of interest in the Gaussian process is fine enough, our greedy algorithm gives a (1 − 1/e) approximation, approximately 63% of the optimal b then sensor placement: If the algorithm returns set A, b ≥ (1 − 1/e) MI(A)
max
A⊂S,|A|=k
MI(A) − kε,
for some small ε > 0. To prove this result, we use submodularity (c.f., Nemhauser et al., 1978). Formally, a set function F is called submodular, if for all A, B ⊆ V it holds that F (A ∪ B) + F (A ∩ B) ≤ F (A) + F (B). Equivalently, using an induction argument as done by Nemhauser et al. (1978), a set function is submodular if for all A ⊆ A0 ⊆ V and y ∈ V \ A0 it holds that F (A ∪ y) − F (A) ≥ F (A0 ∪ y) − F (A0 ). This second characterization intuitively represents 10
25
20
20
Mutual information
Mutual information
25
15 10 5 0 0
15 10 5
10 20 30 Number of sensors placed
0 0
40
(a) Temperature data
50 100 Number of sensors placed
150
(b) Precipitation data
Figure 6: Mutual information of greedy sets of increasing size. It can be seen that clearly mutual information is not monotonic. MI is monotonic, however, in the initial part of the curve corresponding to small placements. This allows us to prove approximate monotonicity. “diminishing returns”: adding a sensor y when we only have a small set of sensors A gives us more advantage than adding y to a larger set of sensors A0 . Using the “information never hurts” bound, H(y | A) ≥ H(y | A ∪ B) (Cover and Thomas, 1991), note that our greedy update rule maximizing ¯ implies H(y | A) − H(y | A) MI(A0 ∪ y) − MI(A0 ) ≤ MI(A ∪ y) − MI(A), whenever A ⊆ A0 , i.e., adding y to A helps more than adding y to A0 . Hence we have shown: Lemma 3 The set function A 7→ MI(A) is submodular. A submodular set function F is called monotonic if F (A ∪ y) ≥ F (A) for y ∈ V. For such functions, Nemhauser et al. (1978) prove the following fundamental result: Theorem 4 (Nemhauser et al., 1978) Let F be a monotone submodular set function over a finite ground set V with F (∅) = 0. Let AG be the set of the first k elements chosen by the greedy algorithm, and let OPT = maxA⊂V,|A|=k F (A). Then � F (AG ) ≥
1−
k−1 k
�k ! OPT ≥ (1 − 1/e) OPT .
Hence the greedy algorithm guarantees a performance guarantee of (1 − 1/e) OPT, where OPT is the value of the optimal subset of size k. This greedy algorithm is defined by selecting in each step the element y ∗ = argmaxy F (A ∪ y) − F (A). This is exactly the algorithm we proposed in the previous section for optimizing sensor placements (Algorithm 1). Clearly, MI(∅) = I(∅; V) = 0, as required by Theorem 4. However, the monotonicity of mutual information is not apparent. Since MI(V) = I(V, ∅) = 0, the objective function will increase and then decrease, and, thus, is not monotonic, as shown in Figures 6(a) and 6(b). Fortunately, the proof of Nemhauser et al. (1978) does not use monotonicity for all possible sets, it is sufficient to prove that MI is monotonic for all sets of size up to 2k. Intuitively, mutual information is not monotonic 11
when the set of sensor locations approaches V. If the discretization level is significantly larger than 2k points, then mutual information should meet the conditions of the proof of Theorem 4. Thus the heart of our analysis of Algorithm 1 will be to prove that if the discretization of the Gaussian process is fine enough, then mutual information is approximately monotonic for sets of size up to 2k. More precisely we prove the following result: Lemma 5 Let X be a Gaussian process on a compact subset C of Rm with a positive-definite, continuous covariance kernel K : C × C → R+ 0 . Assume the sensors have a measurement error 2 with variance at least σ . Then, for any ε > 0, and any finite maximum number k of sensors to place there exists a discretization V = S ∪ U, S and U having mesh width δ such that ∀y ∈ V \ A, MI(A ∪ y) ≥ MI(A) − ε for all A ⊆ S, |A| ≤ 2k. If the covariance function is Lipschitz-continuous, such as the Gaussian Radial Basis Function (RBF) kernel, the following corollary gives a bound on the required discretization level with respect to the Lipschitz constant: Corollary 6 If K is Lipschitz-continuous with constant L, then the required discretization is δ≤
εσ 6 , 4kLM (σ 2 + 2k 2 M + 6k 2 σ 2 )
where M = maxx∈C K(x, x), for ε < min(M, 1). Corollary 6 guarantees that for any ε > 0, a polynomial discretization level is sufficient to guarantee that mutual information is ε−approximately monotonic. These bounds on the discretization are, of course, worst case bounds. The worst-case setting occurs when the sensor placements A are arbitrarily close to each other, since the entropy part H(y | A) in Equation (7) can become negative. Since most GPs are used for modeling physical phenomena, both the optimal sensor placement and the sensor placement produced by the greedy algorithm can be expected to be spread out, and not condensed to a small region of the sensing area. Hence we expect the bounds to be very loose in the situations that arise during normal operation of the greedy algorithm. Combining our Lemmas 3 and 5 with Theorem 4, we obtain our constant-factor approximation bound on the quality of the sensor placements obtained by our algorithm: Theorem 7 Under the assumptions of Lemma 5, Algorithm 1 is guaranteed to select a set A of k sensors for which MI(A) ≥ (1 − 1/e)(OPT −kε), where OPT is the value of the mutual information for the optimal placement. Note that our bound has two implications: First, it shows that our greedy algorithm has a guaranteed minimum performance level of 1 − 1/e when compared to the optimal solution. Second, our approach also provides an upper-bound on the value of the optimal placement, which can be used to bound the quality of the placements by other heuristic approaches, such as local search, that may perform better than our greedy algorithm on specific problems. 12
4.3
Sensor Placement with Non-constant Cost Functions
In many real-world settings, the cost of placing a sensor depends on the specific location. Such cases can often be formalized by specifying a total budget L, and the task is to select placements A whose total cost c(A) is within our budget. Recently, the submodular function maximization approach of Nemhauser et al. (1978) has been extended to address this budgeted case P (Sviridenko, 2004; Krause and Guestrin, 2005), in the case of modular cost functions, i.e., c(A) = ki=1 c(Xi ), where A = {X1 , . . . , Xk } and c(Xi ) is the cost for selecting element Xi . The combination of the analysis in this paper with these new results also yields a constant-factor (1 − 1/e) approximation guarantee for the sensor placement problem with non-uniform costs. The algorithm for this budgeted case first enumerates all subsets of cardinality at most three. For each of these candidate subsets, we run a greedy algorithm, which adds elements until the budget is exhausted. The greedy rule optimizes a benefit cost ratio, picking the element for which the increase of mutual information divided by the cost of placing the sensor is maximized: More formally, at each step, the greedy algorithm adds the element y ∗ such that y ∗ = argmaxy∈S\A
¯ H(y | A) − H(y | A) . c(y)
(8)
Krause and Guestrin (2005) show that this algorithm achieves an approximation guarantee of (1 − 1/e) OPT −
2Lε , cmin
where L is the available budget, and cmin is the minimum cost of all locations. A requirement for this result to hold is that mutual information is ε-monotonic up to sets of size c2L . The necessary min L discretization level can be established similarly as in Corollary 6, with k replaced by cmin .
4.4
Online Bounds
Since mutual information is approximately monotonic and submodular, Theorem 7 proves an a priori approximation guarantee of (1 − 1/e). For most practical problems however, this bound is very loose. The following observation allows to compute online bounds on the optimal value: Proposition 8 Assume that the discretization is fine enough to guarantee ε-monotonicity for mutual information, and that the greedy algorithm returns an approximate solution Ak , |Ak | = k. For all y ∈ S, let δy = MI(A ∪ y) − MI(A). Sort the δy in decreasing order, and consider the sequence P δ (1) , . . . , δ (k) of the first k elements. Then OPT ≤ MI(Ak ) + ki=1 δ (i) + kε. The proof of this proposition follows directly from submodularity and ε-monotonicity. In many applications, especially for large placements, this bound can be much tighter than the bound guaranteed by Theorem 7. Figures 7(a) and 7(b) compare the a priori and online bounds for the data sets discussed in Section 9.1. 13
30
35
25
25
A priori bounds (Nemhauser)
Mutual information
Mutual information
30 Online bound 20 15 Greedy result 10
Online bound
15 Greedy result
10 5
5 0
20
A priori bounds (Nemhauser)
2
4 6 8 Number of sensors placed
0
10
(a) Temperature data
5
10 15 20 25 30 Number of sensors placed
35
40
(b) Precipitation data
Figure 7: Online bounds: mutual information achieved by the greedy algorithm, the (1 − 1/e) and 1 − (1 − 1/k)k a priori bounds and the online bound described in Section 4.4.
4.5
Exact Optimization and Tighter Bounds Using Mixed Integer Programming
There is another way to get even tighter bounds, or even compute the optimal solution. This approach is based on branch & bound algorithm for solving a mixed integer program for monotonic submodular functions (Nemhauser and Wolsey, 1981). We used this algorithm to bound the value of the optimal solution in Figure 5. The mixed integer program is given by: max η; η ≤ MI(B) +
X
αi [MI(B ∪ yi ) − MI(B)], ∀B ⊆ S;
(9)
yi ∈S\B
X
αi ≤ k, ∀i;
(10)
i
αi
∈ {0, 1}, ∀i;
where αi = 1 means that location yi should be selected. Note that this MIP can be easily extended to handle the case in which each location can have a different cost, by replacing the constraint (10) P by i αi ci ≤ L, where L is the budget and ci = c(yi ). Unfortunately, this MIP has exponentially many constraints. Nemhauser and Wolsey (1981) proposed the following constraint generation algorithm: Let αA denote an assignment to α1 , . . . , αn such that αi = 1 iff yi ∈ A. Starting with no constraints of type (9), the MIP is solved, and one checks whether the current solution (η, αB ) satisfies η ≤ MI(B)). If it does not, a violated constraint has been found. Since solving individual instances (even with only polynomially many constraints) is NP-hard, we need to resort to search heuristics such as Branch and Bound and Cut during the constraint generation process. The analysis of this MIP, as presented by Nemhauser and Wolsey (1981), assumes monotonicity. In the case of mutual information, the objective is only approximately monotonic. In particular, 14
consider a a placement defined by αA . Then, by submodularity, for all B, we have that: X X [MI(B ∪ yi ) − MI(B)], αiA [MI(B ∪ yi ) − MI(B)] = MI(B) + MI(B) + yi ∈A\B
yi ∈S\B
≥ MI(A ∪ B). By approximate monotonicity: MI(A ∪ B) ≥ MI(A) − kε. Thus, (ˆ η , αA ), for ηˆ ≤ MI(A) − kε is a feasible solution for the mixed integer program. Since we ∗ are maximizing η, for the optimal solution (η ∗ , αA ) of the MIP it holds that MI(A∗ ) ≥ OPT −kε. There is another MIP formulation for maximizing general submodular functions without the εmonotonicity requirement. The details can be found in Nemhauser and Wolsey (1981). We however found this formulation to produce much looser bounds, and to take much longer to converge.
5
Scaling Up
Greedy updates for both entropy and mutual information require the computation of conditional entropies using Equation (5), which involves solving a system of |A| linear equations. For entropy maximization, where we consider H(y|A) alone, the complexity of this operation is O(k 3 ). To ¯ requiring O(n3 ), for n = |V|. Since we maximize the mutual information, we also need H(y|A) need to recompute the score of all possible locations at every iteration of Algorithm 1, the complexity of our greedy approach for selecting k sensors is O(kn4 ), which is not computationally feasible for very fine discretizations (large n). In Section 5.1 we propose a lazy strategy which often allows to reduce the number of evaluations of the greedy rule, thereby often reducing the complexity to O(kn3 ). In Section 5.2 we present a way of exploiting the problem structure by using local kernels, which often reduces the complexity to O(kn). Both approaches can be combined for even more efficient computation.
5.1
Lazy Evaluation Using Priority Queues
It is possible to improve the performance of Algorithm 1 directly under certain conditions by lazy evaluation of the incremental improvements in Line 1. A similar algorithm has been proposed by Robertazzi and Schwartz (1989) in the context of D-optimal design. At the start of the algorithm, all δy will be initialized to +∞. The algorithm will maintain information about which δy are current, i.e., have been computed for the current locations A. Now, the greedy rule in Line 2 will find the node y largest δy . If this δy has not been updated for the current A, the value is updated and reintroduced into the queue. This process is iterated until the location with maximum δy is has an updated value. The algorithm is presented in Algorithm 2. The correctness of this lazy procedure 15
Input: Covariance matrix ΣVV , k, V = S ∪ U Output: Sensor selection A ⊆ S begin A ← ∅; foreach y ∈ S do δy ← +∞; for j = 1 to k do 1 foreach y ∈ S \ A do currenty ← false; while true do y ∗ ← argmaxy∈S\A δy ; 2 if currenty∗ then break; ¯ ; 3 δy∗ ← H(y | A) − H(y | A) ∗ currenty ← true A ← A ∪ y∗; end Algorithm 2: Approximation algorithm for maximizing mutual information efficiently using lazy evaluation.
directly follows from submodularity: For a fixed location y, the sequence δy must be monotonically decreasing during course of the algorithm. To understand the efficacy of this procedure, consider the following intuition: If a location y ∗ is selected, nearby locations will become significantly less desirable and their marginal increases δy will decrease significantly. When this happens, these location will not be considered as possible maxima for the greedy step for several iterations. This approach can save significant computation time – we have noticed a decrease of mutual information computations by a factor of six in our experiments described in Section 9.6. This approach can be efficiently implemented by using a priority queue to maintain the advantages δy . Line 2 calls deletemax with complexity O(log n) and Line 3 uses the insert operation with complexity O(1). Also, as stated Line 1 has an O(n) complexity, and was introduced for simplicity of exposition. In reality, we annotate the δy ’s with the last iteration that they were updated, completely eliminating this step.
5.2
Local Kernels
In this section, we exploit locality in the kernel function to speed up the algorithm significantly: First, we note that, for many GPs, correlation decreases exponentially with the distance between points. Often, variables which are far apart are actually independent. These weak dependencies can be modeled using a covariance function K for which K(x, ·) has compact support, i.e., that has non-zero value only for a small portion of the space. For example, consider the following isotropic covariance function proposed by Storkey (1999): ( K(x, y) =
(2π−∆)(1+(cos ∆)/2)+ 32 sin ∆ , 3π
0, 16
for ∆ < 2π, otherwise,
(11)
1
Local Gaussian
Covariance
0.8 0.6 0.4 0.2 0
2 pi
pi 0 pi Euclidean distance
2 pi
Figure 8: Comparison of local and Gaussian kernels. Input: Covariance ΣVV , k, V = S ∪ U, ε > 0 Output: Sensor selection A ⊆ S begin A ← ∅; foreach y ∈ S do ˜ ε (y|V \ y); 1 δy ← H(y) − H for j = 1 to k do 2 y ∗ ← arg maxy δy ; A ← A ∪ y∗; foreach y ∈ N (y ∗ ; ε) do ˜ ε (y|A) − H ˜ ε (y|A); ¯ 3 δy ← H end Algorithm 3: Approximation algorithm for maximizing mutual information using local kernels. where ∆ = βkx − yk2 , for β > 0. This covariance function resembles the Gaussian kernel K(x, y) = exp(−βkx − yk22 /(2π)) as shown in Figure 8, but is zero for distances larger than 2π/β. Even if the covariance function does not have compact support, it can be appropriate to compute ˜ ≈ H(y|B) where B˜ results from removing all elements x from B for which | K(x, y)| ≤ ε H(y|B) for some small value of ε. This truncation is motivated by noting that: 2 2 σy|B\x − σy|B ≤
ε2 K(y, x)2 ≤ . σx2 σx2
This implies that the decrease in entropy H(y|B \x)−H(y|B) is at most ε2 /(σ 2 σx2 ) (using a similar argument as the one in the proof of Lemma 5), assuming that each sensor has independent Gaus˜ − H(y|B) is bounded sian measurement error of at least σ 2 . The total decrease of entropy H(y|B) 2 4 ¯ much more efficiently, at the expense of by nε /σ . This truncation allows to compute H(y|A) this small absolute error. In the special case of isotropic kernels, the number d of variables x with K(x, y) > ε can be computed as a function of the discretization and the covariance kernel. This ¯ from O(n3 ) to O(d3 ), which is a constant. reduces the complexity of computing H(y|A) Our truncation approach leads to the more efficient optimization algorithm shown in Algorithm 3. ˜ ε refers to the truncated computation of entropy as described above, and N (y ∗ ; ε) ≤ d refers Here, H to the set of elements x ∈ S for which | K(y ∗ , x)| > ε. Using this approximation, our algorithm 17
is significantly faster: Initialization (Line 1) requires O(nd3 ) operations. For each one of the k iterations, finding the next sensor (Line 2) requires O(n) comparisons, and adding the new sensor y ∗ can only change the score of its neighbors (N (y ∗ ; ε) ≤ d), thus Line 3 requires O(d·d3 ) operations. The total running time of Algorithm 3 is O(nd3 + kn + kd4 ), which can be significantly lower than the O(kn4 ) operations required by Algorithm 1. Theorem 9 summarizes our analysis: Theorem 9 Under the assumptions of Lemma 5, guaranteeing ε1 -approximate monotonicity and truncation parameter ε2 , Algorithm 3 selects A ⊆ S such that MI(A) ≥ (1 − 1/e)(OPT −kε1 − 2knε2 /σ 4 ), in time O(nd3 + nk + kd4 ). This approach can be efficiently implemented by using a priority queue to maintain the advantages δy . Using for example a Relaxed Heaps data structure, the running time can be decreased to O(nd3 + kd log n + kd4 ): Line 1 uses the insert operation with complexity O(1), Line 2 calls deletemax with complexity O(log n), and Line 3 uses delete and insert, again with complexity O(log n). This complexity improves on Algorithm 3 if d log n � n. This assumption is frequently met in practice, since d can be considered a constant as the size n of the sensing area grows. Of course, this procedure can also be combined with the lazy evaluations described in the previous section for further improvement in running time.
6
Robust Sensor Placements
In this section, we show how the mutual information criterion can be extended to optimize for placements which are robust against failures of sensor nodes, and against uncertainty in the model parameters. The submodularity of mutual information will allow us to derive approximation guarantees in both cases.
6.1
Robustness Against Failures of Nodes
As with any physical device, sensor nodes are susceptible to failures. For example, the battery of a wireless sensor can run out, stopping it from making further measurements. Networking messages containing sensor values can be lost due to wireless interference. In the following, we discuss how the presented approach can handle such failures. We associate with each location yi ∈ S a discrete random variable Zi such that Zi = 0 indicates that a sensor placed at location yi has failed and will not produce any measurements, and Zi = 1 indicates that the sensor is working correctly. For a placement A ⊂ S, denote by Az the subset of locations yi ∈ A such that zi = 1, i.e., the subset of functional sensors. Then, the robust mutual information X MIR (A) = EZ [Az ] = P (z) MI(Az ), z
is an expectation of the mutual information for placement A where all possible failure scenarios are considered. 18
Proposition 10 MIR (A) is submodular and, under the assumptions of Lemma 5, approximately monotonic. Proof This is a straightforward consequence of the fact that the class of submodular functions are closed under taking expectations. The approximate monotonicity can be verified directly from the approximate monotonicity of mutual information. Unfortunately, the number of possible failure scenarios grows exponentially in |S|. However, if the Zi are i.i.d., and the failure probability P (Zi = 0) = θ is low enough, MIR can be approximated well, for example, by only taking into account scenarios were none or at most one sensor fails. This simplification often works in practice (Lerner and Parr, 2001). These |S| + 1 scenarios can easily be enumerated. For more complex distributions over Z, or higher failure probabilities θ, one might have to resort to sampling in order to compute MIR . The discussion above presents a means for explicitly optimizing placements for robustness. However, we can show that even if we do not specifically optimize for robustness, our sensor placements will be inherently robust: Proposition 11 (Krause et al., 2006) Consider a submodular function F (·) on a ground set S, a set B ⊆ S, and a probability distribution over subsets A of B with the property that, for some constant ρ, we have Pr [v ∈ A] ≥ ρ for all v ∈ B. Then E[F (A)] ≥ ρF (B). When applying this proposition, the set B will correspond to the selected sensor placement. The (randomly chosen) set A denotes the set of fully functioning nodes. If each node fails independently with probability 1 − ρ, that implies that Pr [c ∈ A] ≥ ρ, and hence the expected mutual information of the functioning nodes, E[MI(A)], is at least ρ times the mutual information MI(B), i.e., when no nodes fail. Proposition 11 even applies if the node failures are not independent, but for example are spatially correlated, as can be expected in practical sensor placement scenarios.
6.2
Robustness Against Uncertainty in the Model Parameters
Often, the parameters θ of the GP prior, such as the amount of variance and spatial correlation in different areas of the space, are not known. Consequently, several researcher (Caselton et al., 1992; Zimmerman, 2006; Zhu and Stein, 2006) have proposed approaches to explicitly address the uncertainty in the model parameters, which are discussed in Section 7. We want to exploit submodularity in order to get performance guarantees on the placements. We take a Bayesian approach, and equip θ with a prior. In this case, the objective function becomes Z MIM (A) = Eθ [I(A; V \ A | θ)] =
p(θ)I(A; V \ A | θ)dθ.
Since the class of submodular functions is closed under expectations, MIM is still a submodular function. However, the approximate monotonicity requires further assumptions. For example, if the discretization meshwidth is fine enough to guarantee approximate monotonicity for all values of θ 19
for which p(θ) > 0, then approximate monotonicity still holds, since Z MIM (A ∪ y) − MIM (A) = p(θ)[I(A ∪ y; V \ (A ∪ y) | θ) − I(A; V \ A | θ)]dθ, Z ≥ p(θ)[−ε]dθ = −ε.
(12) (13)
A weaker assumption also suffices: If there exists a (nonnegative) function η(θ) such that I(A ∪ R y; V \ (A ∪ y) | θ) − I(A; V \ A | θ) ≥ −η(θ), and p(θ)[−η(θ)]dθ ≥ −ε, then MIM is still εapproximately monotonic. Such a function would allow the level ε of ε-approximately monotonicity to vary for different values of θ. Note that in this setting however, the predictive distributions (1) and (2) cannot be computed in closed form anymore, and one has to resort to approximate inference techniques (c.f., Rasmussen and Williams 2006). The advantage of exploiting submodularity for handling uncertainty in the model parameters is that the offline and online bounds discussed in Section 4.4 still apply. Hence, contrary to existing work, our approach provides strong theoretical guarantees on the achieved solutions.
7
Related Work
There is a large body of work related to sensor placement, and to the selection of observations for the purpose of coverage and prediction. Variations of this problem appear in spatial statistics, active learning, and experimental design. Generally, the methods define an objective function (Section 7.1), such as area coverage or predictive accuracy, and then apply a computational procedure (Section 7.2) to optimize this objective function. We also review related work on extensions to this basic scheme (Section 7.3), the related work in Machine Learning in particular (Section 7.4), and our previous work in this area (Section 7.5).
7.1
Objective Functions
We distinguish geometric and model-based approaches, which differ according to their assumptions made about the phenomenon to be monitored.
7.1.1
Geometric Approaches
Geometric approaches do not build a probabilistic model of the underlying process, but instead use geometric properties of the space in which the process occurs. The goal is typically a sensor placement that covers the space. The most common approaches for optimizing sensor placements using geometric criteria assume that sensors have a fixed region (c.f., Hochbaum and Maas, 1985; Gonzalez-Banos and Latombe, 2001; Bai et al., 2006). These regions are usually convex or even circular. Furthermore, it is assumed that everything within this region can be perfectly observed, 20
and everything outside cannot be measured by the sensors. In Section 8.1, we relate these geometric approaches to our GP-based formulation. In the case where the sensing area is a disk (the disk model), Kershner (1939) has shown that an arrangement of the sensors in the centers of regular hexagons is asymptotically optimal, in the sense that a given set is fully covered by uniform disks. In Section 9.3, we experimentally show that when we apply the disk model to nonstationary placement problems, as considered in this paper, the geometric disk model approach leads to worse placements in terms of prediction accuracy, when compared to model-based approaches. If many sensors are available then one can optimize the deployment density instead of the placement of individual sensors (Toumpis and Gupta, 2005). The locations of placed sensors are then assumed to be randomly sampled from this distribution. In the applications we consider, sensors are quite expensive, and optimal placement of a small set of them is desired.
7.1.2
Model-based Approaches
This paper is an example of a model-based method, one which takes a model of the world (here, a GP) and places sensors to optimize a function of that model (here, mutual information). Many different objective functions have been proposed for model-based sensor placement. In the statistics community, classical and Bayesian experimental design focused on the question of selecting observations to maximize the quality of parameter estimates in linear models (c.f., Atkinson 1988; Lindley 1956). In spatial statistics, information-theoretic measures, notably entropy, have been frequently used (Caselton and Hussain, 1980; Caselton and Zidek, 1984; Caselton et al., 1992; Shewry and Wynn, 1987; Federov and Mueller, 1989; Wu and Zidek, 1992; Guttorp et al., 1992). These objectives minimize the uncertainty in the prediction, after the observations are made.
Classical Experimental Design Criteria. In the statistics literature, the problem of optimal experimental design has been extensively studied (c.f., Atkinson, 1988, 1996; Pukelsheim, 1987; Boyd and Vandenberghe, 2004). The problem commonly addressed there is to estimate the parameters θ of a function, y = fθ (x) + w, where w is normally distributed measurement noise with zero mean and variance σ 2 , y a scalar output and x a vectorial input. The assumption is, that the input x can be selected from a menu of design options, {x1 , . . . , xn }. Each input corresponds to a possible experiment which can be performed. In our sensor placement case, one x would be associated with each location, y would be the measurement at the location, and θ would correspond to the values of the phenomenon at the unobserved locations. Usually, the assumption is that fθ is linear, i.e. y = θT x + w. For the linear model y = θT x + w, if all n observations were available, then ˆ = σ 2 (X T X)−1 Var(θ) Var(ˆ yi ) =
σ 2 xTi (X T X)−1 xi , 21
(14) (15)
where X is the design matrix, which consists of the inputs x1 , . . . , xn as its rows. We can see that the variance of both the parameter estimate θˆ and the predictions yˆi depends on the matrix M = (X T X)−1 , which is called the inverse moment matrix. If this matrix is “small”, then the parameter estimates and predictions will be accurate. A design consists of a selection A of the inputs (with repetitions allowed). We write XA to denote the selected experiments, and MA for the corresponding inverse moment matrix. Classical experimental design considers different notions of “smallness” for this inverse moment matrix MA ; D-optimality refers to the determinant, Aoptimality to the trace and E-optimality to the spectral radius (the maximum eigenvalue). There are several more scalarizations of the inverse moment matrix, and they are commonly referred to as “alphabetical” optimality criteria. An example of the relationship between this formalism and sensor placements in GPs, as well as experimental comparisons, are presented in Section 9.5. Equation (15) shows that the distribution of the test data is not taken into account, when attempting to minimizing the inverse moment matrix MA . Yu et al. (2006) extend classical experimental design to the transductive setting, which takes the distribution of test data into account. The informationtheoretic approaches, which we use in this paper, also directly take into account the unobserved locations, as they minimize the uncertainty in the posterior P (XV\A | XA ). Bayesian Design Criteria. Classical experimental design is a Frequentist approach, which attempts to minimize the estimation error of the maximum likelihood parameter estimate. If one places a prior on the model parameters, one can formalize a Bayesian notion of experimental design. In its general form, Bayesian experimental design was pioneered by Lindley (1956). The users encode their preferences in a utility function U (P (Θ), θ? ), where the first argument, P (Θ), is a distribution over states of the world (i.e., the parameters) and the second argument, θ? , is the true state of the world. Observations xA are collected, and the change in expected utility under the prior P (Θ) and posterior P (Θ | XA = xA ) can be used as a design criteria. By using different utility functions, Bayesian versions of A-, D-, and E- optimality can be developed (Chaloner and Verdinelli, 1995). Usually, Bayesian experimental design considers the task of parameter estimation (Sebastiani and Wynn, 2000; Paninski, 2005; Ylvisaker, 1975). Lindley (1956) suggested using negative Shannon information, which is equivalent to maximizing the expected Kullback-Leibler divergence between the posterior and prior over the parameters: Z Z P (θ | xA ) P (xA ) P (θ | xA ) log dθdxA . (16) P (θ) If we consider distributions P (XV\A ) over the unobserved locations XV\A instead of distributions over parameters P (Θ), (16) leads to the following criterion: Z Z P (xV\A | xA ) dxV\A dxA . P (xA ) P (xV\A | xA ) log (17) P (xV\A ) Note that Equation (17) is exactly the mutual information between the observed and unobserved sensors, I(A; V \ A). For a linear-Gaussian model, where the mean and covariance are known, we get the mutual information criteria of Caselton and Zidek (1984), which we use in this paper. 22
Information-Theoretic Criteria. The special case of Bayesian experimental design, where an information-theoretic functional (such as entropy or mutual information) is used as a utility function, and where the predictive uncertainty in the unobserved variables is concerned (as in Equation (17)) is of special importance for spatial monitoring. Such information-theoretic criteria have been used as design criteria in a variety of fields and applications. Maximizing the posterior entropy H(A) of a set of observations, as discussed in Section 3, has been used in the design of computer experiments (Sacks et al., 1989; Currin et al., 1991), function interpolation (O’Hagan, 1978) and spatial statistics (Shewry and Wynn, 1987). This criteria is sometimes also referred to as D-optimality, since the scalarization of the posterior variance in the spatial literature and the scalarization of the parameter variance in classical experimental design both involve a determinant. In this paper, we do not use the term D-optimality in this context. Maximizing mutual information between sets of random variables has a long history of use in statistics (Lindley, 1956; Bernardo, 1979), machine learning (Luttrell, 1985; MacKay, 1992). The specific form addressed in this paper, I(A; V \ A), has been used in spatial statistics (Caselton and Zidek, 1984; Caselton et al., 1992). Mutual information requires an accurate estimate of the joint model P (XV ), while entropy only requires an accurate estimate at the selected locations, P (XA ). Caselton et al. (1992) argue that latter is easier to estimate from a small amount of data, thus arguing against mutual information. We however contend that nowadays effective techniques for learning complex nonstationary spatial models are available, such as the ones used in our experiments, thus mitigating these concerns and enabling the optimization of mutual information.
7.2
Optimization Techniques
All of the criteria discussed thus far yield challenging combinatorial optimization problems. Several approaches are used to solve them in the literature, which can be roughly categorized into those that respect the integrality constraint and those which use a continuous relaxation. 7.2.1
Combinatorial search
For both geometric and model-based approaches, one must search for the best design or set of sensor locations among a very (usually exponentially) large number of candidate solutions. In a classical design, e.g., the inverse moment matrix on a set of selected experiments XA can be written as !−1 n X MA = ki xi xTi , i=1
where ki is the number of times experiment xi is performed in design A. Since ki must be an integer, a combinatorial number of potential experimental designs has to be searched. Similarly, when placing a set A of k sensors out of a set V of possible locations, as we do in this paper, all sets of size k have to be searched. For both entropy (Ko et al. 1995) and mutual information (this paper), this search has been shown to be NP-hard, hence efficient exact solutions are likely not possible. Since exhaustive search is usually infeasible, local, heuristic searches without theoretical guarantees have commonly been applied. Approaches to the difficult combinatorial optimization include 23
simulated annealing (Meyer and Nachtsheim, 1988), pairwise exchange (Fedorov, 1972; Mitchell, 1974a,b; Cook and Nachtsheim, 1980; Nguyen and Miller, 1992), forward and backward greedy heuristics (MacKay, 1992; Caselton and Zidek, 1984). All these approaches provide no guarantees about the quality of the solution. Since optimal solutions are highly desirable, branch-and-bound approaches to speed up the exhaustive search have been developed (Welch, 1982; Ko et al., 1995). Although they enable exhaustive search for slightly larger problem instances, the computational complexity of the problems puts strong limits on their effectiveness. By exploiting submodularity of mutual information, in this paper, we provide the first approach to information-theoretic sensor placement which has guarantees both on the runtime and on the quality of the achieved solutions.
7.2.2
Continuous relaxation
In some formulations, the integrality constraint is relaxed. For example, in classical experimental design, the number of experiments to be selected is often large compared to the number of design choices. In these cases, one can find a fractional design (i.e., a non-integral solution defining the proportions by which experiments should be performed), and round the fractional solutions. In the fractional formulation, A-, D-, and E-optimality criteria can be solved exactly using a semi-definite program (Boyd and Vandenberghe, 2004). There are however no known bounds on the integrality gap, i.e., the loss incurred by this rounding process. In other approaches (Seo et al., 2000; Snelson and Ghahramani, 2005), a set of locations is chosen not from a discrete, but a continuous space. If the objective function is differentiable with respect to these locations, gradient-based optimization can be used instead of requiring combinatorial search techniques. Nevertheless, optimality of the solution is not guaranteed since there is no known bound on the discrepancy between local and global optima. Another method that yields a continuous optimization, in the case of geometric objective functions, is the potential field approach (Heo and Varshney, 2005; Howard et al., 2002). An energy criterion similar to a spring model is used. This optimization results in uniformly distributed (in terms of inter-sensor distances), homogeneous placements. The advantage of these approaches is that they can adapt to irregular spaces (such as hallways or corridors), where a simple grid-based deployment is not possible. Since the approach uses coordinate ascent, it can be performed using a distributed computation, making it useful for robotics applications where sensors can move.
7.3
Related Work on Extensions
In this section, we discuss prior work related to our extensions on sensor placement under model uncertainty (Section 6) and on the use of non-constant cost functions (Section 4.3). 24
7.3.1
Placement with Model Uncertainty
The discussion thus far has focused on the case where the joint model P (XV ) is completely specified, i.e., the mean and covariance of the GP are known2 . With model uncertainty, one has to distinguish between observation selection for predictive accuracy in a fixed model and observation selection for learning parameters. Model uncertainty also introduces computational issues. If the mean and covariance are fixed in a Gaussian process then the posterior is Gaussian. This makes it easy to compute quantities such as entropy and mutual information. If the mean and covariance are unknown, and we have to learn hyperparameters (e.g., kernel bandwidth of an isotropic process), then the predictive distributions and information-theoretic quantities often lack a closed form. Caselton et al. (1992) extend their earlier work on maximum entropy sampling to the case where the mean and covariance are unknown by using a conjugate Bayesian analysis. The limitations of this approach are that the conjugate Bayesian analysis makes spatial independence assumptions in the prior and that complete data with repeated observations are required at every potential sensing site. This leads to a determinant maximization problem, much like D-optimality, that precludes the use of submodularity. Another approach is the development of hybrid criteria, which balance parameter estimation and prediction. For example, Zimmerman (2006) proposes local EK-optimality, a linear combination of the maximum predictive variance and a scalarization of the covariance of the maximum likelihood parameter estimate. While this criterion selects observations which reduce parameter uncertainty and predictive uncertainty given the current parameter, it does not take into account the effect of parameter uncertainty on prediction error. To address this issue, Zhu and Stein (2006) derive an iterative algorithm which alternates between optimizing the design for covariance estimation and spatial prediction. This procedure does not provide guarantees on the quality of designs. An alternative approach to addressing model uncertainty, in the context of classical experimental design, is presented by Flaherty et al. (2006). There, instead of committing to a single value, the parameters of a linear model are constrained to lie in a bounded interval. Their robust design objective, which is based on E-optimality, is then defined with respect to the worst-case parameter value. Flaherty et al. (2006) demonstrate how a continuous relaxation of this problem can be formulated as a SDP, which can be solved exactly. No guarantees are given however on the integrality gap on this relaxation. In our approach, as discussed in Section 6, we show how submodularity can be exploited even in the presence of parameter uncertainty. We do not address the computational issues, which depend on the particular parameterization of the GP used. However, in special cases (e.g., uncertainty about the kernel bandwidth), one can apply sampling or numerical integration, and still get guarantees about the achieved solution. 2 Or one assumes the uncertainty on these parameters is small enough that their contribution to the predictive uncertainty is negligible.
25
7.3.2
Non-constant Cost Functions
In Section 4.3, we discuss the case where every sensor can have a different cost, and one has a budget which one can spend. An alternate approach to sensor costs is presented by Zidek et al. (2000). They propose a criteria that makes a trade off between achieved reduction in entropy using an entropy-tocost conversion factor, i.e., they optimize the sum of the entropy with a factor times the cost of the placements. This criterion yields an unconstrained optimization problem. Our approach to sensor costs (Section 4.3) yields a constrained optimization, maximizing our criteria given a fixed budget that can be spent when placing sensors. Such a budget-based approach seems more natural in real problems (where one often has a fixed number of sensors or amount of money to spend). Moreover, our approach provides strong a priori theoretical guarantees and tighter online bounds, which are not available for the approach of Zidek et al. (2000).
7.4 7.4.1
Related Work in Machine Learning Feature Selection and Dimension Reduction
Given that the joint distribution of XA and XV\A is Gaussian, their mutual information is also MI(A) = −
1X log (1 − ρ2i ) 2
(18)
i
where ρ21 ≥ · · · ≥ ρ2|V| are the canonical correlation coefficients between XA and XV\A (Caselton and Zidek, 1984). McCabe (1984) show that maximizing the canonical correlations between observed and unobserved variables can be interpreted as a form of principal components analysis, where one realizes that selecting subsets of variables is a special kind of linear projection. A similar analysis is presented for entropy and other common design criteria. Using Equation (18), a similar relationship can be made to canonical correlation analysis (CCA; Hotelling 1936), which finds linear projections for V \ A and A that maximize the correlations in the lower dimensional space. By considering these lower-dimensional projections, one can determine how much variance is shared (jointly explained) by V \ A and A. While dimension reduction techniques such as Principal Component Analysis (PCA) or CCA can be used to find a lower dimensional representation of a high dimensional problem, these techniques usually find projections which are non-sparse, i.e., which are linear combinations of (almost) all input variables. However, for interpretation purposes (and considering data acquisition cost), one often desires sparse projections, which are linear combinations of only a small subset of input variables. Moghaddam et al. (2005) and Moghaddam et al. (2006) consider the problem of selecting such sparse linear projections (subject to a constraint on the number of nonzero entries) of minimum reconstruction error (for PCA) and class separation (for LDA). In order to find these sparse projections, they propose two approaches: A mixed integer program, which can solve the problem optimally – albeit generally not in polynomial time, and a heuristic approach, using a greedy forward search followed by a greedy backward elimination. While they do provide a theoretical justification for their selection criteria, their approach does not provide an a priori lower bound on the performance of the greedy algorithm. 26
7.4.2
Active Learning
In the machine learning community, information-theoretic criteria have been used for active learning, techniques which allow the learning algorithm to influence the choice of training samples. For example, information-theoretic criteria have been used in the analysis of query-by-committee to select samples (Sollich, 1996; Freund et al., 1997; Axelrod et al., 2001). Following Lindley (1956), MacKay (1992) proposes selecting observations that maximize expected information gain, either in terms of entropy or cross entropy, using Federov exchange. As opposed to this paper, which addresses the optimization problem, MacKay (1992) focuses on comparing the different objective criteria. Cohn (1994) proposes scoring each potential observation by measuring the average reduction in predicted variance at a set of reference points. There is some evidence which suggests that this approach can improve prediction in Gaussian process regression (Seo et al., 2000). Common to all these active learning approaches, as well as to this paper, is the problem of selecting a set of most informative observation. Unlike this paper, we are not aware of any prior work in this area which provides rigorous approximation guarantees for this problem.
7.4.3
Fast Gaussian Process Methods
Information-theoretic criteria are also used in sparse GP modeling, which attempts to reduce the cost of inference by selecting a representative subset of the training data. Sample selection criteria have included KL-divergence (Seeger et al., 2003) and entropy (Lawrence et al., 2003). In contrast to sensor placement, where locations are chosen to minimize predictive uncertainty, in sparse GP methods, the samples are chosen such that the approximate posterior matches the true posterior (which uses the entire training set) as accurately as possible. Instead of choosing a subset of the training data, Snelson and Ghahramani (2005) propose to optimize the location of a set of “hallucinated” inputs. This approach results in a continuous optimization problem, which appears to be easier to solve (albeit with no performance guarantees) than the discrete subset selection problem.
7.5
Relationship to Previous Work of the Authors
An earlier version of this paper appeared as (Guestrin et al., 2005). The present version is substantially extended by new experiments on nonstationarity (Section 9.3, Section 9.2) and comparisons to classical experimental design (Section 9.5). New are also the discussion of robust placements in Section 6 and several extensions in Section 4 and Section 5. Additionally, Krause et al. (2006) presented an approximation algorithm for optimizing node placements for sensor networks using GPs that takes into account both the informativeness of placements (analogously to the discussion in this paper) and the communication cost required to retrieve these measurements. Their approach uses GPs both for modeling the monitored phenomenon as well as the link qualities of the sensor network. Singh et al. (2007) consider the case of planning informative paths for multiple robots. Here, the goal is to select observations which are both informative, but also lie on a collection of paths, one for each robot, of bounded length. They develop an approximation algorithm with theoretical guarantees on the quality of the solution. In the setting of Krause et al. (2006) and Singh et al. (2007) – unlike the case considered in this paper, where there are no 27
constraints on the location of the sensors – the greedy algorithm performs arbitrarily badly, and the papers describe more elaborate optimization algorithms. In these algorithms, the submodularity of mutual information is again the crucial property which allows the authors to obtain approximation guarantees for their approach.
8
Notes on Optimizing Other Objective Functions
In this section, we discuss some properties of alternative optimality criteria for sensor placement.
8.1
A Note on the Relationship with the Disk Model
The disk model for sensor placement (c.f., Hochbaum and Maas, 1985; Bai et al., 2006) assumes that each sensor can perfectly observe everything within a radius of r and nothing else. Hence we can associate with every location y ∈ V a sensing region Dy , which, for a discretization of the space, corresponds to the locations contained within radius r of location y. For a set of locations A, we can S define the coverage FD (A) = y∈A Dy . It can be easily seen that this criterion is monotonic, submodular and F (∅) = 0. Hence optimizing placements for the disk model criterion is a submodular maximization problem, and the greedy algorithm can guarantee a constant factor (1 − 1/e) OPT approximation guarantee for finding the placement of k sensors with maximum coverage. There is a sense, in which the approach of sensor placements in GPs can be considered a generalization of the disk model. If we assume an isotropic GP with local kernel function as the one presented in Figure 8, then a sensor measurement is correlated exactly with the locations within a disk around its location. If the process has constant variance, then the greedy algorithm will, for the first few sensors placed, only try to achieve a disjoint placement of the disks, and as such behave just like the greedy algorithm for disk covering. However, once enough sensors have been placed so that these “disks” start to overlap, the behavior of the two approaches begins to differ: in a disk model there is no advantage in placing sensors that lead to overlapping disks. In a GP model, even an isotropic one, “overlapping disks” lead to better predictions in the overlapping area, a very natural consequence of the representation of the uncertainty in the process.
8.2
A Note on Maximizing the Entropy
As noted by Ko et al. (1995), entropy is also a submodular set function, suggesting a possible application of the result of Nemhauser et al. (1978) to the entropy criterion. The corresponding greedy algorithm adds the sensor y maximizing H(A ∪ y) − H(A) = H(y|A). Unfortunately, our analysis of approximate monotonicity does not extend to the entropy case: Consider H(y|A) for A = {z}, for sufficiently small measurement noise σ 2 , we show that H(y|A) can become arbitrarily negative as the mesh width of the discretization decreases. Thus, (even approximate) monotonicity does not hold for entropy, suggesting that the direct application of the result of Nemhauser et al. (1978) is not possible. More precisely, our negative result about the entropy criterion is: 28
Remark 12 Under the same assumptions as in Lemma 5, for any ε > 0, there exists a mesh discretization width δ > 0 such that for any discretization level δ 0 , where 0 < δ 0 ≤ δ, entropy violates 1 the monotonicity criteria by at least ε, if σ 2 < 4πe .
8.3
A Note on Maximizing the Information Gain
Another objective function of interest is the information gain of a sensor placement with respect to some distinguished variables of interest U, i.e., IG(A) = I(A; U) = H(U) − H(U | A). Unfortunately, this objective function is not submodular, even in the case of multivariate normal distributions: Let X = (X1 , X2 , X3 ) be distributed according to a multivariate Gaussian with zero mean and covariance 2 1 1 Σ = 1 1 0 . 1 0 2 Let U = {X3 }. Here, X2 and X3 are marginally independent. Thus, alone, X2 provides no gain in information. However, X2 does provide information about X1 . Thus, if we first place a sensor at position 1, placing a sensor at position 2 does help. More formally, IG({X2 }) − IG(∅) = H(X3 | X2 ) − H(X3 ) < H(X3 | X1 , X2 ) − H(X3 | X1 ) = IG({X1 , X2 }) − IG({X1 }). Hence adding X2 to the empty set achieves strictly less increase in information gain than adding X2 to the singleton set containing X1 , contradicting the submodularity assumption. Remark 13 The information gain, IG(A) = I(A; U) is not submodular in A.
8.4
A Note on Using Experimental Design for Sensor Placement
As discussed in Section 7.1, the goal of classical experimental design is to find a set A of experiT X )−1 mental stimuli {x1 , . . . , xk } such that the parameter estimation error covariance MA = (XA A is as small as possible, where XA is a matrix containing the xi as rows. The different optimality criteria vary in the criteria used for measuring the smallness of MA . Consider the case where the number p of parameters θ is greater than 1, as in the sensor placement setting, where θ are the T X ) is not uninstrumented locations. If we select less than p observations, i.e., |A| ≤ p, then (XA A full rank, and MA is infinite. Hence, for |A| < p, all alphabetical optimality criteria are infinite. Consequently, the A-, D- and E-optimality criteria are infinite as well for all discrete designs A of size less than p, and hence two such designs are incomparable under these criteria. This incomparability implies that the greedy algorithm will have no notion of improvement, and cannot be used for optimizing discrete classical experimental designs. Hence, discrete classical design cannot be addressed using the concept of submodularity. In the case of Bayesian experimental design, the parameters are equipped with a prior, and hence the posterior error covariance will not be infinite. In this case however, none of Bayesian A-, D- and E-optimality are submodular in general: • Bayesian A-optimality. Consider Σ as in Section 8.3, describing the covariance of three zero mean Gaussian random variables X1 , X2 , X3 . We can select among V = {X1 , X2 }, and our 29
goal is to maximally reduce the posterior variance of X3 . A-optimality seeks to maximize the 2 , where A ⊆ V. It can be seen that F (∅) = F ({X }) = 0, set function F (A) = σ32 − σ3|A 2 but F ({X1 , X2 }) − F ({X1 }) = 12 > 0, hence adding X2 to {X1 } helps more than adding X2 to the empty set. • Bayesian D-optimality. The same counterexample as for A-optimality shows that Bayesian D-optimality (which is equivalent to the information gain criterion discussed in Section 8.3) is not submodular. • Bayesian E-optimality. Consider the case where θ = (θ1 , θ2 ) equipped with a normal prior with zero mean and covariance diag([1, 1]). Let yi = θT xi + w where w is Gaussian noise with mean zero and variance ε. Let x1 = (1, 0)T and x2 = (0, 1)T . If we perform no experiment (A = ∅), then the posterior error covariance, Σθ|XA = Σθ , and hence the maximum eigenvalue is 1. If we observe either x1 or x2 , the largest eigenvalue is still λmax (Σθ|XA ) = 1. ε . Hence adding x2 helps more if But if we observe both x1 and x2 , then λmax (Σθ|XA ) = 1+ε we add it to x1 than if we add it to the empty set, contradicting submodularity. Remark 14 Bayesian A-, D-, and E-optimality are not submodular in general. However, Das and Kempe (2007) show that in certain cases, under a condition of conditional suppressor-freeness, the variance reduction F (and hence Bayesian A-optimality) can indeed be shown to be submodular.
9
Experiments
We performed experiments on two real-world data sets, which are described in Section 9.1. In Section 9.2 we compare placements on stationary and nonstationary GP models. In Sections 9.3, 9.4 and 9.5 we compare mutual information with the disk model, with entropy and with other classical experimental design criteria, in terms of prediction accuracy. In 9.6 we compare the performance of the greedy algorithm with other heuristics, and in Section 9.7 we analyze the effect of exploiting local kernels.
9.1
Data Sets
We first introduce the data sets we consider in our experiments. In our first data set, we analyze temperature measurements from the network of 46 sensors shown in Figure 1(a). Our training data consisted of samples collected at 30 sec. intervals on 3 consecutive days (starting Feb. 28th 2004), the testing data consisted of the corresponding samples on the two following days. Our second data set consists of precipitation data collected during the years 1949 - 1994 in the states of Washington and Oregon (Widmann and Bretherton, 1999). Overall 167 regions of equal area, approximately 50 km apart, reported the daily precipitation. To ensure the data could be reasonably modeled using a Gaussian process we applied a log-transformation, removed the daily mean, and only considered days during which rain was reported. After this preprocessing, we selected the initial two thirds of the data as training instances, and the remaining samples for testing 30
purposes. From the training data, we estimated the mean and empirical covariance, and regularized it by adding independent measurement noise3 of σ 2 = 0.1. We computed error bars for the prediction accuracies in all of our experiments, but due to the violated independence of the collected samples (which are temporally correlated), these error bars are overconfident and hence not reported here. The estimated standard errors under the independence assumption are too small to be visible on the plots.
9.2
Comparison of Stationary and Non-stationary Models
To see how well both the stationary and nonstationary models capture the phenomenon, we performed the following experiment: We learned both stationary and non-stationary GP models from an increasing number of sensors. The model with stationary correlation function used an isotropic Exponential kernel with bandwidth fitted using least-squares fit of the empirical variogram (Cressie, 1991). We also learned a nonstationary GP using the technique from Nott and Dunsmuir (2002), as discussed in Section A.3 Both GP models were estimated from an initial deployment of an increasing number of sensors. We used non-stationary the same variance process for both stationary and nonstationary models (i.e., giving more information to the stationary model than commonly done). Since with increasing amount of data, the empirical covariance matrix will exactly capture the underlying process, we consider the empirical covariance as the ground truth both for placements and prediction. Hence we also selected placements using the entire estimated covariance matrix. We optimized the designs using mutual information on all the models. We evaluate the prediction accuracy for an increasing number of near-optimally placed sensors, using the estimated model and the measured values for the selected sensors. Figure 9(a) presents the results for the temperature data set. We can see that the nonstationary model learned from 10 sensors performs comparably to the stationary model with 40 sensors, even with non-stationary variance process. As we increase the number of sensors in the initial deployment, the Root Mean Squared error (RMS) prediction accuracies we get for placements of increasing size converge to those obtained for optimizing the placements based on the empirical covariance matrix. Figure 9(b) presents the results of the same experiment for the precipitation data. Here we can see that the nonstationary model estimated using 20 sensors leads to better RMS accuracies than the stationary model, even if latter is estimated using 160 sensors.
9.3
Comparison of Data-driven Placements with Geometric Design Criteria
We now compare placements based on our data-driven GP models with those based on the traditional disk model. This model assumes that every sensor can perfectly measure the phenomenon within a radius of r, and have no information outside this radius. Since choosing an appropriate radius for the disk model is very difficult in practice, we decided to choose r = 5m since for this radius 20 sensors could just spatially cover the entire space. We also learned stationary and non-stationary GP models as discussed in Section 9.2. 3
The measurement noise σ 2 was chosen by cross-validation.
31
1.6 S160
S40 1.5
1.4
N10 RMS error
RMS error (baseline 3.22)
2
N30 1
N40
N40 1.2 N80 1 N160
0.5 0.8
Empirical covariance 0 0
N20
5 10 15 Number of sensors placed
Empirical covariance
0
20
(a) Comparison of fits for temperature data.
10 20 30 Number of sensors placed
40
(b) Comparison of fits for precipitation data.
Figure 9: RMS curves for placements of increasing size, optimized using stationary and nonstationary GPs. Prediction is done using estimated models. (a) Stationary GP estimated for the temperature data from 40 sensors (S40), nonstationary GPs estimated from 10, 30 and 40 sensors (N10, N30, N40). (b) Stationary GP estimated for the precipitation data from 160 sensors (S160), nonstationary GPs estimated from 20, 40, 80 and 160 sensors (N20, N40, N80, N160). 1.6
2
RMS error
Disk model
S40
1.4 N30
RMS error
S30 1.5
1
1.2
Disk model N40
1
0.5 Empirical covariance 0 0
0.8
5 10 15 Number of sensors placed
0
(a) Comparison with disk model (Temperature)
Empirical covariance 5
10 15 20 25 Number of sensors placed
30
(b) Comparison with disk model (Precipitation)
Figure 10: RMS curves for placements of increasing size, optimized using the disk model, stationary and nonstationary GPs. Prediction for all placements is done using the empirical covariance. Stationary GPs and nonstationary GPs estimated from 30 sensors (N30, S30, for temperature data) or 40 sensors (N40, S40, for precipitation data). For the disk model, we used the greedy set covering algorithm. The design on both GP models was done using our greedy algorithm to maximize mutual information. For an increasing number of sensors, we compute the Root Mean Squares (RMS) prediction error on the test data. In order to separate the placement from the prediction task, we used the empirical covariance matrix estimated from the training data on all 46 locations for prediction, for all three placements. Figure 10(a) presents the results of this experiment. We can see that the geometrical criterion performs poorly compared to the model based approaches. We can see that the placements based on the empirical covariance matrix perform best, quite closely followed by the accuracies obtained by the designs based on the nonstationary process. Figure 10(b) shows the results for the same experiment on the precipitation data set. 32
(a) Placements of temperature sensors
(b) Placements of rain sensors
Figure 11: Example sensor placements for temperature and precipitation data. Squares indicate locations selected by mutual information, diamonds indicate those selected by entropy. Notice how entropy places sensors closer to the border of the sensing field.
9.4
Comparison of the Mutual Information and Entropy Criteria
We also compared the mutual information criterion to other design criteria. We first compare it against the entropy (variance) criterion. Using the empirical covariance matrix as our process, we use the greedy algorithm to select placements of increasing size, both for mutual information and for entropy. Figure 12(a) and Figure 12(b) show the results of this comparison on models estimated for the morning (between 8 am and 9 am) and noon (between 12 pm and 1 pm) in the Intel lab data. Figure 12(a) and Figure 12(b) plot the log-likelihood of the test set observations with increasing number of sensors for both models. Figure 12(e) presents the RMS error for a model estimated for the entire day. We can see that mutual information in almost all cases outperforms entropy, achieving better prediction accuracies with a smaller number of sensors. Figure 12(f) presents the same results for the precipitation data set. Mutual information significantly outperforms entropy as a selection criteria – often several sensors would have to be additionally placed for entropy to reach the same level of prediction accuracy as mutual information. Figure 11(b) shows where both objective values would place sensors to measure precipitation. It can be seen that entropy is again much more likely to place sensors around the border of the sensing area than mutual information. To gain further insight into the qualitative behavior of the selection criteria we learned a GP model using all sensors over one hour starting at noon. The model was fit with a isotropic Gaussian kernel and quadratic trend for the mean, using the geoR Toolkit (Ribeiro Jr. and Diggle, 2001). Figures 13(a) and 13(b) show the posterior mean and variance for the model. Using our algorithms, 22 sensors were chosen using the entropy and mutual information criteria. For each set of selected sensors, additional models were trained using only the measurements of the selected sensors. Predicted temperature surfaces for the entropy and mutual information configurations are presented in Figures 13(c) and 13(d). Entropy tends to favor placing sensors near the boundary as observed in Section 3, while mutual information tends to place the sensors on the top and bottom sides, which 33
1.4 1.2
Average RMS
Mutual Information Variance
0.6
0.6
0.7
0.8
1.0
1.2 1.0 0.9 0.8
Average RMS
1.1
Mutual Information Variance
0
5
10
15
20
25
30
0
5
10
Number of sensors
25
30
−200
(b) Noon RMS
−300 −400
Average Log−Likelihood
−500 −600
−700
−700
Mutual Information Variance
−500
Mutual Information Variance
−400
20
−600
−300
(a) Morning RMS
Average Log−Likelihood
15
Number of sensors
0
5
10
15
20
25
30
0
5
Number of sensors
10
15
20
25
30
Number of sensors
(c) Morning log-likelihood
(d) Noon log-likelihood
1.2
2
1 0.5 0 0
RMS error
RMS error
1.1 1.5
Entropy
0.9 Mutual information
0.8
Mutual information 5 10 15 Number of sensors placed
Entropy
1
0.7 0
20
(e) Entire day
5
10 15 20 25 Number of sensors placed
30
(f) Precipitation RMS
Figure 12: Prediction error and log-likelihood on test data for temperatures (a-e) and precipitation (f) in sensor network deployment, for an increasing number of sensors. exhibited the most complexity and should have a higher sensor density. The predicted variances for each model are shown in figures 13(e) and 13(f). The mutual information version has significantly 34
26
0.5
25
0.4
24
0.3
23
0.2
22
0.1
21 40
0 40 30
30 20
30
10
30 20
20
20 10
10 0
10 0
0
(a) Isotropic model
0
(b) Predicted variance
26
26
25
25
24
24
23
23
22
22
21 40
21 40 30
30 20
30
10
30 20
20
10
10 0
20 10 0
0
(c) Temperature (entropy)
0
(d) Temperature (mutual inf.)
0.5
0.5
0.4
0.4
0.3
0.3
0.2
0.2
0.1
0.1
0 40
0 40 30
30 20
30
10
20 10
10 0
30 20
20
10 0
0
(e) Variance (entropy)
0
(f) Variance (MI)
Figure 13: Comparison of predictive quality of subsets selected using MI and entropy.
lower variance than the entropy version almost everywhere, displaying, as expected, higher variance in the unsensed areas in the center of the lab. 35
9.5
Comparison of Mutual Information with Classical Experimental Design Criteria
In order to compare the mutual information placements with the classical optimality criteria, we performed the following experiment. We uniformly selected 12 target locations U in the lab as locations of interest. We then set up the linear model xS = ΣSU Σ−1 U U xU + w. Hereby, xS denotes measurements at the locations S, among which we choose our placement, xU are the values at the locations of interest (no sensors can be placed there), and w models independent normal measurement noise with constant variance. After subtraction of the training set mean, this model uses the Best Linear Unbiased (Kriging) estimator for predicting xS from xU . The problem becomes to select the sensor locations A ⊂ S which allow most precise prediction of the variables of interest, in the sense of minimizing the error covariance σ12 (AT A)−1 , where A = ΣSU Σ−1 UU . The different classical design criteria vary in how the scalarization of the error covariance is done. D-optimal design minimizes the log-determinant, A-optimal design minimizes the trace, and E-optimal design minimizes the spectral radius (the magnitude of the largest eigenvalue) of the error covariance. Note that this problem formulation favors the classical design criteria, which are tailored to minimize the error of predicting the values at the target locations U, whereas mutual information and entropy just try to decrease the uncertainty in the entire space. In order to solve the classical experimental design problems, we use the formulations as a semidefinite program (SDP) as discussed by Boyd and Vandenberghe (2004). We use SeDuMi (Sturm, 1999) for solving these SDPs. Since the integral optimization is hard, we solve the SDP relaxation to achieve a fractional design. This fractional solution defines the best way to distribute an infinite (or very large) budget of experiments to the different choices on the design menu (the variables in S). In the sensor selection problem however, we have to solve the integral problem, since we face the binary decision of whether a sensor should be placed at a particular location or not. This is a hard combinatorial optimization problem. Since no near-optimal solution is known, we select the locations corresponding to the top k coefficients of the design menu, as is common practice. We compare the placements using the classical design criteria to those using the mutual information and entropy criteria, and evaluate each of them on the RMS prediction accuracy on the hold-out locations U. Figure 14(a) presents the results of this experiment on the temperature data. We can see that even though mutual information optimizes for prediction accuracy in the entire space and not specifically for the target locations U, it incurs the least RMS prediction error, apart from the placements consisting only of a single sensor. E-optimal design performs comparably with the entropy criterion, and D- and A-optimality perform worse. When we performed the same experiment with the precipitation data, SeDuMi ran out of memory (1 GB) for the SDP required to solve the A-optimality criterion. The largest subsample we could solve for all A-, D- and E-optimality on this data set was limited to 111 locations. Figure 14(b) presents the results. For the entire data set of 167 locations, we could still solve the D- and E-optimality SDPs. The results are presented in Figure 14(c). We can observe that for the 111 locations, D-optimality slightly outperforms mutual information. We have to consider, however, that the classical criteria 36
3.5
1.3
D−optimal design
A−optimal design
2.5
RMS error on target
RMS error on target
3
2 E−optimal design
1.5 1 0.5 0 0
Mutual information 2
A−optimal design
1.2
E−optimal design Entropy
1.1 1 D−optimal design 0.9
Mutual information
Entropy
4 6 8 Number of sensors placed
0.8 0
10
5
10 15 20 25 Number of sensors placed
30
(a) Comparison with A-, D- and E-optimality on temper- (b) Comparison with A-, D- and E-optimality on precipature data itation data, 111 node subsample 200
1.1
E−optimal design
Running time (s)
RMS error on target
1.2
Entropy 1 0.9
0.8 0
Mutual information D−optimal design 5
10 15 20 25 Number of sensors placed
150
100
50
0
30
MI MI loc.
H
A
D
E
(c) Comparison with D- and E-optimality on precipita- (d) Running time for 111 node precipitation subsample tion data
Figure 14: Comparison with classical experimental design. We plot RMS prediction error on 25% hold out target locations U. are optimized to minimize the error covariance with respect to the locations U of interest, whereas mutual information merely tries to achieve uniformly low uncertainty over the entire space. For the full set of 167 locations, mutual information outperforms the other design criteria. Figure 14(d) presents the running time for optimizing A-, D-, E-optimality, and mutual information, mutual information with truncation parameter ε = 1 and entropy on the 111 node subsample of the precipitation data on a Pentium M 1.7 GHz processor. We can see that optimizing entropy is fastest, closely followed by the truncated mutual information criterion described in Section 5.2 that is further evaluated in Section 9.7. Even without truncation, optimizing mutual information is three times faster than (fractionally) optimizing D-optimality and 24 times faster than A-optimality.
9.6
Empirical Analysis of the Greedy Algorithm
To study the effectiveness of the greedy algorithm, we compared the mutual information of the sets selected by our greedy algorithm to random selections, to a hill climbing method that uses a pairwise 37
10.0
10 8 6 4
10.5
11.0
11.5
Mutual information
12
12.0
12.5
Greedy heuristic Maximum of 100 random trials Mean of 100 random trials
random mean
random maximum
random+ PE, max.
greedy+ PE
0
greedy heuristic
5
10
15
20
25
30
Number of sensors
(a) Objective values
(b) Comparison of heuristics
Figure 15: Comparison of the greedy algorithm with several heuristics. exchange heuristic, and – for small subsamples – to the bounds proved by the MIP as discussed in Section 4.5. In this experiment, we used the empirical covariance matrix as the input to the algorithms. Figure 15(b) shows that the greedy algorithm provided significantly better results than the random selections, and even the maximum of a hundred random placements did not reach the quality of the greedy placements. Furthermore, we enhanced the random and greedy selections with the pairwise exchange (PE) heuristic, which iteratively finds exchanges of elements y ∈ A and y 0 ∈ S \ A such that exchanging y and y 0 improves the mutual information score. Figure 15(a) presents objective values of these enhanced selection methods for a subset size of 12, for which the maximum over 100 random selections enhanced with PE actually exceeded the greedy score (unlike with most other subset sizes, where random + PE did about as well as the greedy algorithm). Typically, the objective values of random + PE, greedy + PE and greedy did not differ much. Note that as mentioned in Section 4, the performance guarantee for the greedy algorithm always provides an online approximation guarantee for the other heuristics. For a 16 node subsample of the temperature data set, we used the MIP from Section 4.5 to compute bounds on the optimal mutual information. Figure 5 presents the results. It can be seen, that for this small subsample, the greedy solution is never more than 5 percent away from the optimal solution, which is a much tighter bound than the a priori approximation factor of (1 − 1/e). We also experimented with the lazy evaluation strategy discussed in Section 5.1. For example when picking placements of size 50 for the precipitation data set, the number of mutual information computations decreased from 7125 to 1172, and the computation time on a Pentium M 1.7 GHz processor decreased from 41.3 seconds to 8.7 seconds. The results for both temperature and precipitation data sets are presented in Figures 16(a) and 16(b).
9.7
Results on Local Kernels
We also performed experiments to assess the running time versus quality trade-off incurred by using approximate local kernels. To provide intuition about the covariance structure, note that the 25, 50 38
800
Mutual information computations
Mutual information computations
1000 Standard greedy algorithm
600
Greedy using lazy evaluations
400 200 0 0
10000 Standard greedy algorithm 8000 6000 4000 Greedy using lazy evaluations
2000 0 0
5 10 15 20 Number of sensors placed
(a) Temperature data
20 40 60 Number of sensors placed
(b) Precipitation data
1.05 0.95
1.00
Average RMS
40 35 30 15
0.90
20
25
Time (seconds)
45
1.10
50
1.15
Figure 16: Performance improvements by using lazy evaluations of mutual information.
0.0
0.5
1.0
1.5
2.0
2.5
3.0
0.0
Truncation parameter
0.5
1.0
1.5
2.0
2.5
3.0
Truncation parameter
(a) Running time
(b) Approximation error
Figure 17: Analysis of the experiments with local kernels. (a) running times for increasing level of truncation. (b) increase of average RMS error with increasing level of truncation. Note that for a truncation between 0.5 and 1.2, a good tradeoff between running time and error is achieved. and 75 percentiles of the absolute covariance entries were 0.122, 0.263 and 0.442, the maximum was 3.51, the minimum was 8.78E−6. For the variance (the diagonal entries), the median was 1.70, and the minimum was 0.990. Figure 17(a) shows that the computation time can be drastically decreased as we increase the truncation parameter ε from 0 to the maximum variance. Figure 17(b) shows the RMS prediction accuracy for the 20 element subsets selected by Algorithm 3. According to the graphs, the range ε ∈ [0.5, 1] seems to provide the appropriate trade-off between computation time and prediction accuracy. In order to study the effect of local kernels on the placements, we performed the following experiment. We created a regular 7 by 7 grid with unit distance between neighboring grid points, and generated covariance matrices using two different GPs, one using the Gaussian (squared exponential) kernel, and the other using the the local kernel (Equation (11)). We exponentially increased the bandwidth in eight steps from 0.1 to 12.8. Figures 18 and 19 show the corresponding placements using mutual information to select the locations. From this experiment, we can see that the placements obtained using the non-local Gaussian kernel tend to be spread out slightly more, as one might expect. Overall, however, the placements appear to be very similar. In light of the computational advantages provided by local kernels, these results provide further evidence in the spirit of 39
Section 9.7, namely that local kernels can be a valuable tool for developing efficient model-based sensor placement algorithms. Parameter 0.10
Parameter 0.20
7
7
7
7
6
6
6
6
6
5
5
5
5
5
5
4
4
4
4
4
6
3
3
3
3
3
2
2
2
2
1
1
1
1
9 2
8
6
4
6
1
2
5
2
8
1
6
2
7
4 4
4 6 1
2
7
8
5
1
3
9
3
2
1
6
5
4
3
4
Parameter 12.80 4
6
7
2
6
2
7
5
4
3
2
4
1
3
5
1
9
3
5
4
3
2
6
1
Parameter 6.40 9
4
7
2
6
6
2
3
4
9
1
4
3
2
3 8
5
4
6
5
2
3
1
6
5
6
2
8
2
4
7
1
7
6
8
4
8
7
6
7
9 2
7
9
Parameter 3.20
Parameter 1.60 9
7
5
4
Parameter 0.80
Parameter 0.40
7
6
2
8
4
1
6
2
4
2
6
Figure 18: Placements under Gaussian kernel, mutual information criterion, increasing bandwidth
Parameter 0.10
Parameter 0.40
Parameter 0.20
7
7
7
7
7
6
6
6
6
6
5
5
5
5
5
4
4
4
4
4
3
3
3
3
3
2
2
2
2
1
1
1
1
9 2
8
4
6
Parameter 1.60 7
5
4
7 3 1
4
9 6
2
1
4
2
3
2
5 4
1
8
9
3
1
1
Parameter 6.40 8 5
6
4
2
4 4
6
2
1
9
3 4
6
Parameter 12.80 9 2
6
3
5
7
1
6
4
7
6
1
3
4
2
6
2
7
3
2
7
2
6
5
2
6
5
4 1
3
6 4
2
4
9
1
7
5
7 4
6
5
5
2
2
8
6
5
1
6
8
3
2
4
3
6
8
8
Parameter 3.20 7
7
6
9 2
Parameter 0.80 7
2
3 4
9
6
5
2
1
2
4 4
8
6
Figure 19: Placements under local kernel, mutual information criterion, increasing bandwidth
10
Future Work
There are several interesting possible extensions to the present work. Since the predictive variance in (2) does not depend on the actual observations, any closed-loop strategy which sequentially decides on the next location to measure, surprisingly, is equivalent to an open loop placement strategy which selects locations to make observations independently of the measured values. If there is uncertainty about the model parameters however, such as about the kernel bandwidths, then this is no longer 40
true. In this case, we expect a sequential, closed-loop strategy to be more effective for predicting spatial phenomena. Krause and Guestrin (2007) present bounds comparing the performance of the optimal sequential strategy with the optimal fixed placement. This bound essentially depends on the parameter entropy. We consider several exploration strategies for effectively reducing this parameter entropy and present sample complexity bounds. However, more work is needed in this area. Another interesting open question is whether an approximation algorithm can be found for optimizing sensor placements subject to submodular cost functions – usually, the more sensors we have to buy, the cheaper they become per unit. To address this problem, Narasimhan and Bilmes (2006) present a submodular-supermodular procedure for bicriteria-optimization of a submodular function of which a submodular cost is subtracted. This procedure, while elegant, unfortunately can not provide approximation guarantees for this problem. Of further interest are also constrained sensor placement problems, in which, for example, the placed sensors have to be connected in a routing tree, or have to lie on a collection of paths. Krause et al. (2006) provide evidence that submodularity can be leveraged to derive approximation algorithms for sensor placement even in these combinatorially even more challenging constrained optimization problems. However, there are still many open issues subject to further research.
11
Conclusions
In this paper, we tackle the problem of maximizing mutual information in order to optimize sensor placements. We prove that the exact optimization of mutual information is NP-complete, and provide an approximation algorithm that is within (1 − 1/e) of the maximum mutual information configuration by exploiting the submodularity in the criterion. We also illustrate that submodularity can be used to obtain online bounds, which are useful for bounding the quality of the solutions obtained by any optimization method, and for designing branch and bound algorithms for the mutual information criterion. In order to scale up the application of our approach, show how to exploit lazy evaluations and local structure in GPs to provide significant speed-ups. We also extend our submodularity-based analysis of mutual information to incorporate robustness to sensor failures and model uncertainty. Our very extensive empirical results indicate that data-driven placements can significantly improve the prediction accuracy over geometric models. We find, in contrast to previous work (Caselton et al., 1992; Zidek et al., 2000), that the mutual information criterion is often better than entropy and other classical experimental design criteria, both qualitatively and in prediction accuracy. In addition, the results show that a simple greedy algorithm for optimizing mutual information provides performance that is very close to the optimal solution in problems that are small enough to be solved exactly, and comparable to more complex heuristics in large problems. We believe this work can be used to increase the efficacy of monitoring systems, and is a step towards well-founded active learning algorithms for spatial and structured data.
41
Acknowledgments We would like to thank the anonymous referees for their valuable comments and suggestions on this work. This work was partially supported by NSF Grant No. CNS-0509383 and a gift from Intel Corporation. Carlos Guestrin was partly supported by an Alfred P. Sloan Fellowship. Ajit Singh acknowledges the support of NSERC.
A
Review: Learning Gaussian Processes
In this section, we give a brief overview of learning parameters of a Gaussian Process prior.
A.1
Learning Stationary GPs
Often, for sake of simplicity and model complexity, the kernel function K(u, v) is chosen from a parametric family, selected in terms of parameters θ. A requirement for a valid kernel function is that it is always positive-definite. For example, the square-exponential kernel � � ||u − v||2 K(u, v) = σ 2 exp h2 has two parameters, θ = {σ, h}. Other popular choices of parametric kernel functions are the exponential kernel, and the Mat´ern (Abrahamsen, 1997) class of covariance functions, which allow to explicitly control the differentiability of the sample functions. Learning a Gaussian process refers to the estimation of θ from training samples, each consisting of the value of the field at an index set. Given independent training samples, learning a Gaussian process in either a maximum likelihood or Bayesian framework is possible (Rasmussen and Williams, 2006, ch. 5). In the geostatistics literature, it is common to learn the parameters by least squares fit of the empirical variogram 2γ(h) = E[(Xs+h − Xs )2 ]) (c.f., Cressie, 1991). Another possibility, if multiple independent samples of the process are available, is to use cross-validation. Multiple training samples are often noisy replicates of the field over time. The training data are not independent, and the log-likelihood does not decompose over the data. Sometimes, only a single sample of a process is available, which can be observed at different locations. However, if the time between training samples is sufficiently large, and one assumes temporal stationarity (i.e., covariance between sensing locations does not vary with time), then treating the data as independent may suffice.
A.2
Overview of Nonstationarity
A Gaussian process is (weakly) stationary if it has constant mean, finite variance, and kernel function K(u, v) that depends only on the difference vector u − v. If we further assume that the kernel function only depends on the norm of the difference vector, then the process is isotropic. 42
In practice, stationarity is frequently violated, even once a mean trend has been subtracted from the data. Experiments in Section 9.2 illustrate the need for nonstationary models. Unlike the stationary case, there is no consensus on how to represent and learn nonstationary models. Capturing complex nonstationary behavior as exhibited by the phenomena we are interested in (c.f., Figure 1(b) and Figure 1(c)) is a difficult problem. The simplest nonstationary model for finite GPs (i.e., multivariate normal distributions) is the empirical covariance n
S=
1X (xi − x ¯)(xi − x ¯)T ∈ Rp×p n i=1
which requires that n > p for S to be non-singular. Furthermore the efficiency of this estimator is poor in high dimensions. Shrinking the eigenvalues of S (Stein, 1975; Ledoit and Wolf, 2004) or shrinking the estimator towards a simpler full-rank matrix (Daniels and Kass, 2001) addresses these problems. In low dimensions, this problem can be treated as an instance of finding a positive semidefinite Toeplitz matrix that is closest to the empirical covariance in Frobenius norm (Higham, 2002). In the sensor placement problem however, the covariance of at most a small set of initial locations is known, from observing a pilot deployment. It is crucial to be able to predict covariances for pairs of locations, at which no sensor has been placed. In this setting, several approaches have been proposed, mostly based on deformation, convolution or partitioning. An intuitively appealing approach for modeling nonstationarity is spatial deformation, which is similar in spirit to the nonlinear feature maps used, e.g., in Support Vector Machines (Vapnik, 1995). Spatial deformation maps nonstationary data, through a nonlinear function onto another space which is stationary. The main difficulty is determining an appropriate mapping. The pioneering approach by Sampson and Guttorp (1992) involves mapping the data onto a two dimensional space using nonmetric multidimensional scaling, and then warping the rest of the space using thin-plate splines. In a Bayesian approach, Snelson et al. (2003) suggest to model the mapping itself as a Gaussian process and learn it simultaneously with the process on the data. In our experiments with the data sets discussed in Section 9.1, we were not able to find appropriate good transformations of the process. Nonstationary GPs can be defined as the convolution of a positive-definite function f (s) at each point in the space with a white noise process. If the bandwidth of a Gaussian basis f is allowed to vary with its position, this yields the model of Gibbs (1997), and with fewer restrictions, (Higdon et al., 1998). These results were generalized to arbitrary isotropic f by Paciorek (2003) and subsequently by Stein (2005). While this approach is theoretically very elegant, as it for example allows to vary the differentiability of the process with space, the difficulties are to determine the spatially varying functions f (s). Paciorek (2003) suggests to equip these functions with a GP prior. In the partitioning approach, the space is partitioned into a disjoint collection of cells, each of which is modeled by a stationary Gaussian process (Gramacy, 2005; Kim et al., 2005). The method by Gramacy (2005) recursively partitions the space, and ties the parameters of the local stationary processes in a hierarchical model. The method of Kim et al. (2005) simultaneously infers a Voronoi partition and the models in each region. More generally, nonstationary behavior can be modeled using mixtures of Gaussian processes, in which each component has a different kernel function (Tresp, 2001). A related approach by Rasmussen and Ghahramani (2002) does not require a fixed 43
number of mixture components. These models however are not GPs anymore, and the predictive distributions (1) and (2) can no longer be computed in closed form.
A.3
Learning Nonstationary Kernels by Extrapolating Estimated Covariances
In this section we review the method we used for learning nonstationary GPs (Nott and Dunsmuir, 2002). For clarity, we limit the presentation to zero mean processes. The approach of Nott and Dunsmuir (2002) assumes that data from an initial deployment is available. More specifically, the assumption is that an estimate of the empirical covariance ΣAA at a set of observed locations is available, and that the process can be locally described by a collection of isotropic processes, associated with a set of reference points. More formally, define a set of reference points A = {z1 , z2 , . . . , zm }, m = |A|, and associate a zero mean Gaussian Process Wi with each of these reference points, with isotropic covariance Ri (s, t) = Ki (|s − t|2 ). Let Ci = E[Wi (zj )Wi (zk )]j,k be the covariance at the initial deployment A, and let ci (s) = (Ri (s, z1 ), . . . , Ri (s, zm )) the cross-covariances of the (arbitrary) location s and the initial deployment. Then the posterior GP Wi | [Wi (A) = a] has the form Wi (s) | [Wi (A) = a] = ci (s)Ci−1 w + δi (s), where δi , the residual variation, is a nonstationary, zero mean GP with covariance Rδi (s, t) = Ki (|s − t|2 ) − ci (s)Ci−1 ci (t). If the kernel functions Ri have been estimated from the sensors of the initial deployment which are close to zi , the hope is that the conditional process Wi | [Wi (A) = a] correctly describes the behavior of the global GP, locally around the location zi . The idea now is to define the global GP as a weighted sum of the local conditional GPs, “synchronized” by their measurements at A. More formally, define a zero-mean, multivariate normal distribution W ∗ with covariance ΣAA , and let Zi (s) = ci (s)Ci−1 W ∗ . By construction, W ∗ is uncorrelated with each δi . We define the global GP as a weighted combination of the Zi and the δi , namely X 1 Z(s) = πi (s)Zi (s) + πi (s) 2 δi (s). i
P Hereby, πi (s) is a mixture weight of process Wi at location s, and for all s, i πi (s) = 1. Nott and Dunsmuir (2002) show that the covariance of Z takes the following form: X X 1 1 RZ (s, t) = πi (s)πj (t)ci (s)Ci−1 ΣAA Cj−1 cj (t) + πi (s) 2 πi (t) 2 Rδi (s, t). i,j
i
As explained by Nott and Dunsmuir (2002), the reason for the particular choice of Z is the following property: Conditional on observing A = a, for the predictive distributions of the process it holds that X µs|A=a = πi (s)cTi Ci−1 a, i
44
and 2 = σs|A=a
X i
πi (s)Rδi (s, s) =
X
πi (s)[Ki (0) − ci (s)T Ci−1 ci (s)],
i
hence both the predictive mean and variance of the process Z are spatial averages over the means and variances of the predictive distributions of the local processes Zi . The process Z observes the covariance ΣAA at the initial deployment, and locally behaves similarly to the local processes Zi . The weights πi are chosen similar fashion to interpolation weights in kernel regression, and the local processes Zi are estimated using least squares fit of the empirical variogram, or by maximizing the marginal likelihood of the data, only taking into account the sensors from the initial deployment which are closest by. For more details on estimation please refer to Nott and Dunsmuir (2002).
B
Proofs
Proof [Theorem 2] Our reduction builds on the proof by Ko et al. (1995), who show that for any graph G, there exists a polynomially related, symmetric positive-definite matrix Σ such that Σ has a subdeterminant (of a submatrix resulting from the selection of k rows and columns i1 , . . . , ik ) greater than some M if G has a clique of size at least k, and Σ does not have a subdeterminant greater than M − ε for some (polynomially-large) ε > 0 if G does not have such a clique. Let G be a graph, and let Σ be the matrix constructed in Ko et al. (1995). We will consider Σ as the covariance matrix of a multivariate Gaussian distribution with variables XU = {X1 , . . . , Xn }. Introduce additional variables XS = {y1 , . . . , yn } such that yi |Xi = x ∼ N (x, σ 2 ). Note that a subset A ⊆ S, |A| = k, has maximum entropy of all such subsets if and only if the parents ΓA ⊂ U of A have maximum entropy among all such subsets of U. Now note that I(A; (U ∪ S) \ A) = H(A) − H(A|(U ∪ S) \ A) = H(A) − H(A|U), because yi and yj are conditionally independent given U. Furthermore, again because of independence, H(A|U) is a constant only depending on the cardinality of A. Assume we could decide efficiently whether there is a subset A ⊂ S such that I(A; V \ A) ≥ M 0 . If we choose σ 2 small enough, then this would allow us to decide whether G has a clique of size k, utilizing the gap ε. ˆ ˆ Proof [Lemma 5] Define K(x, y) = K(x, y) for x 6= y and K(x, x) = K(x, x) + σ 2 to include the sensor noise σ 2 . Since C is compact and K continuous, K is uniformly continuous over C. Hence, for any ε1 , there exists a δ1 such that for all x, x0 , y, y 0 , kx − x0 k2 ≤ δ1 , ky − y 0 k2 ≤ δ1 it holds that | K(x, y) − K(x0 , y 0 )| ≤ ε1 . Assume C1 ⊂ C is a finite mesh grid with mesh width 2δ1 . We allow sensor placement only on grid C1 . Let C2 ⊂ C be a mesh grid of mesh width 2δ1 , which is derived by translating C1 by δ1 in Euclidean norm, and let G1 , G2 denote the restriction of the GP G to C1 , C2 . We assume C1 , C2 cover C in the sense of compactness. We use the notation ˜· to refer ˆ is a symmetric strictly positive to the translated version in G2 of the random variable · in G1 . K ˆ ˆ X, ˜ y˜)| ≤ ε1 for all X, y ∈ G1 . Moreover, since K definite covariance function and |K(X, y) − K( ˆ is at least is positive semidefinite, the smallest eigenvalue of any covariance matrix derived from K 2 σ . 45
Let A be a subset of C1 and X ∈ C1 \ A. Using (5), we first consider the conditional variance 2 ˆ ˆ σX|A . By definition, ky − y˜k2 ≤ δ1 , and hence |K(X, y) − K(X, y˜)| ≤ ε1 for all y ∈ A. 2 Hence we know that kΣAA − ΣA˜A˜k2 ≤ kΣAA − ΣA˜A˜kF ≤ k ε1 . We furthermore note that max (Σ−1 ) = λmin (Σ −1 ≤ σ −2 , and hence kΣ−1 AA ) AA k2 = λ AA −1 −1 −1 kΣ−1 AA − ΣA˜A˜k2 = kΣAA (ΣA˜A˜ − ΣAA )ΣA˜A˜k2 −1 −4 2 ≤ kΣ−1 AA k2 kΣA˜A˜ − ΣAA k2 kΣA˜A˜k2 ≤ σ k ε1 .
√ We derive kΣX A˜ − ΣXA k2 ≤ kε1 1T k2 = ε1 k, hence −1 2 2 − σX| | = |ΣXA Σ−1 |σX|A ˜ |, AA ΣAX − ΣX A˜ΣA˜A˜ΣAX A˜ −1 −1 2 2 ≤ 2kΣXA − ΣX A˜k2 kΣ−1 AA k2 kΣXA k2 + kΣAA − ΣA˜A˜k2 kΣXA k2 + O(ε1 ), √ √ ≤ 2ε1 kσ −2 M k + σ −4 k 2 ε1 M 2 k + O(ε21 ), � ≤ ε1 kσ −2 M 2 + σ −2 k 2 M + O(ε21 ),
where M = maxx∈C K(x, x). We choose δ such that the above difference is bounded by σ 2 ε. We ˜ note that (assuming w.l.o.g. H(X|A) ≥ H(X|A)) σ2 ˜ = 1 log X|A ≤ log(1+ε) ≤ ε . H(X|A)−H(X|A) 2 2 2 σ2 ˜ X|A
which concludes the argument. Proof [Corollary 6] The higher order terms O(ε21 ) can be worked out as kσ −2 ε2 (1 + M k 2 σ −2 + εk 2 σ −2 ). Assuming that ε < min(M, 1), this is bounded by 3k 3 M σ −4 ε. Using the Lipschitz assumption, we can directly �compute δ1 from ε1 in the above proof, by letting δ = ε1 /L. Let R = kσ −2 M 2 + σ −2 k 2 M + 3k 3 M σ −4 . We want to choose δ such that ε1 R ≤ σ 2 ε. Hence if 2 ˜ ≤ ε uniformly as required. Note that in order to we choose δ ≤ σLRε , then |H(X|A) − H(X|A)| apply the result from Nemhauser et al. (1978), the approximate monotonicity has to be guaranteed for subsets of size 2k, which results in the stated bound.
Proof [Theorem 7] The following proof is an extension of the proof by Nemhauser et al. (1978), using some simplifications by Jon Kleinberg. Let s1 , . . . , sk be the locations selected by the greedy algorithm. Let Ai = {s1 , . . . , si }, A∗ be the optimal solution, and δi = MI(Ai ) − MI(Ai−1 ). By Lemma 5, we have, for all 1 ≤ i ≤ k, MI(Ai ∪ A∗ ) ≥ MI(A∗ ) − kε. We also have, for 0 ≤ i < k, ∗
MI(Ai ∪ A ) ≤ MI(Ai ) + kδi+1 =
i X j=1
46
δj + kδi+1 .
Hence we have the following sequence of inequalities: MI(A∗ ) − kε ≤ kδ1 MI(A∗ ) − kε ≤ δ1 + kδ2 .. . MI(A∗ ) − kε ≤
k−1 X
δj + kδk
j=1
�k−1 , and add all inequalities up. After Now we multiply both sides of the i-th inequality by 1 − k1 cancelation, we get ! k−1 k X X (1 − 1/k)i (MI(A∗ ) − kε) ≤ k δi = k MI(Ak ). i=0
i=1
Hence, as claimed, with AG = Ak (i.e., AG is the k-element greedy solution) � � MI(AG ) ≥ 1 − (1 − 1/k)k (MI(A∗ ) − kε) ≥ (1 − 1/e)(MI(A∗ ) − kε).
2
K(Z,y) 1 Proof [Remark 12] We have that H(y|Z) < 0 ⇔ K(y, y) + σ 2 − K(Z,Z)+σ 2 < 2πe . Using a similar argument as the proof of Lemma 5, for very fine discretizations, there exists a y arbitrarily close to Z, such that for any α > 0, | K(Z, Z) − K(y, y)| ≤ α and | K(Z, Z) − K(Z, y)| ≤ α. Plugging these bounds into the definition of H(y|Z) and some algebraic manipulation proves the claim.
References P. Abrahamsen. A review of Gaussian random fields and correlation functions. Technical Report 917, Norwegian Computing Center, Oslo, 1997. A. C. Atkinson. Recent developments in the methods of optimum and related experimental designs. International Statistical Review / Revue Internationale de Statistique, 56(2):99–115, Aug. 1988. A. C. Atkinson. The usefulness of optimum experimental designs. Journal of the Royal Statistical Society. Series B (Methodological), 58(1):59–76, 1996. S. Axelrod, S. Fine, R. Gilad-Bachrach, R. Mendelson, and N. Tishby. The information of observations and application for active learning with uncertainty. Technical report, Jerusalem: Leibniz Center, Hebrew University, 2001. X. Bai, S. Kumar, Z. Yun, D. Xuan, and T. H. Lai. Deploying wireless sensors to achieve both coverage and connectivity. In ACM International Symposium on Mobile Ad Hoc Networking and Computing, Florence, Italy, 2006. J. M. Bernardo. Expected information as expected utility. Annals of Statistics, 7(3):686–690, May 1979. S. Boyd and L. Vandenberghe. Convex Optimization. Cambridge UP, March 2004.
47
W. F. Caselton and T. Hussain. Hydrologic networks: Information transmission. Journal of Water Resources Planning and Management, WR2:503–520, 1980. W. F. Caselton and J. V. Zidek. Optimal monitoring network designs. Statistics and Probability Letters, 2(4):223–227, 1984. W. F. Caselton, L. Kan, and J. V. Zidek. Statistics in the Environmental and Earth Sciences, chapter Quality data networks that minimize entropy, pages 10–38. Halsted Press, 1992. K. Chaloner and I. Verdinelli. Bayesian experimental design: A review. Statistical Science, 10(3):273–304, Aug. 1995. ISSN 08834237. D. A. Cohn. Neural network exploration using optimal experiment design. In Jack D. Cowan, Gerald Tesauro, and Joshua Alspector, editors, Advances in Neural Information Processing Systems, volume 6, pages 679–686. Morgan Kaufmann Publishers, Inc., 1994. R. D. Cook and C. J. Nachtsheim. A comparison of algorithms for constructing exact D-optimal designs. Technometrics, 22(3):315–324, Aug. 1980. ISSN 00401706. T. M. Cover and J. A. Thomas. Elements of Information Theory. Wiley Interscience, 1991. N. A. C. Cressie. Statistics for Spatial Data. Wiley, 1991. C. Currin, T. Mitchell, M. Morris, and D. Ylvisaker. Bayesian prediction of deterministic functions, with applications to the design and analysis of computer experiments. Journal of the American Statistical Association, 86(416):953–963, 1991. M. J. Daniels and R. E. Kass. Shrinkage estimators for covariance matrices. Biometrics, 57:1173–1184, December 2001. A. Das and D. Kempe. Algorithms for subset selection in linear regression. In under review, 2007. A. Deshpande, C. Guestrin, S. Madden, J. Hellerstein, and W. Hong. Model-driven data acquisition in sensor networks. In Proceedings of the Thirtieth International Conference on Very Large Data Bases (VLDB), 2004. V. Federov and W. Mueller. Comparison of two approaches in the optimal design of an observation network. Statistics, 20:339–351, 1989. V. V. Fedorov. Theory of Optimal Experiments. Academic Press, 1972. Trans. W. J. Studden and E. M. Klimko. P. Flaherty, M. Jordan, and A. Arkin. Robust design of biological experiments. In Advances in Neural Information Processing Systems (NIPS) 19, 2006. Y. Freund, H. S. Seung, E. Shamir, and N. Tishby. Selective sampling using the query by committee algorithm. Machine Learning, 28(2-3):133–168, 1997. M. Gibbs. Bayesian Gaussian Processes for Regression and Classification. PhD thesis, University of Cambridge, 1997. G. Golub and C. Van Loan. Matrix Computations. Johns Hopkins, 1989. H. H. Gonzalez-Banos and J. Latombe. A randomized art-gallery algorithm for sensor placement. In Proc. 17th ACM Symposium on Computational Geometry, pages 232–240, 2001. R. B. Gramacy. Bayesian Treed Gaussian Process Models. PhD thesis, University of California, Santa Cruz, CA 95064, December 2005. Department of Applied Math & Statistics. C. Guestrin, A. Krause, and A. Singh. Near-optimal sensor placements in Gaussian processes. In Machine Learning, Proceedings of the Twenty-Second International Conference (ICML), 2005. P. Guttorp, N. D. Le, P. D. Sampson, and J. V. Zidek. Using entropy in the redesign of an environmental monitoring network. Technical report, Department of Statistics. University of British Columbia., 1992. Tech. Rep. 116.
48
T. Hastie, R. Tibshirani, and J. H. Friedman. The Elements of Statistical Learning. Springer, 2003. N. Heo and P. K. Varshney. Energy-efficient deployment of intelligent mobile sensor networks. IEEE Transactions on Systems, Man and Cybernetics, Part A, 35(1):78–92, 2005. D. Higdon, J. Swall, and J. Kern. Non-stationary spatial modeling. In Jos M. Bernardo, James O. Berger, A. P. Dawid, and Adrian F. M. Smith, editors, Bayesian Statistics 6: Proceedings of the Sixth Valencia International Meeting, volume 6. Oxford UP, 1998. N. J. Higham. Computing the nearest correlation matrix – a problem from finance. IMA Journal of Numerical Analysis, 22:329–343, 2002. D. S. Hochbaum and W. Maas. Approximation schemes for covering and packing problems in image processing and VLSI. Journal of the ACM, 32:130–136, 1985. H. Hotelling. Relations between two sets of variates. Biometrika, 28(3/4):321–377, 1936. A. Howard, M. Mataric, and G. Sukhatme. Mobile sensor network deployment using potential fields: A distributed, scalable solution to the area coverage problem, 2002. R. Kershner. The number of circles covering a set. American Journal of Mathematics, 61:665–671, 1939. H-.K. Kim, B. K. Mallick, and C. C. Holmes. Analyzing nonstationary spatial data using piecewise Gaussian processes. Journal of the American Statistical Association, 100(16):653–668, June 2005. C. Ko, J. Lee, and M. Queyranne. An exact algorithm for maximum entropy sampling. Operations Research, 43(4): 684–691, 1995. A. Krause and C. Guestrin. A note on the budgeted maximization of submodular functions. Technical report, CMUCALD-05-103, 2005. A. Krause and C. Guestrin. Nonmyopic active learning of gaussian processes: An exploration–exploitation approach. In ICML, 2007. A. Krause, C. Guestrin, A. Gupta, and J. Kleinberg. Near-optimal sensor placements: Maximizing information while minimizing communication cost. In roceedings of the Fifth International Symposium on Information Processing in Sensor Networks (IPSN), 2006. N. Lawrence, M. Seeger, and R. Herbrich. Fast sparse gaussian process methods: The informative vector machine. In Advances in Neural Information Processing Systems (NIPS) 16, 2003. O. Ledoit and M. Wolf. A well-conditioned estimator for large-dimensional covariance matrices. Journal of Multivariate Analysis, 88(2):365–411, February 2004. U. Lerner and R. Parr. Inference in hybrid networks: Theoretical limits and practical algorithms. In Proceedings of the 17th Conference in Uncertainty in Artificial Intelligence (UAI), 2001. D. V. Lindley. On a measure of the information provided by an experiment. Annals of Mathematical Statistics, 27: 986–1005, 1956. D. V. Lindley and A. F. M. Smith. Bayes’ estimates for the linear model. Journal of the Royal Statistical Society, Ser. B, 34:1–18, 1972. S. P. Luttrell. The use of transinformation in the design of data sampling schemes for inverse problems. Inverse Problems, 1:199–218, 1985. D. MacKay. Information-based objective functions for active data selection. Neural Computation, 4(4):590–604, 1992. D. J. C. MacKay. Information Theory, Inference, and Learning Algorithms. Cambridge UP, 2003.
49
G. P. McCabe. Principal variables. Technometrics, 26(2):137–144, 1984. M. D. McKay, R. J. Beckman, and W. J. Conover. A comparison of three methods for selecting values of input variables in the analysis of output from a computer code. Technometrics, 21(2):239–245, May 1979. R. K. Meyer and C. J. Nachtsheim. Constructing exact D-optimal experimental designs by simulated annealing. American Journal of Mathematical and Management Sciences, 8(3-4):329–359, 1988. T. J. Mitchell. An algorithm for the construction of ”D-optimal” experimental designs. Technometrics, 16(2):203–210, May 1974a. ISSN 00401706. T.J. Mitchell. Computer construction of ”D-optimal” first-order designs. Technometrics, 16(2):211–220, May 1974b. ISSN 00401706. B. Moghaddam, Y. Weiss, and S. Avidan. Spectral bounds for sparse PCA: Exact and greedy algorithms. In Advances in Neural Information Processing Systems (NIPS) 18, 2005. B. Moghaddam, Y. Weiss, and S. Avidan. Generalized spectral bounds for sparse LDA. In Machine Learning, Proceedings of the Twenty-Third International Conference (ICML), 2006. M. Narasimhan and J. Bilmes. A submodular-supermodular procedure with applications to discriminative structure learning. In Advances in Neural Information Processing Systems (NIPS) 19, 2006. G. Nemhauser, L. Wolsey, and M. Fisher. An analysis of the approximations for maximizing submodular set functions. Mathematical Programming, 14:265–294, 1978. G. L. Nemhauser and L. A. Wolsey. Studies on Graphs and Discrete Programming, chapter Maximizing Submodular Set Functions: Formulations and Analysis of Algorithms, pages 279–301. North-Holland, 1981. N-.K Nguyen and A. J. Miller. A review of some exchange algorithms for constructing discrete D-optimal designs. Computational Statistics and Data Analysis, 14:489–498, 1992. D. J. Nott and W. T. M. Dunsmuir. Estimation of nonstationary spatial covariance structure. Biometrika, 89:819–829, 2002. A. O’Hagan. Curve fitting and optimal design for prediction (with discussion). Journal of the Royal Statistical Society, Ser. B, 40:1–42, 1978. C. J. Paciorek. Nonstationary Gaussian Processes for Regression and Spatial Modelling. PhD thesis, Carnegie Mellon University, Pittsburgh, PA, May 2003. L. Paninski. Asymptotic theory of information-theoretic experimental design. Neural Computation, 17(7):1480–1507, 2005. F. Pukelsheim. Information increasing orderings in experimental design theory. International Statistical Review / Revue Internationale de Statistique, 55(2):203–219, Aug. 1987. ISSN 03067734. N. Ramakrishnan, C. Bailey-Kellogg, S. Tadepalli, and V. N. Pandey. Gaussian processes for active data mining of spatial aggregates. In SIAM Data Mining, 2005. C. E. Rasmussen and Z. Ghahramani. Infinite mixtures of Gaussian process experts. In Advances in Neural Information Processing Systems (NIPS) 14, 2002. C. E. Rasmussen and C. K. I. Williams. Gaussian Process for Machine Learning. Adaptive Computation and Machine Learning. MIT Press, 2006. P. J. Ribeiro Jr. and P. J. Diggle. geoR: A package for geostatistical analysis. R-NEWS Vol 1, No 2. ISSN 1609-3631, 2001.
50
T. G. Robertazzi and S. C. Schwartz. An accelerated sequential algorithm for producing D-optimal designs. SIAM Journal of Scientific and Statistical Computing, 10(2):341–358, March 1989. J. Sacks, S. B. Schiller, and W. J. Welch. Designs for computer experiments. Technometrics, 31(1):41–47, Feb. 1989. ISSN 00401706. P. D. Sampson and P. Guttorp. Nonparametric estimation of nonstationary spatial covariance structure. Journal of the American Statistical Association, 87(417):108–119, Mar. 1992. ISSN 01621459. P. Sebastiani and H. P. Wynn. Maximum entropy sampling and optimal bayesian experimental design. Journal of the Royal Statistical Society, Series B, 62(1):145–157, 2000. M. Seeger. Gaussian processes for machine learning. International Journal of Neural Systems, 14(2):69–106, 2004. M. Seeger, C. K. I. Williams, and N. D. Lawrence. Fast forward selection to speed up sparse gaussian process regression. In Proceedings of the Ninth International Workshop on Artificial Intelligence and Statistics (AISTATS), 2003. S. Seo, M. Wallat, T. Graepel, and K. Obermayer. Gaussian process regression: Active data selection and test point rejection. In Proceedings of the International Joint Conference on Neural Networks (IJCNN), volume 3, pages 241– 246, 2000. M. C. Shewry and H. P. Wynn. Maximum entropy sampling. Journal of Applied Statistics, 14:165–170, 1987. A. Singh, A. Krause, C. Guestrin, W. Kaiser, and M. Batalin. Efficient planning of informative paths for multiple robots. In IJCAI, 2007. E. Snelson and Z. Ghahramani. Sparse Gaussian processes using pseudo-inputs. In Advances in Neural Information Processing Systems (NIPS) 18, 2005. E. Snelson, C. E. Rasmussen, and Z. Ghahramani. Warped Gaussian processes. In Advances in Neural Information Processing Systems (NIPS) 16, 2003. P. Sollich. Learning from minimum entropy queries in a large committee machine. Physical Review E, 53:R2060–R2063, 1996. C. Stein. Estimation of a covariance matrix. Rietz Lecture, 39th Annual Meeting Institute of Mathematical Sciences. Atlanta, Georgia, 1975. M. L. Stein. Nonstationary spatial covariance functions. Technical Report 21, University of Chicago, 2005. A. J. Storkey. Truncated covariance matrices and Toeplitz methods in Gaussian processes. In Artificial Neural Networks - ICANN 1999, 1999. J. F. Sturm. Using sedumi 1.02, a matlab toolbox for optimization over symmetric cones. Optimization Methods and Software, special issue on interior-point methods, 11(12):625–653, 1999. M. Sviridenko. A note on maximizing a submodular set function subject to knapsack constraint. Operations Research Letters, 32:41–43, 2004. S. Toumpis and G. A. Gupta. Optimal placement of nodes in large sensor networks under a general physical layer model. In Proc. IEEE Communications Society Conference on Sensor and Ad Hoc Communications (SECON), 2005. V. Tresp. Mixtures of Gaussian processes. In Advances in Neural Information Processing Systems (NIPS) 13. MIT Press, 2001. V. Vapnik. The Nature of Statistical Learning Theory. Springer, 1995. W. J. Welch. Branch-and-bound search for experimental design based on D-optimality and other criteria. Technometrics, 24(1):41–48, 1982.
51
M. Widmann and C. S. Bretherton. 50 km resolution daily precipitation for the pacific northwest. http://www.jisao.washington.edu/data sets/widmann/, May 1999. S. Wu and J. V. Zidek. An entropy based review of selected NADP/NTN network sites for 1983–86. Atmospheric Environment, 26A:2089–2103, 1992. D. Ylvisaker. A Survey of Statistical Design and Linear Models, chapter Design on Random Fields. North-Holland, 1975. K. Yu, J. Bi, and V. Tresp. Active learning via transductive experimental design. In Machine Learning, Proceedings of the Twenty-Third International Conference (ICML), 2006. Z. Zhu and M. L. Stein. Spatial sampling design for prediction with estimated parameters. Journal of Agricultural, Biological and Environmental Statistics, 11:24–49, 2006. J. V. Zidek, W. Sun, and N. D. Le. Designing and integrating composite networks for monitoring multivariate gaussian pollution fields. Applied Statistics, 49:63–79, 2000. D. L. Zimmerman. Optimal network design for spatial prediction, covariance parameter estimation, and empirical prediction. Environmetrics, 17(6):635–652, 2006.
52
Carnegie Mellon University 5000 Forbes Avenue Pittsburgh, PA 15213
Carnegie Mellon University does not discriminate and Carnegie Mellon University is required not to discriminate in admission, employment, or administration of its programs or activities on the basis of race, color, national origin, sex or handicap in violation of Title VI of the Civil Rights Act of 1964, Title IX of the Educational Amendments of 1972 and Section 504 of the Rehabilitation Act of 1973 or other federal, state, or local laws or executive orders. In addition, Carnegie Mellon University does not discriminate in admission, employment or administration of its programs on the basis of religion, creed, ancestry, belief, age, veteran status, sexual orientation or in violation of federal, state, or local laws or executive orders. However, in the judgment of the Carnegie Mellon Human Relations Commission, the Department of Defense policy of, "Don't ask, don't tell, don't pursue," excludes openly gay, lesbian and bisexual students from receiving ROTC scholarships or serving in the military. Nevertheless, all ROTC classes at Carnegie Mellon University are available to all students. Inquiries concerning application of these statements should be directed to the Provost, Carnegie Mellon University, 5000 Forbes Avenue, Pittsburgh PA 15213, telephone (412) 268-6684 or the Vice President for Enrollment, Carnegie Mellon University, 5000 Forbes Avenue, Pittsburgh PA 15213, telephone (412) 268-2056 Obtain general information about Carnegie Mellon University by calling (412) 268-2000