unreliable subspace clustering. To recover the subspaces when the data are corrupted, SSC, LRR, LSR, and CASS employ different norms to describe different ...
Subspace Clustering by Mixture of Gaussian Regression Baohua Li1 ,Ying Zhang1 , Zhouchen Lin2,3 and Huchuan Lu1 1 Dalian University of Technology 2 Key Laboratory of Machine Perception (MOE), School of EECS, Peking University 3 Cooperative Medianet Innovation Center, Shanghai, China
Abstract Subspace clustering is a problem of finding a multisubspace representation that best fits sample points drawn from a high-dimensional space. The existing clustering models generally adopt different norms to describe noise, which is equivalent to assuming that the data are corrupted by specific types of noise. In practice, however, noise is much more complex. So it is inappropriate to simply use a certain norm to model noise. Therefore, we propose Mixture of Gaussian Regression (MoG Regression) for subspace clustering by modeling noise as a Mixture of Gaussians (MoG). The MoG Regression provides an effective way to model a much broader range of noise distributions. As a result, the obtained affinity matrix is better at characterizing the structure of data in real applications. Experimental results on multiple datasets demonstrate that MoG Regression significantly outperforms state-of-the-art subspace clustering methods.
1. Introduction Subspace clustering models high-dimensional data as samples drawn from a union of multiple low-dimensional subspaces. It has been attracting more and more attention in recent years and has found many applications in computer vision and image processing, such as image segmentation [30], motion segmentation [21], face clustering [6], and image representation and compression [24].
1.1. Related Work A number of approaches to subspace clustering have been proposed in the past two decades. These methods can be roughly divided into four main categories: algebraic methods [14, 22, 4], iterative methods [2, 1], statistical methods [13, 18, 29], and spectral-clustering-based methods [23, 28, 5, 9, 12, 19, 10]. It should be noted that the spectral-clustering-based methods, which are based on the spectral graph theory [3], have shown excellent performance in many real applications.
Generally, the spectral-clustering-based methods consist of two steps. Firstly, an affinity matrix is built to capture the similarity between pairs of sample points. Secondly, graph cut is applied to a graph, whose vertices are the samples and whose weights are prescribed by the affinity matrix, for segmenting the sample points. Building a ”good” affinity matrix is key to guarantee a good clustering result. So many subspace clustering methods focus on bringing up a good affinity matrix. Based on the fact that each data point in a union of subspaces can be represented as a linear or affine combination of other points, the Sparse Subspace Clustering (SSC) algorithm [5] utilizes the ℓ1 -norm to find the sparsest representation of a data point, where points from the same subspace correspond to the nonzero representation coefficients. LowRank Representation (LRR) [9] aims to get a low rank representation for robust subspace recovery of the data containing corruptions. Least Squares Regression (LSR) [12] employs the Frobenius norm to speed up the clustering process, while still ensuring the grouping effect of the representation matrix. However, the solution to SSC may be too sparse to encode the data correlation, while both LRR and LSR may result in dense connections between clusters. To achieve a good balance between within-cluster density (which we call grouping effect afterwards) and between-cluster sparsity, Correlation Adaptive Subspace Segmentation (CASS) [10] adopts trace Lasso, which is adaptive to the data correlation, to regularize the representation matrix. As pointed out by Liu et al. [9], noise which always exists in data can perturb the subspace structures, leading to unreliable subspace clustering. To recover the subspaces when the data are corrupted, SSC, LRR, LSR, and CASS employ different norms to describe different types of noise, respectively. Given data matrix X = (x1 , x2 , ..., xN ) ∈ RM ×N with N samples in RM , we denote E ∈ RM ×N and Z ∈ RN ×N as the noise matrix and the representation matrix, respectively, where the entry Zij of Z measures the similarity between points xi and xj . We use k · kF , k · k1 , k · k2 , k · k2,1 , and k · k∗ to denote Frobenius norm, the ℓ1 -norm (sum of
absolute values), the ℓ2 -norm, the ℓ2,1 -norm (sum of the ℓ2 norm of columns of a matrix), and the nuclear norm (sum of singular values), respectively. The mathematical models of existing representative subspace clustering methods are as follows. Sparse Subspace Clustering (SSC) [5]: min k E k1 +λ k Z k1 Z,E
s.t. X = XZ + E, diag (Z) = 0. Low-Rank Representation (LRR) [9]: min k E k2,1 +λ k Z k∗ Z,E
s.t. X = XZ + E.
approximated by a mixture of a sufficient number of Gaussians. Namely, we utilize the mixture of Gaussian (MoG) model to describe real noise accurately, rather than assuming some specific distribution for noise. The number of Gaussians can be estimated by cross validation. As for the regularization on Z, we simply choose the Frobenius norm. The reasons are two-fold. First, we want to demonstrate the effect of noise modeling on subspace clustering. So a simple regularization on Z can better expose such an effect. Second, with the Frobenious norm on Z the computation can be made much easier. For example, we can employ the traditional Expectation Maximization (EM) algorithm to solve our new subspace clustering model.
1.2. Paper Contributions and Organization
Least Squares Regression (LSR) [12]:
We summarize the contributions of this paper as follows:
min k E k2F +λ k Z k2F
• We present a novel subspace clustering approach called Mixture of Gaussian Regression (MoG Regression), which employs the MoG model to characterize noise with a complex distribution.
Z,E
s.t. X = XZ + E, diag (Z) = 0. Correlation (CASS) [10]:
Adaptive
min k E k2F +λ Z,E
Subspace N P
Segmentation
• We prove that MoG Regression has the grouping effect, which is important for subspace clustering. k Xdiag (z i ) k∗
n=1
s.t. X = XZ + E. In the above formulations, z i is the i-th column of Z, diag (z i ) is a diagonal matrix with entries of z i on its diagonal, and λ > 0 is a parameter to balance the effects of two terms. k E k2F is utilized to model Gaussian noise, k E k2,1 is for sample-specific corruptions, and k E k1 is for entry-wise corruptions. All the methods mentioned above rely on specific norms on Z and E to encourage the between-cluster sparsity and grouping effect of the representation matrix. However, they all use a simple norm for the noise term, which has a significant influence on the performance of the subspace clustering model. If the data are contaminated by noise, the subspace structures, grouping effect, and the data similarity are all likely to be corrupted. How the effect will be depends on the distribution of noise. In this situation, if we simply require the representation matrix to be sparse or block diagonal without deeply analyzing the noise, the subspaces may not be accurately recovered, leading to unsatisfactory clustering results. Unfortunately, real noise in applications often exhibits very complex statistical distributions, rather than simply being Gaussian or sparse [31]. So the noise cannot be easily described by a simple norm like the Frobenious norm, ℓ1 -norm, or ℓ2,1 -norm. Therefore, how to properly model the noise is of significant importance for subspace clustering. To address this issue, we apply a fundamental result of probability theory that almost any distribution can be well
The remainder of the paper is organized as follows. In Section 2, we motivate and introduce the MoG Regression method for clustering data with complex noise. In Section 3 we prove the grouping effect of the proposed model. Section 4 provides experimental results on motion segmentation, hand-written digits clustering, and complex face clustering to demonstrate the superiority of MoG Regression.
2. Subspace Clustering via MoG Regression As described in [11], we consider subspace clustering as the following optimization problem: min L (E) + R (Z) Z,E
s.t. X = XZ + E,
(1)
where L (E) is the loss function to describe noise and R (Z) is the regularization term to impose some properties on the representation matrix Z. From (1) we see that how to describe noise has significant importance in subspace clustering. Lu et al. [11] proposed Correntropy Induced L2 (CIL2) graph, which uses correntropy to process non-Gaussian and impulsive noise for robust subspace clustering, and the effectiveness is demonstrated by experiments of face clustering under various types of corruptions and occlusions. In fact, the variation of the width of kernel function makes the behavior of Correntropy Induced Metric changes between ℓ0 , ℓ1 , and ℓ2 norms, which is effective for many types of noise but not for general noise anyway.
2.1. MoG Regression In this paper, we propose a novel method called MoG Regression, which employs MoG to characterize general noise for robust subspace clustering. We assume that each column en (n = 1 , . . . , N ) in E follows an MoG distribution, i.e., p (en ) =
K X
πk N (en | 0, Σk ) ,
k=1
where K is the number of Gaussian components PK and πk denotes the mixing weight with πk ≥ 0 and k=1 πk = 1. N (en | 0, Σk ) is the zero-mean multivariate Gaussian distribution, with Σk (k = 1, 2, . . . , K) denoting the covariance matrix. Similar to classical regression analysis, all columns in E are assumed to be independently and identically distributed. So we have p (E) =
K N X Y
πk N (en | 0, Σk ) .
n=1 k=1
In a general MoG model, we wish to find π = ⊤ (π1 , ..., πK ) and Σ = (Σ1 , ..., ΣK ) that maximize p (E), which is equivalent to minimizing the negative log likelihood function defined as ! N K X X − ln p (E) = − ln πk N (en | 0, Σk ) . n=1
k=1
If we utilize L (E) = − ln p (E) to replace the Frobenius norm in the LSR model, then the proposed MoG Regression method can be formulated as follows: �K � N P P min − ln πk N (en | 0, Σk ) + λ k Z k2F Z,E,π,Σ
n=1
k=1
s.t. X = XZ + E, diag (Z) = 0, K P πk ≥ 0, Σk ∈ S+ , k = 1, ..., K, πk = 1, k=1
(2) where λ > 0 is the regularization parameter, S+ is the set of symmetrical positive definite (SPD) matrices and the constraint diag (Z) = 0 discourages using a sample to represent itself. Here we simply choose the Frobenius norm to regularize Z. As stated before, the Frobenious norm on Z can not only reduce the computation cost but also expose the the effect of MoG regression based noise modeling on subspace clustering. A natural way to solve (2) is the EM algorithm, which finds the maximum-likelihood estimate of the parameters iteratively. It starts from an initial guess and iteratively runs an expectation (E) step, which evaluates the posterior probabilities using currently estimated parameters, and
a maximization (M) step, which re-estimates the parameters based on the probabilities calculated in the E step. The iterations stop until some convergence criteria are satisfied [26, 27, 16]. Integrating the traditional steps of the EM algorithm, we can obtain the solution to problem (2) in three main steps. First, we initialize the representation matrix Z, mixing coefficients πk , and covariance matrices Σk , k = 1, ..., K. In the E-step, we compute the posterior probabilities based on the current parameters: πk N (e en | 0, Σk ) , γn,k = PK en | 0, Σj ) j=1 πj N (e
fn z n − xn and X fn is a copy of X except where e en = X that the n-th column is 0. In the M-step, we need to minimize our model with respect to the parameters, using the current posterior probabilities. To find Σk , k = 1, 2, . . . , K, we solve the following optimization problem �P � N P K min − ln π N (e e | 0, Σ ) n k k=1 k Σk
n=1
s.t. Σk ∈ S+ .
Setting the derivative of the objective function with respect to Σk to zero, we obtain ! N X 1 ⊤ γn,k e en + ǫI , Σk = en · e γn,k n=1
where ǫ > 0 is a small regularization parameter to ensure that Σk is invertible. Each πk , k = 1, 2, . . . , K, is updated by solving ! ! N K K X X X ln πk N (e en | 0, Σk ) +β πk − 1 , min −
πk ≥0
n=1
k=1
k=1
where β > 0 is the Lagrangian multiplier. We find β = N and accordingly πk =
N 1 X γn,k . N n=1
Each column of Z is updated by solving the following problem: ! N K X X min − ln πk N (e en | 0, Σk ) + λ k Z k2F . zn
n=1
k=1
By setting the derivative of object function with respect to z n to zero, we get zn =
PK
k=1
⊤
fn Σ−1 X fn πk N (e en | 0, Σk ) X k + 2λI PK en | 0, Σj ) j=1 πj N (e
!−1
bn ,
where
Algorithm 1: Finding the solution of (2) by EM bn =
PK
fn Σ−1 πk N (e en | 0, Σk ) X k xn . PK π N (e e | 0, Σ ) n j j=1 j
k=1
Then we substitute the renewed Σk , πk , and Z in (2) for the next iteration. The optimization algorithm for solving(2) is summarized in Algorithm 1.
Initialize: data matrix X, covariance matrices Σk , parameter λ, threshold value ε, initial representation matrix Z, and the components number K. Repeat : 1: Compute γn,k :
2.2. MoG Regression for Subspace Clustering Similar to the previous methods [5, 9, 12], our clustering method is also based on the spectral clustering theory [3, 17]. After solving the MoG Regression problem (2) to get the representation matrix Z, we define the affinity matrix as
γn,k
f old where e eold n = X n z n − xn .
2: Update the Σk , πk , and Z:
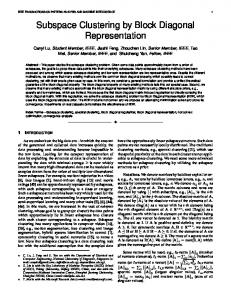
C =| Z | + | Z ⊤ |, where each entry Cij in C measures the similarity between data points xi and xj . Figure 1 illustrates the affinity matrices of 10 subjects clustering derived by SSC, LRR, LSR, CASS, CIL2, and the proposed MoG Regression on the AR database, respectively, where the facial variations, illumination variations, and occlusions can be regarded as complex noise added to the original images. We can see that the affinity matrices by SSC and CASS are sparse due to the sparsity regularization, while the correlations within clusters are weak. So they may be less capable of grouping data points in the same cluster. In contrast, the affinity matrices from LRR, LSR, CIL2, and MoG Regression are very dense. The representation coefficients within clusters are large, indicating the good ability to group correlated data together. However, we can see that the contrast between diagonal blocks and non-diagonal blocks of MoG Regression is much higher than those of LRR, LSR, and CIL2, and the differences between coefficients within the same clusters of MoG Regression are also much smaller. Table 1. The contrast (%) of affinity matrices in Figure 1
SSC 73.51
LRR 75.41
LSR 52.10
CASS 75.18
CIL2 76.35
Ours 80.32
� � old πk N e eold n | 0, Σk � �, =P K old old e π N | 0, Σ e j n j j=1
Σnew k
=
1 γn,k
N X
n=1
eold γn,k e n
πknew =
= z new n
where
PK
and
N 1 X γn,k , N n=1
⊤
new f ) k=1 ξk X n (Σk PK j=1 ξj
bn =
� �⊤ e eold + ǫI n
−1
fn X
!
,
−1
+ 2λI
bn ,
PK
new −1 f ) k=1 ξk X n (Σk xn , PK j=1 ξj
� � � � new new , ξ j = πj N e . eold eold ξ k = πk N e n | 0, Σk n | 0, Σj
3:
new new Σold , πkold ←− πknew , z old n ←− z n . k ←− Σk
Until : k Z old − Z new kF ≤ ε and k Σold − Σnew kF ≤ ε. Output: The representation matrix Z.
To quantitatively evaluate the contrast of the diagonal blocks against the non-diagonal blocks of each method, we define the contrast by (Sd − Snd )/kCk1 , where Sd and Snd are the sums of absolute values of entries in diagonal and non-diagonal blocks, respectively. Table 1 shows the contrast of the affinity matrices from different methods. We see that the contrast value of MoG Regression is much higher than those of other approaches. This demonstrates that, with complex noise aggravating the data, our method is better at describing the distribution of noise, thus showing stronger
grouping effect and greater ability to recover the true subspace structures. In the end, we employ Normalize Cut [19] on the affinity matrix C to produce the final clustering results.
3. The Grouping Effect In this section we will prove the effectiveness of our proposed model in subspace clustering by investigating its
(a) SSC [5]
(b) LRR [9] (c) LSR [12] (d) CASS [10] (e) CIL2 [11] (f) Ours Figure 1. The affinity matrices of 10 objects obtained by different methods on the AR database.
grouping effect. The grouping effect is an important criterion for measuring the validity of a clustering method, which tends group highly correlated data together [12]. We state the grouping effect of MoG Regression as follows. Theorem 3.1 Given a sample point x ∈ RM , the normalized data matrix X and the regularization parameter λ, let b be the optimal solution to z ! K X πk N (Xz − x | 0, Σk ) + λ k z k2 , min − ln z
where ξk = πk N (X zb − x | 0, Σk ).
From the above two equations for zbi and zbj we deduce that zbi − zbj =
⊤ x⊤ i − xj
� �P K
� −1 ξ Σ (X zb − x) k k k=1 . PK 2λ k=1 ξk
Note that
k=1
then there exists a constant a such that r a 1−ρ i j | zb − zb |≤ , λ 2 where ρ = coshxi , xj i. Here we denote zbi and zbj as the b, and xi and xj as the i-th i-th and j-th entries of vector z and j-th columns of X, respectively.
K
K
X
X
−1 ξk Σk ≤ ξk k Σ−1
k k2
k=1
f (z) = − ln
πk N (Xz − x | 0, Σk )
k=1
!
+ λ k z k2 .
k=1
�
≤ max k Σ−1 k k2
| zbi − zbj |≤
� � k xi − xj k2 · k X zb − x k2 · max k Σ−1 k k2 k
2λ
and x⊤ j
�P
K −1 k=1 ξk Σk
PK
�
which yields
k=1 ξk
K −1 k=1 ξk Σk
PK
�
k=1 ξk
K X
ln
(X zb − x)
k=1
+ 2λb z i = 0,
b − x | 0, Σk ) πk N (X z
!
≥ ln
K X
πk N (x | 0, Σk )
k=1
On the other hand, if we define V = argmax πk k
(X zb − x)
.
f (b z ) ≤ f (0) ,
This gives
�P
ξk .
k=1
b is a minimizer of f (z). So we have Note that z
b = argmin f (z), we have Since z z ∂f (z) = 0. ∂z z=bz x⊤ i
k
�X K
So we get
Proof 3.1 Let
K X
2
+ 2λb z j = 0,
and
S = argmax N (X zb − x | 0, Σk ) , k
!
.
then we get K X
ln (KπV N (X zb − x | 0, ΣS )) ≥ ln
!
πk N (x | 0, Σk ) ,
k=1
which is equivalent to ⊤
z − x) (Xb z − x) Σ−1 S (Xb 2
≤ ln
M
(2π) 2
KπV �K � . P 1 πk N (x | 0, Σk ) | ΣS | 2 k=1
Σ−1 S
Since is a symmetric positive definite matrix, whose unitary similar matrix is a diagonal matrix, we can list the diagonal entries in descending order. Then We have λ1 · · · 0 .. U, | ΣS |−1 = U ⊤ ... . . . . ···
0
λmin
Where U is the unitary matrix, λ1 ≥ · · · · · · ≥ λmin denote the eigenvalues of Σ−1 S . Thus we get ⊤
(Xb z − x) Σ−1 z − x) S (Xb λ1 · · · ⊤ ⊤ . = (Xb z − x) U .. . . . 0
···
0 .. U (Xb z − x) .
λmin
2
≥λmin k Xb z−xk .
It yields to k X zb − x k2 ≤ Q,
where
Q=
1 λmin
Then we get
ln
M 2
1
| ΣS | 2
a | zb − zb |≤ λ
a= is a constant.
πk N (x | 0, Σk )
k=1
i
where
K P
�
j
r
k
�
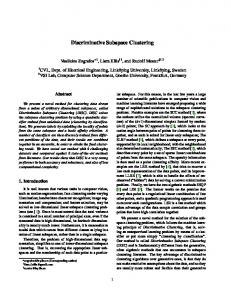
4.1. Hopkins 155 Database The Hopkins 155 motion segmentation database [20] contains 155 video sequences, where 120 of the videos contain 2 motions and 35 of the videos have 3 motions. On average, each sequence of the 2 motions has 266 feature trajectories and 30 frames, and each sequence of the 3 motions has 398 feature trajectories and 29 frames. For each sequence, a tracker is used to extract the point trajectories and a subspace clustering task is defined. Thus we have 155 subspace clustering tasks in total. We first use PCA to reduce the dimensionality of the data. Then we test the MoG Regression method on each video sequence. Some motion segmentation results of our approach are shown in Figure 2, where motions of different objects and background motions can be accurately segmented.
! .
(a) (b) (c) Figure 2. Exemplar results of motion segmentation on the Hopkins 155 Database. (a) Checkerboard. (b) Cars. (c) People.
1−ρ , 2
max k Σ−1 k k2
In this section, we show the performance of the proposed MoG Regression method on the Hopkins 155 database [20], the Rotated MNIST Dataset [7], the AR database [15], and the Extended Yale Face Dataset B [25]. Experimental results show that the proposed method is effective and robust to noise in motion segmentation, handwritten digits clustering, and complex face clustering. We also apply SSC [5], LRR [9], LSR [12], CASS [10], and CIL2 [11] to these datasets. We tune the parameters of each method to achieve the best performance for fair comparison, and the clustering accuracy [5] is employed in quantitative evaluation. The comparison shows that our approach outperforms five state-of-the-art methods.
2
KπV (2π)
4. Experiments
p
Q
From Theorem 3.1 we can see that, if xi and xj are highly correlated, then ρ is close to 1 and further the upper bound of the difference between zbi and zbj approaches 0. Therefore, xi and xj would be grouped into the same cluster. An illustration of grouping effect can be seen in Figure 1, where the differences between representation coefficients are small within the same cluster while larger between different clusters.
Table 2 presents the clustering accuracies of different methods. We can see that MoG Regression achieves significantly higher accuracies than the state-of-the-art methods.
4.2. MNIST-Back-Rand Dataset The MNIST-back-rand database consists of 50000 images of hand-written digits from 0 to 9. It is first selected from the MNIST dataset [8] and then transformed into more challenging images by inserting random noise into the original images. Figure 3 shows some example images from the dataset.
Table 2. The clustering accuracies (%) on the Hopkins 155 database.
55
50
SSC motions
3 motions
LSR
CASS CIL2
Ours 45
95.69 96.43 97.48 97.01 91.97 92.35 93.21 94.06
97.63 98.76
Accuracy
2
LRR
94.34 95.03
40
35
30
25
To reduce memory consumption in experiments, we randomly select 10 images for each digit to build a subset that contains 100 samples. Experimental results are reported in Table 3. We can see the advantage of our method is remarkable. This experiment shows that when the data are contaminated with non-Gaussian or complex noise, the proposed method is more capable of clustering the subspaces with the help of MoG.
20
1
2
3
4
5
6
7
8
9
10
K
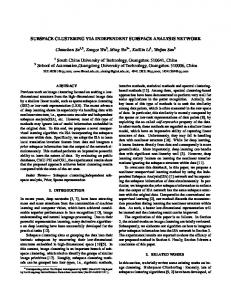
Figure 4. The clustering accuracies (%) of MoG Regression with different values of K on the MNIST-Back-Rand database.
on, and all side lights on), and occlusion by sunglasses or scarf. Table 4. The clustering accuracies (%) on the AR database.
SSC 5 subjects
Figure 3. Examples of the MNIST-back-rand database, where digits are corrupted with random noise.
Table 3. The clustering accuracies (%) on the MNIST-Back-Rand database
SSC 33.56
LRR 22.85
LSR 20.55
CASS 29.05
CIL2 36.50
Ours 51.98
We also conduct experiments to see how the number K of Gaussians affects the clustering accuracy of the proposed model. The accuracies are shown in Figure 4. We can see that when the number of Gaussians increases, the accuracy increases at first and then fluctuates, reaching the maximum value when K = 5. This is because when the number of Gaussians is too small, MoG may not characterize the noise accurately. On the other hand, when K is too large the computation cost will increase and the grouping effect will be suppressed (Difference bound demonstrated in Theorem 3.1 will increase). In either case the distribution of noise is not modeled well.
4.3. AR Dataset The AR database [15] contains over 4,000 facial images corresponding to 126 subjects (70 men and 56 women). For each subject, 26 facial images are taken in two separate sessions. These images suffer different facial variations, including various facial expressions (neutral, smile, anger, and scream), illumination variations (left light on, right light
10 subjects
LRR
LSR
CASS CIL2
Ours
83.05 84.41 87.69 78.46
85.38 93.85
75.06 78.54 63.07 77.69
80.39 88.85
We build two subspace clustering tasks by selecting first 5 and 10 subjects from this dataset, respectively. The clustering results on the AR database of different algorithms are shown in Table 4. We can see that MoG Regression performs much better than other state-of-the-art methods in both clustering tasks. This is because MoG Regression has a strong grouping effect on this challenging database, which can be seen in Figure 1.
4.4. Extended Yale Face Dataset B The Extended Yale Face Dataset B [25] consists of 2,414 frontal face images of 38 subjects, where there are 64 faces for each subject, acquired under various lighting, poses, and illumination conditions. To reduce the computational cost and the memory requirements, we resize the grayscale images to a resolution of 32 × 32 pixels. To evaluate the robustness of different methods, we conduct experiments on corrupted Extended Yale Face Dataset B, where each image is corrupted by replacing random image pixels with samples from a uniform distribution on the interval from 0 to 255 [11], and the percentage of corrupted pixels varies from 10% to 100%. Figure 5 shows the clustering accuracies of all methods on the corrupted Extended Yale B database. From Figure 5 we can see that the proposed approach performs much better when face images are randomly cor-
1 Ours CIL2 CASS LSR LRR SSC
0.9
Accuracy
0.8 0.7 0.6 0.5 0.4 0.3 0.2 10
20
30
40
50
60
70
80
90
100
Percent of pixels corrupted in each image
Figure 5. The clustering accuracies (%) with pixel corruption on the Extended Yale B database.
rupted at a level from 10% to 40%, showing better adaptability and greater robustness in noise handling. When the percentage of corrupted pixels is larger than 60%, the discriminative information are badly damaged, thus weakening the performance of all methods.
5. Conclusions In this paper, we propose a new subspace clustering method by employing the MoG model to describe the distribution of complex noise. Theoretical analysis shows that the proposed MoG Regression method maintains the grouping effect. Experiments on motion segmentation, handwritten digits clustering, and complex face clustering demonstrate the superiority of the proposed method, regarding stability and robustness in handling general noise, over the state-of-the-art subspace clustering methods, SSC, LRR, LSR, and CASS, which assume Gaussian or sparse noise. In the future, we will work on accelerating the solution of MoG Regression. Acknowledgements. B. Li, Y. Zhang and H. Lu are supported by the Natural Science Foundation of China #61472060 and the Fundamental Research Funds for the Central Universities under Grant DUT14YQ101. Z. Lin is supported by NSF China (grant nos. 61231002 and 61272341), 973 Program of China (grant no. 2015CB352502), and Microsoft Research Asia Collaborative Research Program.
References [1] P. K. Agarwal and N. H. Mustafa. K-means projective clustering. In Proceedings of the Twenty-third ACM SIGACTSIGMOD-SIGART Symposium on Principles of Database Systems, June 14-16, 2004, Paris, France, pages 155–165, 2004. [2] P. S. Bradley and O. L. Mangasarian. K-plane clustering. Journal of Global Optimization, 16(1):23–32, 2000.
[3] F. R. Chung. Spectral graph theory, volume 92. American Mathematical Soc., 1997. [4] J. P. Costeira and T. Kanade. A multibody factorization method for independently moving objects. International Journal of Computer Vision, 29(3):159–179, 1998. [5] E. Elhamifar and R. Vidal. Sparse subspace clustering: Algorithm, theory, and applications. IEEE Transactions on Pattern Analysis and Machine Intelligence, 35(11):2765–2781, 2013. [6] J. Ho, M. H. Yang, J. Lim, K. C. Lee, and D. Kriegman. Clustering appearances of objects under varying illumination conditions. In Proceedings of IEEE Conference on Computer Vision and Pattern Recognition, volume 1, pages I–11, 2003. [7] H. Larochelle, D. Erhan, A. Courville, J. Bergstra, and Y. Bengio. An empirical evaluation of deep architectures on problems with many factors of variation. In Proceedings of International Conference on Machine Learning, pages 473– 480, 2007. [8] Y. LeCun, L. Bottou, Y. Bengio, and P. Haffner. Gradientbased learning applied to document recognition. Proceedings of the IEEE, 86(11):2278–2324, 1998. [9] G. Liu, Z. Lin, S. Yan, J. Sun, Y. Yu, and Y. Ma. Robust recovery of subspace structures by low-rank representation. IEEE Transactions on Pattern Analysis and Machine Intelligence, 35(1):171–184, 2013. [10] C. Lu, J. Feng, Z. Lin, and S. Yan. Correlation adaptive subspace segmentation by trace lasso. In Proceedings of IEEE International Conference on Computer Vision, pages 1345– 1352, 2013. [11] C. Lu, J. Tang, M. Lin, L. Lin, S. Yan, and Z. Lin. Correntropy induced l2 graph for robust subspace clustering. In Proceedings of IEEE International Conference on Computer Vision, pages 1801–1808, 2013. [12] C. Y. Lu, H. Min, Z. Q. Zhao, L. Zhu, D. S. Huang, and S. Yan. Robust and efficient subspace segmentation via least squares regression. In Proceedings of European Conference on Computer Vision, pages 347–360. 2012. [13] Y. Ma, H. Derksen, W. Hong, and J. Wright. Segmentation of multivariate mixed data via lossy data coding and compression. IEEE Transactions on Pattern Analysis and Machine Intelligence, 29(9):1546–1562, 2007. [14] Y. Ma, A. Y. Yang, H. Derksen, and R. Fossum. Estimation of subspace arrangements with applications in modeling and segmenting mixed data. SIAM review, 50(3):413–458, 2008. [15] A. M. Martinez. The AR face database. CVC Technical Report, 24, 1998. [16] D. Nettleton. Convergence properties of the EM algorithm in constrained parameter spaces. Canadian Journal of Statistics, 27(3):639–648, 1999. [17] A. Y. Ng, M. I. Jordan, Y. Weiss, et al. On spectral clustering: Analysis and an algorithm. Advances in neural information processing systems, 2:849–856, 2002. [18] S. R. Rao, R. Tron, R. Vidal, and Y. Ma. Motion segmentation via robust subspace separation in the presence of outlying, incomplete, or corrupted trajectories. In Proceedings of IEEE Conference on Computer Vision and Pattern Recognition, pages 1–8, 2008.
[19] J. Shi and J. Malik. Normalized cuts and image segmentation. IEEE Transactions on Pattern Analysis and Machine Intelligence, 22(8):888–905, 2000. [20] R. Tron and R. Vidal. A benchmark for the comparison of 3-d motion segmentation algorithms. In Proceedings of IEEE Conference on Computer Vision and Pattern Recognition, pages 1–8, 2007. [21] R. Vidal and R. Hartley. Motion segmentation with missing data using powerfactorization and GPCA. In Proceedings of IEEE Conference on Computer Vision and Pattern Recognition, volume 2, pages II–310. IEEE, 2004. [22] R. Vidal, Y. Ma, and S. Sastry. Generalized principal component analysis (GPCA). IEEE Transactions on Pattern Analysis and Machine Intelligence, 27(12):1945–1959, 2005. [23] U. Von Luxburg. A tutorial on spectral clustering. Statistics and computing, 17(4):395–416, 2007. [24] K. H. Wei Hong, John Wright and Y. Ma. Multi-scale hybrid linear models for lossy image representation. In IEEE Transactions on Image Processing, volume 15, pages 3655–3671, 2006. [25] J. Wright, A. Y. Yang, A. Ganesh, S. S. Sastry, and Y. Ma. Robust face recognition via sparse representation. IEEE Transactions on Pattern Analysis and Machine Intelligence, 31(2):210–227, 2009. [26] C. J. Wu. On the convergence properties of the EM algorithm. The Annals of statistics, pages 95–103, 1983. [27] L. Xu and M. I. Jordan. On convergence properties of the EM algorithm for gaussian mixtures. Neural Computation, 8(1):129–151, 1996. [28] J. Yan and M. Pollefeys. A general framework for motion segmentation: Independent, articulated, rigid, non-rigid, degenerate and non-degenerate. In Proceedings of European Conference on Computer Vision, pages 94–106. 2006. [29] A. Y. Yang, S. R. Rao, and Y. Ma. Robust statistical estimation and segmentation of multiple subspaces. In Proceedings of IEEE Conference on Computer Vision and Pattern Recognition Workshop, pages 99–99, 2006. [30] A. Y. Yang, J. Wright, Y. Ma, and S. S. Sastry. Unsupervised segmentation of natural images via lossy data compression. Computer Vision and Image Understanding, 110(2):212– 225, 2008. [31] Q. Zhao, D. Meng, Z. Xu, W. Zuo, and L. Zhang. Robust principal component analysis with complex noise. In Proceedings of International Conference on Machine Learning, 2014.