Communication Theory Workshop, May 6-8, 2004 and EPFL, May ... Ask: Maximum rate to broadcast info from s to T ? sender s ... Maxflow(s,t) ⤠Mincut(s,t) ⡠h.
Network Coding for the Internet Philip A. Chou*, Yunnan Wu†, and Kamal Jain* *Microsoft Research & †Princeton University Communication Theory Workshop, May 6-8, 2004 and EPFL, May 10, 2004
Outline
Introduction to Network Coding Practical Network Coding
Packetization Buffering
Internet Applications
Live Broadcasting, File Downloading, Messaging, Interactive Communication
Network Coding Introduction sender s receiver t in T
Directed graph with edge capacities Sender s, set of receivers T Ask: Maximum rate to broadcast info from s to T ?
Maximum Flow sender s receiver t in T
Menger (1927) – single receiver
Maxflow(s,t) ≤ Mincut(s,t) ≡ ht achievable
Edmonds (1972) – all nodes are receivers
Maxflow(s,T) ≤ mint ht ≡ h achievable if T=V
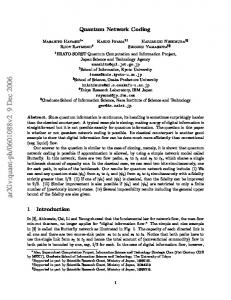
Network Coding Maximizes Throughput a a a,b b optimal multicast throughput = 1
Alswede, Cai, Li, Yeung (2000)
NC always achieves h = mint ht
Li, Yeung, Cai (2003) Koetter and Médard (2003)
a
a,b a+b
a+b a+b
b b
a,b
network coding throughput = 2 sender receiver coding node
Network Coding Minimizes Delay a
b b
b
a a
Jain and Chou (2004)
b b
optimal multicast delay = 3
a
a
a+b a+b
network coding delay = 2
Reconstruction delay at any node t is no greater than the maximum path length in any flow from s to t.
Network Coding Minimizes Energy (per bit) a
a
a
a
a
b
a
a
a
b
a optimal multicast energy per bit = 5
a a,b b
a
a
a b a+b a+b a a,b b,a b network coding energy per bit = 4.5
Wu et al. (2003); Wu, Chou, Kung (2004) Lun, Médard, Ho, Koetter (2004)
Network Coding Applicable to Real Networks?
Internet
IP Layer
Application Layer
Routers (e.g., ISP) Infrastructure (e.g., CDN) Ad hoc (e.g., P2P)
Wireless
Mobile ad hoc multihop wireless networks Sensor networks Stationary wireless (residential) mesh networks
Theory vs. Practice (1/4)
Theory:
Symbols flow synchronously throughout network; edges have integral capacities
Practice:
Information travels asynchronously in packets; packets subject to random delays and losses; edge capacities often unknown, varying as competing communication processes begin/end
Theory vs. Practice (2/4)
Theory:
Some centralized knowledge of topology to compute capacity or coding functions
Practice:
May be difficult to obtain centralized knowledge, or to arrange its reliable broadcast to nodes across the very communication network being established
Theory vs. Practice (3/4)
Theory:
Can design encoding to withstand failures, but decoders must know failure pattern
Practice:
Difficult to communicate failure pattern reliably to receivers
Theory vs. Practice (4/4)
Theory:
Cyclic graphs present difficulties, e.g., capacity only in limit of large blocklength
Practice:
Cycles abound. If A → B then B → A.
Our work addresses practical network coding in real networks
Packets subject to random loss and delay Edges have variable capacities due to congestion and other cross traffic Node & link failures, additions, & deletions are common (as in P2P, Ad hoc networks) Cycles are everywhere Broadcast capacity may be unknown No centralized knowledge of graph topology or encoder/decoder functions Simple technology, applicable in practice
Approach
Packet Format
Removes need for centralized knowledge of graph topology and encoding/decoding functions
Buffer Model
Allows asynchronous packets arrivals & departures with arbitrarily varying rates, delay, loss
Standard Framework
Graph (V,E) having unit capacity edges Sender s in V, set of receivers T={t,…} in V Broadcast capacity h = mint Maxflow(s,t)
y(e) = ∑e’ me(e’) y(e’) m(e) = [me(e’)]e’ is local encoding vector
Global Encoding Vectors
By induction y(e) = ∑hi=1 gi(e) xi g(e) = [g1(e),…,gh(e)] is global encoding vector Receiver t can recover x1,…,xh from x1 y (e1 ) g1 (e1 ) L g h (e1 ) x1 M = G M M = M O M t xh y (eh ) g1 (eh ) L g h (eh ) xh
Invertibility of Gt
Gt will be invertible with high probability if local encoding vectors are random and field size is sufficiently large
If field size = 216 and |E| = 28 then Gt will be invertible w.p. ≥ 1−2−8 = 0.996
[Ho et al., 2003] [Jaggi, Sanders, et al., 2003]
Packetization
Internet: MTU size typically ≈ 1400+ bytes y(e) = ∑e’ me(e’) y(e’) = ∑hi=1 gi(e) xi s.t. y (e1 ) y1 (e1 ) M = M y (eh ) y1 (eh )
x1,1 y N (e1 ) M M = Gt M xh ,1 y2 (eh ) L y N (eh ) y2 (e1 ) L
x1, 2 L x1, N M M xh , 2 L xh , N
Key Idea
Include within each packet on edge e g(e) = ∑e’ me(e’) g(e’); y(e) = ∑e’ me(e’) y(e’) Can be accomplished by prefixing i th unit vector to i th source vector xi, i=1,…,h 1 0 x1,1 x1,2 L x1,N g1(e1) L gh (e1) y1(e1) y2 (e1) L yN (e1) =G O M O M M M M M M M t 0 g1(eh ) L gh (eh ) y1(eh ) y2 (eh ) L yN (eh ) 1 xh,h xh,2 L xh,N
Then global encoding vectors needed to invert the code at any receiver can be found in the received packets themselves!
Cost vs. Benefit
Cost:
Overhead of transmitting h extra symbols per packet; if h = 50 and field size = 28, then overhead ≈ 50/1400 ≈ 3%
Benefit:
Receivers can decode even if
Network topology & encoding functions unknown Nodes & edges added & removed in ad hoc way Packet loss, node & link failures w/ unknown locations Local encoding vectors are time-varying & random
Erasure Protection
Removals, failures, losses, poor random encoding may reduce capacity below h 1 0 x1,1 x1,2 L x1,N g1(e1) L gh(e1) y1(e1) y2(e1) L yN (e1) =Gk×h O M O M M M M M M M t 0 g1(ek ) L gh(ek ) y1(ek ) y2(ek ) L yN (ek ) 1 xh,h xh,2 L xh,N
Basic form of erasure protection: send redundant packets, e.g., last h−k packets of x1,…, xh are known zero
Priority Encoding Transmission (Albanese et al., IEEE Trans IT ’96)
More sophisticated form: partition data into layers of importance, vary redundancy by layer Received rank k → recover k layers Exact capacity can be unknown
Asynchronous Communication
In real networks, “unit capacity” edges grouped
Packets on real edges carried sequentially Separate edges → separate prop & queuing delays Number of packets per unit time on edge varies
Loss, congestion, competing traffic, rounding
Need to synchronize
All packets related to same source vectors x1,…, xh are in same generation; h is generation size All packets in same generation tagged with same generation number; one byte (mod 256) sufficient
Buffering
arriving packets (jitter, loss, variable rate)
ed ge
random combination
edge
Transmission opportunity: generate packet edge
asynchronous reception e g ed
buffer
node
asynchronous transmission
Decoding
Block decoding:
Collect h or more packets, hope to invert Gt
Earliest decoding (recommended):
Perform Gaussian elimination after each packet
At every node, detect & discard non-informative packets
Gt tends to be lower triangular, so can typically decode x1,…,xk with fewer more than k packets Much lower decoding delay than block decoding
Approximately constant, independent of block length h
Flushing Policy, Delay Spread, and Throughput loss
Policy: flush when first packet of next generation arrives on any edge
Simple, robust, but leads to some throughput loss
throughput loss (%) ≈
delay spread (s) delay spread (s) × sending rate (pkt/s) = h× I generation duration (s)
Interleaving
Decomposes session into several concurrent interleaved sessions with lower sending rates Does not decrease overall sending rate Increases space between packets in each session; decreases relative delay spread
Simulations
Implemented event-driven simulator in C++ Six ISP graphs from Rocketfuel project (UW)
Sender: Seattle; Receivers: 20 arbitrary (5 shown)
SprintLink: 89 nodes, 972 bidirectional edges Edge capacities: scaled to 1 Gbps / “cost” Edge latencies: speed of light x distance Broadcast capacity: 450 Mbps; Max 833 Mbps Union of maxflows: 89 nodes, 207 edges
Send 20000 packets in each experiment, measure:
received rank, throughput, throughput loss, decoding delay vs. sendingRate(450), fieldSize(216), genSize(100), intLen(100)
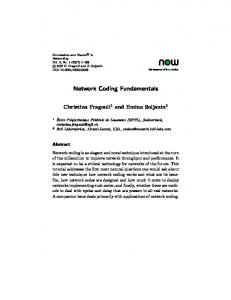
Received Rank 100
100 Chicago (450 Mbps) Pearl Harbor (525 Mbps) Anaheim (625 Mbps) Boston (733 Mbps) SanJose (833 Mbps)
90
Avg. received rank
Received rank
90
80
70
60
80
70
60
50
50
40
Chicago (450 Mbps) Pearl Harbor (525 Mbps) Anaheim (625 Mbps) Boston (733 Mbps) SanJose (833 Mbps)
0
20
40
60
80
100
120
140
Generation number
160
180
200
40
0
5
10
15
Field size (bits)
20
25
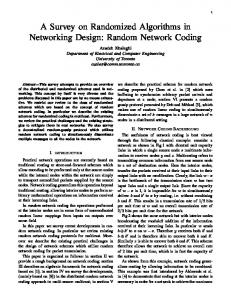
Throughput 850
850
Chicago (450 Mbps) Pearl Harbor (525 Mbps) Anaheim (625 Mbps) Boston (733 Mbps) SanJose (833 Mbps)
Throughput (Mbps)
750 700
750
650 600 550
700 650 600 550
500
500
450
450
400 400
450
500
550
600
650
Chicago (450 Mbps) Pearl Harbor (525 Mbps) Anaheim (625 Mbps) Boston (733 Mbps) SanJose (833 Mbps)
800
Throughput (Mbps)
800
700
Sending rate (Mbps)
750
800
850
400 400
450
500
550
600
650
700
Sending rate (Mbps)
750
800
850
Throughput Loss 100
300
Chicago (450 Mbps) Pearl Harbor (525 Mbps) Anaheim (625 Mbps) Boston (733 Mbps) San Jose (833 Mbps)
80 70
Chicago (450 Mbps) Pearl Harbor (525 Mbps) Anaheim (625 Mbps) Boston (733 Mbps) SanJose (833 Mbps)
250
Throughput Loss (Mbps)
Throughput Loss (Mbps)
90
60 50 40 30 20
200
150
100
50
10 0
20
30
40
50
60
70
Generation Size
80
90
100
0
0
10
20
30
40
50
60
70
Interleaving Length
80
90
100
Decoding Delay 200
200
Pkt delay w/ blk decoding Pkt delay w/ earliest decoding
180
160
Packet delay (ms)
Packet delay (ms)
160 140 120 100 80 60
140 120 100 80 60
40
40
20
20
0
Pkt delay w/ blk decoding Pkt delay w/ earliest decoding
180
20
30
40
50
60
70
Generation Size
80
90
100
0
0
10
20
30
40
50
60
70
Interleaving Length
80
90
100
Network Coding for Internet and Wireless Applications File download
wireless Internet
Xbox Live
Windows Messenger
Peer Net
Bit Torrent
Digital Fountain
ALM
Gnutella Kazaa
Ad Hoc (P2P)
Akamai RBN SplitStream CoopNet
Infrastructure (CDN)
st a e dc v Li roa b
o n g, i t d a cin a e g c r l on i t lo ee d ad lle ad n gin ctiv un ren g) a nd n i a e o o w p od nl ara nl s t s s a er a m n f e i n ed ma o n m D ro C ow P ow M e I e t om co am n d f M d d I C ( g
Live Broadcast (1/2)
State-of-the-art: Application Layer Multicast (ALM) trees with disjoint edges (e.g., CoopNet)
FEC/MDC striped across trees
Up/download bandwidths equalized
a failed node
Live Broadcast (2/2)
Network Coding [Jain, Lovász, Chou (2004)]:
Does not propagate losses/failures beyond child failed node affected nodes (maxflow: ht → ht – 1) unaffected nodes (maxflow unchanged)
ALM/CoopNet average throughput: (1–ε)depth * sending rate Network Coding average throughput: (1–ε) * sending rate
File Download
State-of-the-Art: Parallel download (e.g., BitTorrent)
Selects parents at random Reconciles working sets Flash crowds stressful
Network Coding:
Does not need to reconcile working sets Handles flash crowds similarly to live broadcast
Throughput
download time
Seamlessly transitions from broadcast to download mode
Instant Messaging
State-of-the-Art: Flooding (e.g., PeerNet)
Peer Name Resolution Protocol (distributed hash table) Maintains group as graph with 3-7 neighbors per node Messaging service: push down at source, pops up at receivers How? Flooding
Adaptive, reliable 3-7x over-use
Network Coding:
Improves network usage 3-7x (since all packets informative) Scales naturally from short message to long flows
Interactive Communication in mobile ad hoc wireless networks
State-of-the-Art: Route discovery and maintenance
Timeliness, reliability
Network Coding:
Is as distributed, robust, and adaptive as flooding
Each node becomes collector and beacon of information
Minimizes delay without having to find minimum delay route
Physical Piggybacking a a+b
s
b a+b
t
Information sent from t to s can be piggybacked on information sent from s to t Network coding helps even with point-to-point interactive communication
throughput energy per bit delay
Summary
Network Coding is Practical
Packetization Buffering
Network Coding can improve performance
in IP or wireless networks in infrastructure-based or P2P networks for live broadcast, file download, messaging, interactive communication by improving throughput, robustness, delay, manageability, energy consumption even if all nodes are receivers, even for point-to-point communication