percolation on graphs with completely general degree distribution, giving exact solutions for a variety of cases, including ... propagation of computer viruses [6].
Network robustness and fragility: Percolation on random graphs Duncan S. Callaway1, M. E. J. Newman2,3 , Steven H. Strogatz1,2 , and Duncan J. Watts4
arXiv:cond-mat/0007300v2 [cond-mat.stat-mech] 19 Oct 2000
1
Department of Theoretical and Applied Mechanics, Cornell University, Ithaca, NY 14853–1503 2 Center for Applied Mathematics, Cornell University, Ithaca, NY 14853–3801 3 Santa Fe Institute, 1399 Hyde Park Road, Santa Fe, NM 87501 4 Department of Sociology, Columbia University, 1180 Amsterdam Avenue, New York, NY 10027 Recent work on the internet, social networks, and the power grid has addressed the resilience of these networks to either random or targeted deletion of network nodes. Such deletions include, for example, the failure of internet routers or power transmission lines. Percolation models on random graphs provide a simple representation of this process, but have typically been limited to graphs with Poisson degree distribution at their vertices. Such graphs are quite unlike real world networks, which often possess power-law or other highly skewed degree distributions. In this paper we study percolation on graphs with completely general degree distribution, giving exact solutions for a variety of cases, including site percolation, bond percolation, and models in which occupation probabilities depend on vertex degree. We discuss the application of our theory to the understanding of network resilience.
investigated in depth for several decades now. However, random graphs suffer (at least) one serious shortcoming. As pointed out by a number of authors [3,8–11], vertex degrees have a Poisson distribution in a random graph, but real-life degree distributions are strongly nonPoisson, often taking power-law, truncated power-law, or exponential forms. This has prompted researchers to study the properties of generalized random graphs which have non-Poisson degree distributions [12–14]. In this paper we employ the generating function formalism of Newman et al. [14] to find exact analytic solutions for site percolation on random graphs with any probability distribution of vertex degree, where occupation probability is an arbitrary function of vertex degree. For the special case of constant occupation probability, we also give solutions for bond and joint site/bond percolation. Our results indicate how robust networks should be to random deletion of vertices or edges, or to the preferential deletion of vertices with particular degree. We start by examining site percolation for the general case in which occupation probability is an arbitrary function of vertex degree. Let pk be the probability that a randomly chosen vertex has degree k, and qk be the probability that a vertex is occupied given that it has degree k. Then pk qk is the probability of having degree k and being occupied, and
The internet, airline routes, and electric power grids are all examples of networks whose function relies crucially on the pattern of interconnection between the components of the system. An important property of such connection patterns is their robustness—or lack thereof— to removal of network nodes [1], which can be modeled as a percolation process on a graph representing the network [2]. Vertices on the graph are considered occupied or not, depending on whether the network nodes they represent (routers, airports, power stations) are functioning normally. Occupation probabilities for different vertices may be uniform, or may depend on, for example, the number of connections they have to other vertices, also called the vertex degree. Then we observe the properties of percolation clusters on the graph, particularly their connectivity, as the function determining occupation probability is varied. Previous results on models of this type [1–3] suggest that, if the connection patterns are chosen appropriately, the network can be made highly resilient to random deletion of nodes, although it may be susceptible to an “attack” which specifically targets nodes of high degree. We can also consider bond percolation on graphs as a model of robustness of networks to failure of the links between nodes (e.g., fiber optic lines, power transmission cables, and so forth), or combined site and bond percolation as a model of robustness against failure of either nodes or links. Percolation models built on networks have also been used to model the spread of disease through communities [4,5]. In such models a node in the network represents a potential host for the disease, and is occupied if that host is susceptible to the disease. Links between nodes represent contacts capable of transmitting the disease between individuals and may be occupied with some prescribed probability to represent the fraction of such contacts which actually result in transmission. A percolation transition in such a model represents the onset of an epidemic. Similar models can be used to represent the propagation of computer viruses [6]. The simplest and most widely studied model of undirected networks is the random graph [7], which has been
F0 (x) =
∞ X
pk qk xk
(1)
k=0
is the probability generating function for this distribution [15]. (Generating functions of this form were previously used by Watts [16] to study cascading failures in networks.) Note that F0 (1) = q, where q is the overall fraction of occupied sites. If we wish to study the special case of uniform occupation probability—ordinary site percolation—we simply set qk = q for all k. If we follow a randomly chosen edge, the vertex we reach has degree distribution proportional to kpk rather than just pk because a randomly chosen edge is more likely to lead to a vertex of higher degree. Hence the 1
equivalent of (1) for such a vertex is [14] P kpk qk xk−1 F ′ (x) , = 0 F1 (x) = k P z k kpk
routers in a data network, or through random vaccination of a population against a disease. Typically, no closed-form solution exists for Eq. (5), but it is possible to determine the terms of H1 (x) to any finite order n by iterating Eq. (5) n + 1 times starting from an initial value of H1 = 1. The probability distribution of cluster sizes can then be calculated exactly by substituting into Eq. (4) and expanding about x = 0. To test this method, we have performed simulations [19] of site percolation on random graphs with vertex degrees distributed according to the truncated power law � 0 for k = 0 pk = (10) Ck −τ e−k/κ for k ≥ 1.
(2)
where z is the average vertex degree. Now let H1 (x) be the generating function for the probability that one end of a randomly chosen edge on the graph leads to a percolation cluster of a given number of occupied vertices. The cluster may contain zero vertices if the vertex at the end of the edge in question is unoccupied, which happens with probability 1 − F1 (1), or the edge may lead to an occupied vertex with a number k of other edges leading out of it, distributed according to F1 (x). This means that H1 (x) satisfies a self-consistency condition of the form [14,17,18] H1 (x) = 1 − F1 (1) + xF1 (H1 (x)).
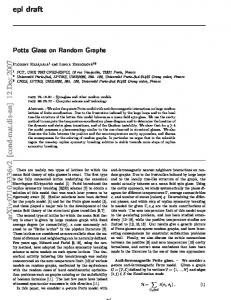
Our reasons for choosing this distribution are two-fold. First, it is seen in a number of real-world social networks including collaboration networks of movie actors [11] and scientists [20]. The pure power-law distributions seen in internet data [8–10] are also included in (10) as a special case κ → ∞. Second, the distribution has technical advantages over a pure power-law form because the exponential cutoff regularizes the calculations, so that the generating functions and their derivatives are finite. For pure power-law forms on the other hand, the calculations diverge, indicating that real-world networks cannot take a pure power-law form and must have some cutoff (presumably dependent on the system size). Figure 1 shows the cluster size distribution from our simulations along with the exact solution for the same values from the generating function formalism. The agreement between the two is good. The sizes of the clusters correspond, for instance, to the sizes of outbreaks of a disease among groups of susceptible individuals. The parameter values used in Fig. 1 are below the percolation threshold for this particular degree distribution, and hence all outbreaks are small and there is no epidemic behavior. The mean cluster size is � � qG′0 (1) hsi = H0′ (1) = q + qG′0 (1)H1′ (1) = q 1 + , 1 − qG′1 (1)
(3)
The probability distribution for the size of the cluster to which a randomly chosen vertex belongs is similarly generated by H0 (x), where H0 (x) = 1 − F0 (1) + xF0 (H1 (x)).
(4)
Together, Eqs. (1–4) determine the cluster size distribution for site percolation on a graph of arbitrary degree distribution. From these equations we can determine several quantities of interest such as mean cluster size, position of the percolation threshold, and giant component size, as demonstrated below. For the special case of uniform (degree-independent) site occupation probability, qk = q for all k, Eqs. (3) and (4) simplify to H1 (x) = 1 − q + qxG1 (H1 (x)), (5) H0 (x) = 1 − q + qxG0 (H1 (x)), (6) P where G0 (x) = k pk xk and G1 (x) = G′0 (x)/z are the generating functions for vertex degree alone introduced in Ref. [14]. For bond percolation with uniform occupation probability, we find that H0 (x) = xG0 (H1 (x)),
(11)
(7)
which diverges when 1 − qG′1 (1) = 0. This point marks the percolation threshold of the system, the point at which a giant component of connected vertices first forms. Thus the critical occupation probability is
with H1 (x) given by Eq. (5) again, and for joint site/bond percolation with uniform site and bond occupation probabilities qs and qb , we have H1 (x) = 1 − qs qb + qs qb xG1 (H1 (x)), H0 (x) = 1 − qs + qs xG0 (H1 (x)),
qc =
(8) (9)
1 . G′1 (1)
(12)
A result equivalent to this one has been derived previously by Cohen et al. [2] by different means. In the language of disease propagation qc is the point at which an epidemic of the disease first occurs. In the language of network robustness, it is the point at which the network achieves large scale connectivity, and can therefore function as an effective distribution network. Conversely, if we are approaching the transition from values
and indeed Eqs. (5–7) may be considered special cases of these last two equations when either qs or qb is 1. We now apply these results to the study of network robustness in a variety of cases. First, we consider the case of uniform site occupation probability embodied in Eqs. (5) and (6), which corresponds to random removal of nodes from a network, for example through failure of 2
of q above qc it is the point at which a sufficient number of individuals are immune to a disease to prevent it from spreading, or the point at which a large enough number of nodes have been deleted from a distribution network to prevent distribution on large-scales. The inset of Fig. 1 shows the behavior of the percolation threshold with the cutoff parameter κ for a variety of values of τ . Note that as the values of κ become large, the percolation threshold becomes small, indicating a high degree of robustness of the network to random deletion of nodes. For τ = 2.5 (roughly the exponent for the internet data [8]) and κ = 100, the percolation threshold is qc = 0.17, indicating that one can remove more than 80% of the nodes in the network without destroying the giant component—the network will still possess large-scale connectivity. This result agrees with recent studies of the internet [1,2] which indicate that network connectivity should be highly robust against the random removal of nodes. Another issue that has attracted considerable recent attention is the question of robustness of a network to non-random deletion targeted specifically at nodes with high degree. Albert et al. [1] and Broder et al. [3] both looked at the connectivity of a network with power-law distributed vertex degrees as the vertices with highest degree were progressively removed. In the language of our percolation models, this is equivalent to setting qk = θ(kmax − k),
10
probability Ps
10
−1
−2
0.2
0.0 0
40
80
cutoff κ
10
10
−3
−4
0
10
20
30
40
size of cluster s FIG. 1. Probability Ps that a randomly chosen vertex belongs to a cluster of s sites for κ = 10, τ = 2.5, and p = 0.65 from numerical simulation on systems of 107 sites (circles) and our exact solution (solid line). Inset: the percolation threshold qc from Eq. (12) (solid lines), versus computer simulations with τ = 1.5 (circles), 2.0 (squares), and 2.5 (triangles).
Opinions appear to differ over whether networks such as this are robust or fragile to this selective removal of vertices. Albert et al. [1] point out that only a small fraction of the highest-degree vertices need be removed to destroy the giant component in the network and hence remove all long-range connectivity. Conversely, Broder et al. [3] point out that one can remove all vertices with degree greater than kmax and still have a giant component even for surprisingly small values of kmax . As we show in Fig. 2, both viewpoints are correct: they are merely different representations of the same data. In the upper frame of the figure, we plot giant component size as a function of the fraction of vertices removed from the network, and it is clear that the giant component disappears when only a small percentage are removed—just 1% for the case τ = 2.7—so that the network appears fragile. In the lower frame we show the same data as a function of kmax , the highest remaining degree vertex, and we see that when viewed in this way the network is, in a sense, robust, since kmax must be very small to destroy the giant component completely—just 10 in the case of τ = 2.7. To conclude, we have used generating function methods to solve exactly for the behavior of a variety of percolation models on random graphs with any distribution of vertex degrees, including uniform site, bond and site/bond percolation, and percolation in which occupation probability is a function of vertex degree. Percolation systems on graphs such as these have been suggested as models for the robustness of communication or distribution networks to breakdown or sabotage, and for the
(13)
(14)
where u is a solution of the self-consistency condition u = 1 − F1 (1) + F1 (u).
10
threshold qc
0.4
where θ is the Heaviside step-function [21]. This removes (unoccupies) all vertices with degree greater than kmax . To investigate the effect of this removal, we calculate the size of the giant component in the network, if there is one. Above the percolation transition the generating function H0 (x) gives the distribution of the sizes of clusters of vertices which are not in the giant component [17], which means that H0 (1) is equal to the fraction of the graph which is not occupied by the giant component. The fraction S which is occupied by the giant component is therefore given by S = 1 − H0 (1) = F0 (1) − F0 (u),
0
(15)
In cases where this last equation is not exactly solvable we can evaluate u by numerical iteration starting from a suitable initial value. In Fig. 2 we show the results for S from this calculation for graphs with pure power-law degree distributions as a function of kmax for a variety of values of τ . (The removal of vertices with high degree regularizes the calculation in a similar way to the inclusion of the cutoff κ in our earlier calculation, so no other cutoff is needed in this case.) On the same plot we also show simulation results for this problem, and once more agreement of theory and simulation is good. 3
[4] F. Ball, D. Mollison and G. Scalia-Tomba, Annals of Applied Probability 7, 46–89 (1997) [5] M. E. J. Newman and D. J. Watts, Phys. Rev. E 60, 7332–7342 (1999). [6] J. O. Kephart and S. R. White, in Proceedings of the 1991 IEEE Computer Society Symposium on Research in Security and Privacy (1991). [7] B. Bollob´ as, Random Graphs, Academic Press, New York (1985). [8] M. Faloutsos, P. Faloutsos, and C. Faloutsos, Comp. Comm. Rev. 29, 251–262 (1999). [9] B. A. Huberman and L. A. Adamic, Nature 401, 131 (1999). [10] R. Albert, H. Jeong, and A.-L. Barab´ asi, Nature 401, 130–131 (1999). [11] L. A. N. Amaral, A. Scala, M. Barth´el´emy, and H. E. Stanley, Proc. Natl. Acad. Sci., in press. Also cond-mat/0001458. [12] M. Molloy and B. Reed, Random Structures and Algorithms 6, 161–179 (1995); Combinatorics, Probability and Computing 7, 295–305 (1998). [13] W. Aiello, F. Chung, and L. Lu, in Proceedings of the 32nd Annual ACM Symposium on Theory of Computing (2000). [14] M. E. J. Newman, S. H. Strogatz, and D. J. Watts, cond-mat/0007235. [15] H. S. Wilf, generatingfunctionology, 2nd Edition, Academic Press, London (1994). [16] D. J. Watts, submitted. [17] C. Moore and M. E. J. Newman, Phys. Rev. E, in press. Also cond-mat/0001393. [18] The derivation of this equation assumes that all clusters other than the giant component contain no loops. It is straightforward to demonstrate that this assumption is exact in the limit of large system size for degree distributions with finite mean. See Refs. [7], [12], and [13] for discussions of this point. [19] Simulations were performed using the algorithm of Newman and Ziff (Phys. Rev. Lett., in press, also cond-mat/0005264) except for the cluster size distribution, which was calculated using ordinary depth-first search. The value of qc was assumed equal to the value of q at which the derivative of the size of the largest cluster was greatest. [20] M. E. J. Newman, cond-mat/0007214. [21] In fact, the approaches of Albert et al. [1] and Broder et al. [3] differ slightly. Broder et al. simply removed the highest degree vertices from the network, whereas Albert et al. recalculated vertex degrees after the removal of each vertex and its associated edges, and then removed the next highest degree vertex. Our calculations are equivalent to the method of Broder et al., although in practice there appears to be little difference in qualitative behavior between the two.
0.6
size of giant component S
0.4 0.2 0.0 0.0
0.5
1.0
1.5
2.0
2.5
80
100
percentage of sites removed 0.6 0.4 0.2 0.0 0
20
40
60
cutoff kmax FIG. 2. Size of the giant component S in graphs with power-law degree distribution and all vertices with degree greater than kmax unoccupied, for τ = 2.4 (circles), 2.7 (squares), and 3.0 (triangles). Points are simulation results for systems with 107 vertices, solid lines are the exact solution. Upper frame: as a function of fraction of vertices unoccupied. Lower frame: as a function of the cutoff parameter kmax .
spread of disease through communities possessing some resistance to infection. Our exact solutions allow us to make predictions about the behavior of such model systems under quite general types of breakdown or interference. Among other results, we find that a distribution network such as the internet, which has an approximately power-law vertex degree distribution, should be highly robust against random removal of nodes (for example, random failure of routers), but is relatively fragile, at least in terms of fraction of nodes removed, to the specific removal of the most highly connected nodes. The authors would like to thank Jon Kleinberg for illuminating conversations. This work was funded in part by the National Science Foundation, the Electric Power Research Institute, and the Army Research Office.
[1] R. Albert, H. Jeong, and A.-L. Barab´ asi, Nature 406, 378 (2000). [2] R. Cohen, K. Erez, D. ben-Avraham, and S. Havlin, cond-mat/0007048. [3] A. Broder, R. Kumar, F. Maghoul, P. Raghavan, S. Rajagopalan, R. Stata, A. Tomkins, and J. Wiener, in Proceedings of the Ninth International World-Wide Web Conference (2000). Also http://www.almaden.ibm.com/cs/k53/www9.final.
4