NeuroImage 70 (2013) 268–277
Contents lists available at SciVerse ScienceDirect
NeuroImage journal homepage: www.elsevier.com/locate/ynimg
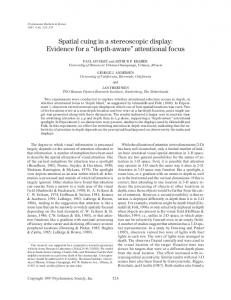
Neural correlates of attentional deployment within unpleasant pictures Jamie Ferri ⁎, Joseph Schmidt, Greg Hajcak, Turhan Canli Department of Psychology, Stony Brook University, Stony Brook, NY, USA
a r t i c l e
i n f o
Article history: Accepted 17 December 2012 Available online 25 December 2012 Keywords: Attention Emotion Attentional deployment fMRI IAPS
a b s t r a c t Attentional deployment is an emotion regulation strategy that involves shifting attentional focus towards or away from particular aspects of emotional stimuli. Previous studies have highlighted the prevalence of attentional deployment and demonstrated that it can have a significant impact on brain activity and behavior. However, little is known about the neural correlates of this strategy. The goal of the present studies was to examine the effect of attentional deployment on neural activity by directing attention to more or less arousing portions of unpleasant images. In Studies 1 and 2, participants passively viewed counterbalanced blocks of unpleasant images without a focus, unpleasant images with an arousing focus, unpleasant images with a non-arousing focus, neutral images without a focus, and neutral images with a non-arousing focus for 4000 ms each. In Study 2, eye-tracking data were collected on all participants during image acquisition. In both studies, affect ratings following each block indicated that participants felt significantly less negative affect after viewing unpleasant images with a non-arousing focus compared to unpleasant images with an arousing focus. In both studies, the unpleasant non-arousing focus condition compared to the unpleasant arousing focus condition was associated with increased activity in frontal and parietal regions implicated in inhibitory control and visual attention. In Study 2, the unpleasant non-arousing focus condition compared to the unpleasant arousing focus condition was associated with reduced activity in the amygdala and visual cortex. Collectively these data suggest that attending to a non-arousing portion of an unpleasant image successfully reduces subjective negative affect and recruits fronto-parietal networks implicated in inhibitory control. Moreover, when ensuring task compliance by monitoring eye movements, attentional deployment modulates amygdala activity. © 2012 Elsevier Inc. All rights reserved.
Introduction Compared to neutral stimuli, emotional stimuli are detected faster (Öhman et al., 2001; Vuilleumier and Schwartz, 2001) and hold attention more efficiently (Lang et al., 1997). However, it is not always adaptive to attend to emotional information; involuntary attention to task-irrelevant emotional stimuli can slow reaction times and decrease accuracy (MacNamara and Hajcak, 2009; Vuilleumier et al., 2001). Indeed, being too attentive to negative information represents a cognitive vulnerability for psychopathologies such as anxiety and depression (Bar-Haim et al., 2007; Joormann, 2009). People are capable of exerting control over reflexive responses to emotional stimuli by using a number of emotion regulation techniques. Attentional deployment, for example, is a strategy that involves shifting attention towards or away from affective stimuli in the interest of an emotional goal (Gross, 1998; Gross and Thompson, 2007). Attentional deployment is one of the earliest emotion regulation strategies to emerge in development: very young children use distraction to delay
⁎ Corresponding author at: Department of Psychology, Stony Brook University, Stony Brook, NY 11794-2500, USA. Fax: +1 631 632 7876. E-mail address:
[email protected] (J. Ferri). 1053-8119/$ – see front matter © 2012 Elsevier Inc. All rights reserved. http://dx.doi.org/10.1016/j.neuroimage.2012.12.030
gratification (Mischel and Ayduk, 2011), and even grade school children are aware that changes in attention can change the way they feel (Harris and Lipian, 1989). The use of attentional deployment continues beyond childhood; adults shift attention away from negative parts of images to reduce negative affect even without instruction to do so (van Reekum et al., 2007; Xing, 2006). Older adults in particular seem to divert gaze away from negative information and towards positive information in the interest of regulating mood (Isaacowitz et al., 2006, 2009; Mather and Carstensen, 2005). Individuals who are able to successfully deploy attention away from negative, or towards positive, information appear to experience both improved mood and decreased frustration with difficult tasks (Johnson, 2009; Urry, 2010). These data suggest that attentional deployment is an effective strategy to regulate emotional response that emerges early and persists throughout the lifespan. Previous studies have also shown that attentional deployment can have a dramatic impact on brain activity. A number of studies have examined the late positive potential (LPP), a centro-parietal eventrelated potential that is larger for emotional compared to neutral stimuli (Cuthbert et al., 2000; Schupp et al., 2000). To examine the impact of attentional deployment on the LPP, Dunning and Hajcak (2009) asked participants to passively view unpleasant and neutral images for 3 seconds, after which a circle was presented to direct
J. Ferri et al. / NeuroImage 70 (2013) 268–277
participants to either an arousing or a non-arousing portion of an unpleasant image, or to a non-arousing portion of a neutral image. The LPP was larger in response to emotional images both during the passive viewing period and when attention was directed towards the arousing portion of the image, but not when attention was directed to a non-arousing portion of the same unpleasant image. In another study, Hajcak et al. (2009) found that using a tone, rather than a visual cue, to direct participants to an arousing or non-arousing portion of an unpleasant image produced an analogous effect—the LPP was reliably reduced when participants were instructed to attend to a non-arousing portion of unpleasant images. These findings are in concert with those reporting reduced LPP magnitude during cognitive reappraisal—a strategy that involves changing the meaning of emotional situations or stimuli in order to change emotional significance (Foti and Hajcak, 2008; Hajcak and Nieuwenhuis, 2006; MacNamara et al., 2009). This suggests that attentional deployment, even in the absence of a goal to intentionally modify emotional experience, can function to reduce neural indices of attention to emotion. Nevertheless, relatively little is known about the specific brain structures and networks involved in attentional deployment. It is estimated that the LPP reflects activity in fronto-parietal attention networks (Moratti et al., 2004) and some have suggested it may also reflect indirect activity from the amygdala (Lang and Bradley, 2010), however the exact neural sources of the LPP are unknown. While it is clear that the LPP is reduced following attentional deployment, it is not clear what changes in brain activity support this reduction. Although fMRI would be an ideal avenue to explore the neural correlates of attentional deployment, thus far, the majority of fMRI studies of emotion regulation have focused on cognitive reappraisal. The neural systems associated with this strategy have been extensively studied and have culminated in a model suggesting that successful emotion regulation relies on interactions between prefrontal regions associated with cognitive control, and limbic regions such as the amygdala which have been associated with response to emotion (Ochsner and Gross, 2008). In addition to prefrontal and limbic regions, many emotion regulation studies also report increased activations in regions related to visual attention and inhibitory control, such as the superior parietal lobule and the precuneus (Hopfinger et al., 2000; Pessoa et al., 2003). As frontoparietal regions are critical for visuospatial attention and visual control, van Reekum et al. (2007) reasoned that activation in these regions might reflect shifts in gaze to achieve emotion regulatory goals even though participants were instructed to use cognitive strategies such as reappraisal. Changes in subject emotional experience due to cognitive reappraisal should occur as a result of changes in appraisal, rather than changes in attention. Using eye-tracking, van Reekum and colleagues found that when participants were instructed to use cognitive reappraisal to increase or decrease their emotional response to unpleasant pictures, they spent more or less time, respectively, looking at the most arousing portions of these images. Further, when participants were instructed to decrease negative emotion using cognitive reappraisal, the amount of time spent looking at arousing portions of the images predicted a significant amount of variation in neural activity, including up to 35% in the amygdala, and as much as 75% in other regions often reported in emotion regulation studies such as the middle frontal gyrus, the precentral gyrus, and the cuneus (van Reekum et al., 2007). Thus, attentional deployment may account for some, but not all, of the variance in neural activity associated with cognitive reappraisal. Indeed, subsequent studies have shown that cognitive reappraisal results in reduced autonomic arousal and subjective affect even when gaze is held constant (Urry, 2010). However, these findings highlight the importance of attentional deployment as an emotion regulation strategy and inspire questions regarding the underlying neural mechanisms. The goal of the present study was to examine the effect of attentional deployment on neural activation and subjective affect while participants viewed unpleasant and neutral images in the absence of a
269
regulatory goal. In Study 1, we collected eye-tracking data from a subset of participants (5 of 41) during scanning to assess task compliance. In Study 2, we collected eye-tracking data from all participants of a second independent cohort (n= 47). We avoided any explicit instruction to modify emotional state in an effort to understand the impact of visual attention alone on neural activation and affect. While previous studies have independently demonstrated that attentional deployment can have a significant impact on brain activity and behavior, the neural correlates of attentional deployment are not well understood, and it remains unknown whether successful attentional deployment relies on the same well-defined circuits as cognitive reappraisal. As previous studies have reported that attentional deployment during cognitive reappraisal accounts for at least some of the variance in activity in limbic as well as fronto-parietal regions (van Reekum et al., 2007), we hypothesized that these regions would also be involved in attentional deployment in the absence of other explicit regulatory goals (i.e. cognitive reappraisal). Specifically, we hypothesized that directing gaze to a non-arousing, compared to an arousing, portion of a unpleasant image would result in reduced activation in areas of the brain implicated in emotional processing, including the amygdala, and corresponding increases in fronto-parietal regions associated with top-down attentional control. We also collected subjective ratings of negative affect during the course of the experiment in both studies. We predicted that participants would report reduced negative affect during unpleasant non-arousing compared to unpleasant arousing focus trials, and that unpleasant arousing focus trials would not differ from unpleasant trials without a focus. Study 1 Materials and methods Participants Forty-one healthy adults (22 females) with a mean age of 22.29 and no history of neurological or psychological illness were recruited to participate in the study. Participants self-identified as 53.7% Caucasian, 31.7% Asian, 9.8% African American, and 4.8% “Other.” The study was approved by The Committees on Research Involving Human Subjects at Stony Brook University. All participants provided informed consent and received payment for their participation. Participants were native English speakers who had normal or corrected-to-normal vision and no history of neurological or psychiatric diagnoses. Stimuli Sixty unpleasant and forty neutral images from the International Affective Picture System (Lang et al., 2008) were selected for this study. Normative ratings (Lang et al., 2005) indicated that unpleasant images were less pleasant (M = 2.28, SD = 1.47) than neutral images (M = 5.14, SD = 1.28), and that unpleasant images were more arousing (M = 6.05, SD = 2.25) than neutral images (M = 2.91, SD = 1.92); higher numbers indicate higher self-reported pleasantness and arousal. Stimuli were presented in a counterbalanced block design. Twenty unpleasant and twenty neutral pictures were presented without modification. For the remaining images, attention was directed to a smaller portion of the image by placing a blue circle over that portion. These images were taken from a set of stimuli created by Dunning and Hajcak (2009), along with 20 additional neutral images. For the neutral pictures, the blue circle was always placed over a non-arousing, but visually complex portion of the picture. For the unpleasant pictures, the blue circle was either placed over an arousing or non-arousing portion of the image. The procedure for selecting areas of focus is outlined by Dunning and Hajcak (2009). Therefore we had 5 conditions: neutral images with no focus, neutral images with a non-arousing focus, unpleasant images with no focus, unpleasant images with an arousing focus, and unpleasant images with a non-arousing focus.
270
J. Ferri et al. / NeuroImage 70 (2013) 268–277
Each participant viewed the same set of IAPS images; however, to ensure that differences between conditions were not due to the specific images selected for a given condition, pictures were counterbalanced across subjects such that each unpleasant picture appeared in the no focus, non-arousing focus, and arousing focus condition an equal number of times across subjects. For example, the set of images used for the unpleasant arousing focus condition for the first subject would be used for the unpleasant non-arousing focus condition for the second subject by moving the location of the circle. Similarly, the neutral pictures were counterbalanced so that they appeared in the no focus or focus conditions an equal number of times across subjects. The order of blocks was counterbalanced for each subject so that one condition did not follow another more than once during an experimental session. Images within each block were presented in a random order and were never repeated. No picture was presented in more than one condition for a given subject. Stimuli were presented in 2 runs of 10 blocks each. The task for the first 36 subjects was presented using E-Prime 2 (Psychology Software Tools, Inc., version 2). For the remaining five subjects, we re-programmed the experiment using Experiment Builder software package (SR Research Ltd, version 1.10.165) in order to collect eye-tracking data during image acquisition. The experimental design for the eye-tracking version of the experiment was identical to that of the original experiment. Stimuli for both versions of the task were presented using an MRI-compatible 60 Hz projector with a 1024 × 768 resolution which back-projected stimuli onto a mirror attached to the head coil.
Procedure Participants were instructed to passively view sets of images and then rate their negative affect following each set of images. Participants were told that for some sets of images they would be instructed to freely view the images, while for other sets they would be asked to focus their eyes and attention only on the part of the picture within the blue circle. Each trial began with a 5-second instruction to either “look freely at the following images” for no focus blocks, or to “look only at the part of the image within the blue circle” for focus blocks. Participants then viewed five pictures presented for 4 seconds each. Participants were then given 5 seconds to rate the intensity of their negative affect on a scale from one to four, with one being “not intense at all” and four being “very intense” using a four button custom built MRI-compatible response box. Fixation crosses were then presented in the center of the screen on a 10% to 50% saturated grey background, which alternated every 4 seconds for 20 seconds total. A schematic of the design can be seen in Fig. 1.
Eye-Tracking data acquisition and analysis Eye position was sampled at 1000 Hz, using a long-range mounted EyeLink 1000 eye-tracker with default saccade detection settings. Each run of trials began with a thirteen-point calibration routine used to map eye position to screen coordinates. Calibrations were not considered acceptable until the average error was less than 0.49° and the maximum error was less than 0.99°. Data analysis was conducted off-line using the DataViewer software package (SR Research Ltd, version 1.11.1). The regions within the focus circles were defined as interest areas (IAs) and cumulative fixation duration (dwell time) within these regions was computed. Group means for the eye data were obtained by first averaging fixation data across images within each block, then across blocks and finally across participants.
fMRI data acquisition and analysis A 3 Tesla Siemens TrioTim whole body scanner (Siemens Medical, Erlangen, Germany) with a 12 channel head coil was used to acquire 400 T2 star-weighted whole-brain volumes with an EPI sequence for analysis of BOLD signal. The following parameters were used: TR = 2500 ms, TE = 30 ms, flip angle = 90°, matrix dimensions = 64 × 64, FOV = 256, 256 mm, slices=34, aligned to the AC-PC, slice thickness= 4 mm, slice acquisition=interleaved, gap=0. Standard preprocessing procedures were performed in SPM8 starting with slice time correction, followed by realignment for motion correction, normalization to standard Montreal Neurological Institute space, and spatial smoothing using a Gaussian kernel with 8 mm FWHM. First level single subject SPMs were created for each subject from a model that specified the onset of each condition, the rating period and the instruction period. At the second level, random effects analyses were conducted to test for statistical differences between conditions of interest using contrasts created for each individual at the first level. A height threshold set to FDR .05 was used to correct for multiple comparisons. We report only those peak activations that are significant at less than p = .025, FDR corrected, with an extent size larger than 10 voxels. In order to assess differences in brain activity as a result of eye movements being explicitly monitored we compared the five eye-tracking subjects to five random non-eye-tracking subjects for each of our main contrasts. There were no significant differences in brain activity on any of the contrasts (unpleasant no focus compared to neutral no focus, focus compared to no focus, or unpleasant non-arousing focus compared to unpleasant arousing focus) at our significance threshold, or at thresholds as low as p = .01, uncorrected.
Fig. 1. Depiction of a neutral non-arousing focus block followed by a neutral no focus block. Each block began with a 5000 ms instruction screen indicating if the subject was to focus on the contents of the blue circle or to freely view the following set of images. This was followed by the presentation of 5 images for 4000 ms each. Participants were then given 5000 ms to rate the intensity of their negative affect on a scale of 1 to 4. Finally, participants saw fixations presented on grey backgrounds for 20,000 ms (Font size is not to scale).
J. Ferri et al. / NeuroImage 70 (2013) 268–277
271
Table 1 Means (and standard deviations) for average dwell time and percent dwell time (dwell time in IA/total dwell time − time to first fixation in IA) in the interest area (IA) per image (4000 ms presentation) in Study 1 (n = 5).
Dwell time (ms) Dwell time (%)
Unpleasant No focus (no visible IA)
Unpleasant arousing focus
Unpleasant Non-arousing focus
Neutral No focus (no visible IA)
Neutral Non-arousing focus
Arousing: 1136.74 (496.18); non-arousing: 126.38 (24.00) Arousing: 41%; non-arousing: 4%
2800.43 (382.80) 82%
2774.68 (281.67) 87%
434.48 (170.46) 17%
3085.68 (343.55) 90%
Results Manipulation checks Did participants stay within the focus regions as instructed? Means and standard deviations for dwell time and percent dwell time are presented in Table 1. During focus trials, participants complied with task instructions to focus on the contents of the blue circle, spending between 82% and 90% of total dwell time within the blue circle. During free viewing of unpleasant images, even though there were no circles directing attention to any portion of the image, participants spent significantly more time looking in the areas where the arousing focus region would be compared to where the non-arousing focus region would be, t (4) = 4.63, p = .01. Areas associated with viewing unpleasant images. The whole brain analysis for the simple effect of emotion (unpleasant no focus greater than neutral no focus) on the BOLD response revealed clusters of activation in occipital, frontal, limbic, and parietal regions. In frontal regions, the unpleasant no focus condition resulted in significantly greater activations in bilateral superior frontal gyrus (BA8/9) and bilateral middle frontal gyrus (BA 6/46). There was significantly greater activity in the left amygdala. Within parietal regions, greater activations were seen in bilateral precuneus (BA 7), bilateral postcentral gyrus, and the inferior parietal lobe (BA 40). Table 1 in the supplemental materials identifies significant regions associated with this contrast. Areas associated with focusing. The effect of overall focus (unpleasant arousing focus+unpleasant non-arousing focus+neutral non-arousing focus greater than unpleasant no focus+neutral no focus) revealed a large cluster of activation that covered the majority of frontal and parietal regions, with peak activations in the precuneus (BA 7), the superior parietal lobe (BA 7), and the inferior parietal lobe (BA 40). This cluster extended into frontal regions including the middle frontal gyrus (BA 6/ 9/10) and the anterior cingulate (BA 32). These activations are listed in Table 2 of the supplemental materials. Hypothesis testing Did focusing on a non-arousing portion of an unpleasant image reduce negative affect? Means and standard deviations for affect ratings are presented in Table 2. Participants reported feeling less negative affect following the unpleasant non-arousing focus condition compared to both the unpleasant arousing focus, t (40) = 8.96, p b .001, and the unpleasant no focus conditions, t (40)=9.44, pb .001. Participants also reported feeling more negative affect following the unpleasant nonarousing focus condition compared to both the neutral non-arousing
Table 2 Means (and standard deviations) for ratings of negative affect intensity (1 being “not intense at all” and 4 being “very intense”) following each condition in Study 1 (n = 41). Neutral Unpleasant Unpleasant Unpleasant Non-arousing No focus No focus Arousing focus focus Affect Rating 3.18 (.84)
3.22 (.77)
2.11 (.75)
Neutral Non-arousing focus
1.05 (.28) 1.07 (.30)
focus t (40)=8.9, p b .001 and the neutral no focus conditions t (40)= 9.06, pb .001. There were no significant differences between the unpleasant no focus and unpleasant arousing focus conditions, t (40)=−.47, p=.64, or the neutral no focus and neutral non-arousing focus conditions, t (40)=−.91, p =.37. Was focusing on an arousing portion of an unpleasant image (compared to a non-arousing portion) associated with increased amygdala activation? There was no difference in amygdala activation between the unpleasant arousing focus condition and the unpleasant non-arousing focus condition. No regions of the brain were more active for the unpleasant arousing focus compared to the unpleasant non-arousing focus condition at p> .05, FDR corrected. Was focusing on a non-arousing portion of an unpleasant image (compared to an arousing portion) associated with increased frontal and parietal activity? Focusing on an unpleasant non-arousing region, compared to an arousing region produced significantly greater activations in parietal regions including the supramarginal gyrus (BA 40), the cuneus, the precuneus (BA 7), as well as greater activation in frontal regions including the inferior frontal gyrus (BA 47), the middle frontal gyrus (BA 10), the superior frontal gyrus (BA 9), the precentral gyrus (BA 6) and the cingulate gyrus (BA 32). These activations are presented in Table 3 and Fig. 2. Overall findings from Study 1 indicated that attention to a nonarousing, compared to an arousing, portion of an unpleasant image Table 3 Peak activations for the unpleasant non-arousing focus compared to unpleasant arousing focus conditions in Study 1 (n=41). Region
BA
Cluster Size
Talairach coordinates
T
Z
R supramarG L SOG L precuneus R MidFG R MidFG/R cingG R MidFG L insula L insula R MTG R MTG, TPJ L MidFG L SFG L MidFG L Cblm L Cblm L Cblm R parahippG R parahippG L MTG L MTG R thalamus R thalamus R lentiform nucleus, putamen R supramarG
40 19 19 9 32 6 13 13 21 21 9 10 11
1900
57 −41 37 −34 −72 28 −18 −76 42 34 33 30 14 14 42 18 7 57 −30 23 1 −42 12 5 65 −24 −11 65 −43 −3 −30 29 34 −34 47 14 −38 50 −11 −42 −56 −29 −34 −56 −26 −26 −58 −2 30 −47 −6 30 −39 −10 −65 −31 −7 −65 −43 −3 14 −19 18 10 −12 2 26 −8 2 57 −41 37
6.43 5.78 5.73 6.19 5.33 5.29 4.42 4.07 4.34 2.72 4.22 3.88 3.71 4.10 3.77 3.52 3.80 3.63 3.31 2.96 3.22 3.09 2.75 6.43
5.30 4.90 4.87 5.16 4.60 4.58 3.97 3.70 3.91 2.59 3.81 3.55 3.42 3.73 3.47 3.27 3.49 3.35 3.09 2.80 3.01 2.91 2.61 5.30
1712
141 41 255
293
19 36 21 21
62 11 55
40
1900
Peak activations from random effects analysis are listed with a threshold of pb .025, FDR corrected, and cluster filter of 10 contiguous voxels. BA = Brodmann's area, R = right, L = left, supramarG = supramarginal gyrus, SOG = superior occipital gyrus, MFG = middle frontal gyrus, cingG = cingulate gyrus, MTG = middle temporal gyrus, SFG = superior frontal gyrus, Cblm = cerebellum, parahippG = prahippocampal gyrus.
272
J. Ferri et al. / NeuroImage 70 (2013) 268–277
Fig. 2. Regions of the brain more active for unpleasant non-arousing focus compared to unpleasant arousing focus in Study 1.
Materials and methods
from Study 1 participated in Study 2. Four subjects were excluded from analysis as a result of spending less than 50% of dwell time in the interest area on neutral trials with a non-arousing focus. One of these subjects reported intentionally looking off screen to avoid unpleasant stimuli, while the remaining subjects closed their eyes for large portions of blocks of all types due to self-reported sleepiness. The final data set included 47 participants (25 females) with a mean age of 21.57. Participants self-identified as 57.4% Caucasian, 19.1% Latino/a, 17% Asian, 4.3% African American, and 1% “Other.” The study was approved by The Committees on Research Involving Human Subjects at Stony Brook University. All participants provided informed consent and received payment for their participation. Participants were native English speakers who had normal or corrected to normal vision and no history of neurological or psychiatric diagnoses.
Participants Fifty-one healthy adults with no history of neurological or psychological illness were recruited to participate in Study 2. No participants
Stimuli, procedure, data acquisition and data analysis The stimuli and procedure for Study 2 were largely identical to Study 1 with the following exceptions. In Study 2, the images within
was associated with reduced negative affect and increased activations in frontal and parietal regions associated with cognitive control. However, contrary to our hypothesis, we did not observe a reduction in amygdala activity for this contrast. To ensure that individual differences in task compliance and viewing patterns were not contributing to this lack of difference, we ran a second study using the same task with an additional fifty-one individuals, all with eye-tracking data. In Study 2 we sought to replicate the findings of Study 1 and to investigate any systematic differences resulting the collection of eye-tracking data on all individuals. Study 2
J. Ferri et al. / NeuroImage 70 (2013) 268–277
273
Table 4 Means (and standard deviations) for dwell time and percent dwell time (dwell time in IA/total dwell time − time to first fixation in IA) in the interest area (IA) per image (4000 ms presentation) in Study 2 (n = 47). Unpleasant arousing focus Unpleasant Neutral Neutral Non-arousing focus No focus (no IA visible) Non-arousing focus
Unpleasant No focus (no IA visible)
Dwell time (ms) Arousing: 1410.39 (282.53); non-arousing: 202.39 (115.04) 3312.09 (283.77) Dwell time (%) Arousing: 47%; non-arousing: 5% 96%
each block were no longer presented in a random order. Instead, images were carefully balanced such that the average distance between the centers of interest areas across condition types did not differ. This was to ensure that a difference in the distance that participants moved their eyes to reach the focus areas between unpleasant arousing focus and unpleasant non-arousing focus would not impact observed differences in brain activity for this contrast. In addition, we no longer presented the fixation crosses on alternating grey backgrounds. Instead, we calculated the mean luminance of all affective pictures and set both the instruction screens and the fixation background to this value. This was done to minimize changes in pupil diameter as a function of changes in luminance, which can impact eye-tracking accuracy. Finally, we asked subjects to fixate on the center of the blue circle so that small errors in eye tracking would not result in fixations being recorded as outside of the interest area. The data acquisition and analysis procedures for Study 2 were identical to those listed for the eye-tracking portion of Study 1 with one exception. In order to correct for drift during the course of the experiment, due to changes in pupil size in response to changing luminance levels and emotional content, we enable a drift correction procedure that allowed us to re-calibrate the eye-tracker to the center of the screen during the presentation of fixation crosses. In addition to the data acquisition and analysis procedure described in Study 1, in Study 2 we also used the AAL atlas (Tzourio-Mazoyer et al., 2002) in WFU Pickatlas (Maldjian et al., 2003) to create a bilateral amygdala mask in order to conduct an ROI analysis of amygdala activity. Results Manipulation checks Did participants stay within the focus regions as instructed? Means and standard deviations for dwell time and percent dwell time are presented in Table 4. As in Study 1, during focus trials, participants complied with task instructions to focus on the contents of the blue circle, spending between 96% and 99% of total dwell time within the blue circle. During free viewing of unpleasant images participants again spent significantly more time looking in the areas where the arousing focus region would be compared to where the nonarousing region would be, t (46) = 23.67, p = .001. Areas associated with viewing unpleasant images. Replicating Study 1, the whole brain analysis revealed activations in the occipital, frontal and parietal regions. Overlapping regions of activation included the fusiform gyrus, the middle and superior frontal gyrus in the prefrontal
Table 5 Means (and standard deviations) for ratings of negative affect intensity (1 being “not intense at all” and 4 being “very intense”) following each condition in Study 2 (n = 47). Neutral Unpleasant Unpleasant Unpleasant non-arousing no focus no focus arousing focus focus Affect rating 3.09 (.65)
3.16 (.63)
2.43 (.74)
Neutral non-arousing focus
1.14 (.27) 1.15 (.29)
3168.30 (331.49) 97%
447.24 (132.65) 18%
3317.24 (304.56) 99%
cortex, and the postcentral gyrus in the parietal lobe. Table 3 of the supplemental materials list significant activations associated with this contrast. An ROI analysis using a mask for bilateral amygdala revealed significant peaks in both the right and left amygdala. Coordinates are listed at the bottom of Table 3. Areas associated with focusing. As in Study 1, the effect of overall focus (unpleasant arousing focus + unpleasant non-arousing focus + neutral non-arousing focus greater than unpleasant no focus and neutral no focus) revealed several large clusters of activation covering frontal and parietal regions in Study 2. Peak activations echoed those in Study 1 and included the inferior parietal lobe (BA 40), and the middle frontal gyrus (BA 6). These activations are presented in Table 4 of the supplemental materials. Hypothesis testing Did focusing on a non-arousing portion of an unpleasant image reduce negative affect? Means and standard deviations for affect ratings are presented in Table 5. Replicating Study 1, participants rated their negative affect during the unpleasant non-arousing focus condition as significantly less than both the unpleasant arousing focus, t (46)= 8.21, p b .001, and the unpleasant no focus conditions, t (46)= 6.79, p b .001. Participants also rated affect following the unpleasant non-arousing focus condition as significantly more negative than both the neutral non-arousing focus t (46)= 11.69, p b .001 and the neutral no focus conditions, t (46) = 23.02, p b .001. There were no significant differences between the unpleasant no focus and unpleasant arousing focus conditions, t (46)= .97, p = .34, or the neutral no focus and neutral nonarousing focus conditions, t (46)= .26, p = .80. Was focusing on an arousing portion of an unpleasant image (compared to a non-arousing portion) associated with increased amygdala activation? Contrary to Study 1, in Study 2, focusing on an arousing portion of an unpleasant image compared to a non-arousing portion of an unpleasant image resulted in significantly greater activations in the inferior
Table 6 Peak activations for the unpleasant arousing focus greater than unpleasant non-arousing focus conditions in Study 2 (n=47). Region
BA
Cluster size
Talairach coordinates
T
Z
L IOG R IOG L Cblm L insula L amygdala L IPL L postCG L postCG L IPL L FG
17 17
851
13
26 11 29
−18 −91 −6 22 −91 1 −33 −78 −16 −36 −3 16 −21 −11 −9 −55 −24 34 −58 −27 39 −55 −24 50 −36 −39 49 −40 −48 −17
10.55 8.88 6.85 5.52 4.22 3.73 4.74 3.53 3.60 4.14
7.48 6.74 5.66 4.01 3.86 3.47 4.26 3.30 3.36 3.80
40 2 2 40 37
15 14
Peak activations from random effects analysis are listed with a threshold of pb .025, FDR corrected, and cluster filter of 10 contiguous voxels. BA = Brodmann's area, R = right, L= left, IOG = inferior occipital gyrus, Cblm = cerebellum, IPL = inferior parietal lobe, postCG = postcentral gyrus, FG = fusiform gyrus.
274
J. Ferri et al. / NeuroImage 70 (2013) 268–277
occipital gyrus (BA 17), the insula (BA 13) and the amygdala. These activations are presented in Table 6 and Fig. 3. Was focusing on a non-arousing portion of an unpleasant image (compared to an arousing portion) associated with increased frontal and parietal activity? Consistent with Study 1, in Study 2 focusing on a non-arousing portion of an unpleasant image also resulted in significantly greater activations in parietal regions including the supramarginal gyrus (BA 40), as well as widespread activation in frontal regions including the middle frontal gyrus (BA 10) and the superior frontal gyrus (BA 9). These activations are presented in Table 7 and Fig. 4. In summary, Study 2 replicated Study 1 by demonstrating that attention to a non-arousing, compared to an arousing, portion of an unpleasant image was again associated with reduced negative affect and increased activations in frontal and parietal regions. However, in
contrast to Study 1, in Study 2 attention to a non-arousing, compared to an arousing, portion of an unpleasant image was also associated with a reduction in amygdala activation. Discussion The purpose of this research was to examine the neural and subjective response associated with the deployment of visual attention in the absence of an explicit regulatory goal. Consistent with previous findings regarding the passive viewing of emotional images (Phan et al., 2002), we found greater activations in frontal and parietal regions and in the amygdala in response to unpleasant compared to neutral images in both Study 1 and Study 2. Also consistent with previous findings in non-emotional attention paradigms, in both studies we found increases in frontal and parietal regions during blocks in which
Fig. 3. Regions of the brain more active for unpleasant arousing focus compared to unpleasant non-arousing focus in Study 2.
J. Ferri et al. / NeuroImage 70 (2013) 268–277 Table 7 Peak activations for unpleasant non-arousing focus compared to unpleasant arousing focus conditions in Study 2 (n = 47). Region
BA
Cluster size
Talairach coordinates
T
Z
R supramarG R STG L STG R MidFG R SFG R SFG L parahippG L ITG R MidTG L SFG L SFG L MidFG L MidFG L MidFG L Cblm L Cblm
40 39 39 8 10 10 37 20 21 10 10 8 9 6
2214
56 −50 28 48 −53 30 −48 −53 29 34 25 41 19 49 25 34 49 19 −25 −45 −9 −55 −34 −12 42 1 −29 −33 49 25 −25 46 17 −33 17 43 −33 29 34 −44 13 46 −36 −54 −36 −40 −46 −36
9.78 9.21 6.42 6.74 5.93 5.86 4.74 4.57 4.32 4.14 3.33 4.10 3.33 3.05 3.80 3.18
7.16 6.90 5.40 5.59 5.08 5.04 4.26 4.12 3.93 3.80 3.13 3.76 3.13 2.89 3.53 3.01
1220
78 51 13 64 136
56
Peak activations from random effects analysis are listed with a threshold of p b .025, FDR corrected, and cluster filter of 10 contiguous voxels. BA = Brodmann's area, R = right, L= left, supramarG = supramarginal gyrus, MFG = middle frontal gyrus, SFG = superior frontal gyrus, parahippG = prahippocampal gyrus. ITG = inferior temporal gyrus, MTG = middle temporal gyrus, Cblm = cerebellum.
attention was directed to specific aspects of images (Hopfinger et al., 2000). As hypothesized, we observed increases in frontal and parietal regions when subjects directed their attention to non-arousing compared to arousing portions of unpleasant images. Moreover, in Study 2, we observed reductions in amygdala activity for this contrast. Eye tracking results in a sub-sample of participants in Study 1 and in all participants in Study 2 confirmed that subjects who underwent eyetracking generally stayed within the focus region as instructed. Studies on emotion regulation, particularly cognitive reappraisal, have postulated that the use of cognitive control to carry out emotion regulation strategies may engage the prefrontal cortex. The prefrontal cortex, then, may exert top-down control over the amygdala, which modulates sensory processing of emotional information and causes corresponding reductions in subjective affect. Given that unpleasant stimuli have the capacity to automatically capture attention, deploying attention away from such stimuli may also require effortful action. Exercising visual and inhibitory control to deploy attention away from unpleasant information may then rely on similar prefrontal regions and may promote similar decreases in amygdala activity and subjective negative affect as cognitive reappraisal. In both of the current studies we observed widespread increases in frontal, as well as parietal, regions for the unpleasant non-arousing focus compared to the unpleasant arousing focus condition, despite focus being a common factor across both conditions. That is, these regions were more active when participants had to maintain focus in a relatively non-arousing compared to an arousing region of the same picture. Prefrontal and parietal regions are considered essential for cognitive control during effortful tasks (Matsumoto and Tanaka, 2004), and fronto-parietal networks are known to underlie visuospatial attention and visual control (Corbetta and Shulman, 2002). As even taskirrelevant negative information is capable of capturing attention (Vuilleumier et al., 2001), increased activation in these regions may reflect additional effort required to direct and maintain attention within a non-arousing focus region in the presence of unpleasant arousing information. Some of the brain regions recruited as participants divert attention away from unpleasant arousing information substantially overlap with regions activated during effortful emotion regulation. Specifically prefrontal regions including BA 6, 8, and 9, which are postulated to relate to the down-regulation of the amygdala, are common to both cognitive reappraisal and attentional deployment. Reduced amygdala activation for the unpleasant non-arousing focus compared to the unpleasant arousing focus condition was observed in
275
Study 2, but not Study 1. The design and analysis of Studies 1 and 2 were identical with one major exception: eye-tracking data were collected on all participants in Study 2, but only on a subset of five participants in Study 1. The divergent findings between these two studies highlight important challenges in imaging research, as well as the advantages of utilizing eye tracking in conjunction with fMRI. First, researchers rely on participants to stay awake and attend to presented stimuli. However, collecting eye tracking data allowed us to exclude four participants from Study 2 who were intentionally avoiding the stimuli or who were otherwise closing their eyes for a large portion of the study. Despite closing eyes for extended periods of time, these participants still pressed the button to rate their affect following each block of images. Without eye tracking, we would have no objective means to remove these subjects from analyses. Because we only collected eye-tracking on 5 out of 41 subjects in Study 1, it is possible that noncompliance from a number of subjects in Study 1 attenuated more subtle effects. Second, it is possible that simply knowing that their eye movements were being tracked changed the degree to which subjects complied with task instructions. While differences in task compliance as a function of eye-tracking have not been explicitly examined, there is some evidence that eye-tracking alone can modify behavior to increase adherence to perceived social norms (Risko and Kingstone, 2010). It is possible that participants in Study 2 were more likely to consistently stay within the circle as instructed, particularly the unpleasant nonarousing circle, when they knew their eye movements were being monitored. Consequently, we consider the observed amygdala and visual activation for the unpleasant arousing focus compared to unpleasant non-arousing focus condition in Study 2 to reflect activations when subjects are complying with task instructions. Study 2, therefore, provides support for the idea that attentional deployment relies upon a similar network of brain regions as cognitive reappraisal; successful regulation via either strategy appears to involve increases in prefrontal regions associated with effortful control, as well as corresponding attenuations in amygdala activity. However, the specific relationships between prefrontal regions and the amygdala, as well as their relationship to subjective affect, may differ between emotion regulation strategies; a study directly contrasting both strategies would be necessary in order to elucidate the common and unique mechanisms associated with each. Finally, it cannot be ruled out that participants may have been engaging in some form of automatic emotion regulation using methods other than attentional deployment during the viewing of images, which may have contributed to the resulting activation patterns in either study. Future studies might also examine individual differences in attentional deployment success using eye-tracking; for instance, the use of attentional deployment as an emotion regulation strategy might vary as a function of time “naturally” spent on negative information. It is possible that subjects who automatically attend to negative information will show quite different activation patterns during focused viewing than subjects who automatically avoid negative information. Finally, connectivity studies would be useful in determining the ways in which these critical brain regions — frontal and parietal networks and the amygdala — interact to influence sensory processing and evaluation of negative information in the context of attentional deployment. In conclusion, these studies suggest that deploying attention to a non-arousing portion of an unpleasant image is associated with reduced subjective negative affect, reduced amygdala activity, and increased activity in fronto-parietal networks. This suggests that the neural circuitry associated with attentional deployment may significantly overlap with effortful emotion regulation strategies such as cognitive reappraisal. Understanding the shared and unique neural mechanisms associated with this commonly used strategy may be critical to understanding the processes underlying emotion regulation as well as for understanding deficits in the ability to deploy attention away from negative information when necessary. Supplementary data to this article can be found online at http:// dx.doi.org/10.1016/j.neuroimage.2012.12.030.
276
J. Ferri et al. / NeuroImage 70 (2013) 268–277
Fig. 4. Regions of the brain more active for unpleasant non-arousing focus compared to unpleasant arousing focus in Study 2.
Appendix A Neutral IAPS images: 7950, 7705, 7700, 7595, 7560, 7550, 7491, 7490, 7285, 7233, 7217, 7175, 7150, 7140, 7100, 7090, 7025, 7020, 7010, 7004, 7002, 7000, 5875, 5740, 5530, 5390, 5250, 2980, 2880, 2745, 2580, 2440, 2393, 2383, 2320, 2270, 2235, 2206, 2190, 2102. Unpleasant IAPS images: 9810, 9635, 9584, 9571, 9570, 9435, 9433, 9430, 9428, 9420, 9410, 9405, 9403, 9400, 9300, 9265, 9253, 9252, 9040, 8480, 6831, 6571, 6570, 6560, 6555, 6550, 6415, 6370, 6315, 6313, 6312, 6260, 6242, 6190, 6022, 3550, 3530, 3266, 3261, 3225, 3220, 3213, 3212, 3211, 3195, 3181, 3063, 3060, 3053, 3030, 3017, 3016, 3015, 3010, 3005, 2811, 2800, 2730, 2717, 2703. References Bar-Haim, Y., Lamy, D., Pergamin, L., Bakermans-Kranenburg, M.J., van Ijzendoorn, M.H., 2007. Threat-related attentional bias in anxious and nonanxious individuals: a meta-analytic study. Psychol. Bull. 133 (1), 1–24.
Corbetta, M., Shulman, G.L., 2002. Control of goal-directed and stimulus-driven attention in the brain. Nat. Rev. Neurosci. 3 (3), 201–215. Cuthbert, B.N., Schupp, H.T., Bradley, M., Birbaumer, N., Lang, P.J., 2000. Brain potentials in affective picture processing: Covariation with autonomic arousal and affective report. Biol. Psychol. 52 (2), 95–111. Dunning, J., Hajcak, G., 2009. See no evil: directing visual attention within unpleasant images modulates the electrocortical response. Psychophysiology 46 (1), 28–33. Foti, D., Hajcak, G., 2008. Deconstructing reappraisal: descriptions preceding arousing pictures modulate the subsequent neural response. J. Cogn. Neurosci. 20 (6), 977–988. Gross, J.J., 1998. The emerging field of emotion regulation: an integrative review. Rev. Gen. Psychol. 2 (3), 271–299. Gross, J.J., Thompson, R.A., 2007. Emotion Regulation: Conceptual Foundations. In: Gross, J.J. (Ed.), Handbook of Emotion Regulation. Guilford Press, New York, NY, USA, pp. 3–24. Hajcak, G., Nieuwenhuis, S., 2006. Reappraisal modulates the electrocortical response to unpleasant pictures. Cogn. Affect. Behav. Neurosci. 6 (4), 291–297. Hajcak, G., Dunning, J., Foti, D., 2009. Motivated and controlled attention to emotion: time-course of the late positive potential. Clin. Neurophysiol. 120, 505–510. Harris, P.L., Lipian, M.S., 1989. Understanding Emotion and Experiencing Emotion. In: Saarni, C., Harris, P.L. (Eds.), Children's Understanding of Emotion. Cambridge University Press, New York, NY, USA, pp. 241–258. Hopfinger, J.B., Buonocore, M.H., Mangun, G.R., 2000. The neural mechanisms of topdown attentional control. Nat. Neurosci. 3 (3), 284–291.
J. Ferri et al. / NeuroImage 70 (2013) 268–277 Isaacowitz, D.M., Wadlinger, H.A., Goren, D., Wilson, H.R., 2006. Selective preference in visual fixation away from negative images in old age? An eye-tracking study. Psychol. Aging 21 (1), 40–48. Isaacowitz, D.M., Toner, K., Neupert, S.D., 2009. Use of gaze for real-time mood regulation: effects of age and attentional functioning. Psychol. Aging 24 (4), 989–994. Johnson, D.R., 2009. Goal-directed attentional deployment to emotional faces and individual differences in emotional regulation. J. Res. Personal. 43 (1), 8–13. Joormann, J., 2009. Cognitive Aspects of Depression, In: Gotlib, I.H., Hammen, C.L. (Eds.), Handbook of Depression, 2nd ed. Guilford Press, New York, NY US, pp. 298–321. Lang, P.J., Bradley, M., 2010. Emotion and the motivational brain. Biol. Psychol. 84 (3), 437–450. http://dx.doi.org/10.1016/j.biopsycho.2009.10.007. Lang, P.J., Bradley, M., Cuthbert, B., 1997. Motivated attention: affect, activation, and action. In: Lang, P.J., Simons, R.F., Balaban, M.T. (Eds.), Attention and Orienting: Sensory and Motivational Processes. Lawrence Erlbaum Associates, Inc., Hillsdale, NJ, pp. 97–135. Lang, P.J., Bradley, M.M., Cuthbert, B.N., 2005. International affective picture system (IAPS): affective ratings of pictures and instruction manual. University of Florida, Gainesville, FL. Lang, P.J., Bradley, M., Cuthbert, B.N., 2008. International affective picture system (IAPS): Affective ratings of pictures and instruction manual. Technical Report A-8. University of Florida, Gainesville, FL. MacNamara, A., Hajcak, G., 2009. Anxiety and spatial attention moderate the electrocortical response to aversive pictures. Neuropsychologia 47 (13), 2975–2980. MacNamara, A., Foti, D., Hajcak, G., 2009. Tell me about it: neural activity elicited by emotional stimuli and preceding descriptions. Emotion 9 (4), 531–543. Maldjian, J.A., Laurienti, P.J., Kraft, R.A., Burdette, J.H., 2003. An automated method for neuroanatomic and cytoarchitectonic atlas-based interrogation of fMRI data sets. Neuroimage 19 (3), 1233–1239. Mather, M., Carstensen, L., 2005. Aging and motivated cognition: the positivity effect in attention and memory. Trends Cogn. Sci. 9, 496–502. Matsumoto, K., Tanaka, K., 2004. Conflict and cognitive control. Science 303 (5660), 969–970. Mischel, W., Ayduk, O., 2011. Willpower in a Cognitive Affect Processing System: The Dynamics of Delay of Gratification, In: Vohs, K.D., Baumeister, R.F. (Eds.), Handbook of self-regulation: Research, theory, and applications, 2nd ed. Guilford Press, New York, NY US, pp. 83–105.
277
Moratti, S., Keil, A., Stolarova, M., 2004. Motivated attention in emotional picture processing is reflected by activity modulation in cortical attention networks. Neuroimage 21, 945–964. Ochsner, K.N., Gross, J.J., 2008. Cognitive emotion regulation: insights from social cognitive and affective neuroscience. Curr. Dir. Psychol. Sci. 17 (2), 153–158. Öhman, A., Flykt, A., Esteves, F., 2001. Emotion drives attention: detecting the snake in the grass. J. Exp. Psychol. Gen. 130 (3), 466–478. Pessoa, L., Kastner, S., Ungerleider, L.G., 2003. Neuroimaging studies of attention: from modulation of sensory processing to top-down control. J. Neurosci. 23 (10), 3990–3998. Phan, K.L., Wager, T., Taylor, S.F., Liberzon, I., 2002. Functional neuroanatomy of emotion: a meta-analysis of emotion activation studies in PET and fMRI. Neuroimage 16 (2), 331–348. Risko, E., Kingstone, A., 2010. Eyes wide shut: implied social presence, eye tracking and attention. Atten. Percept. Psychophys. 73 (2), 291–296. Schupp, H.T., Cuthbert, B.N., Bradley, M., Cacioppo, J.T., Ito, T., Lang, P.J., 2000. Affective picture processing: the late positive potential is modulated by motivational relevance. Psychophysiology 37 (02), 257–261. Tzourio-Mazoyer, N., Landeau, B., Papathanassiou, D., Crivello, F., Etard, O., Delcroix, N., et al., 2002. Automated anatomical labeling of activations in SPM using a macroscopic anatomical parcellation of the MNI MRI single-subject brain. Neuroimage 15 (1), 273–289. Urry, H.L., 2010. Seeing, thinking, and feeling: emotion-regulating effects of gaze-directed cognitive reappraisal. Emotion 10 (1), 125–135. van Reekum, C.M., Johnstone, T., Urry, H.L., Thurow, M.E., Schaefer, H.S., Alexander, A.L., et al., 2007. Gaze fixations predict brain activation during the voluntary regulation of picture-induced negative affect. Neuroimage 36 (3), 1041–1055. Vuilleumier, P., Schwartz, S., 2001. Beware and be aware: capture of spatial attention by fear-related stimuli in neglect. NeuroReport Rapid Comm. Neurosci. Res. 12 (6), 1119–1122. Vuilleumier, P., Armony, J.L., Driver, J., Dolan, R.J., 2001. Effects of attention and emotion on face processing in the human brain: an event-related fMRI study. Neuron 30 (3), 829–841. Xing, C.D., 2006. Aiming at happiness: how motivation affects attention to and memory for emotional images. Motiv. Emot. 30 (3), 243–250 (Article).