Neural Correlates of Simulated Driving: Auditory Oddball Responses Dependent on Workload Markus Raabe¹, Roland M. Rutschmann¹, Michael Schrauf2 Mark W. Greenlee¹ ¹Department of Psychology, University of Regensburg Institute of Experimental Psychology, University of Regensburg, Universitaetsstr. 31 93053 Regensburg, Germany (
[email protected]) 2 Experimentelle Biologische Psychologie, University of Düsseldorf, D-40225 Düsseldorf,
Abstract In the present study, we explored the neural responses to seldom auditory tones presented to volunteers via headphones while they participated in a simulated driving experiment. Experimental manipulation of the workload was achieved in two conditions, one in which the driver set his or her own pace (low workload) and another in which the driver’s pace was determined by a lead car (high workload). Using EEG and fMRI, we could determine a significant effect of workload on the amplitude of the P3 component to auditory oddballs. The reduction of P3-amplitude during the high workload conidition was associated with a more focused hemodynamic response in fMRI.
1
Introduction
Ergonomics is the study of human behavior in work settings, with the aim to design work environments optimal with respect to economic and human aspects (Laurig, 1990). Wickens (2002) defines workload in ergonomics as the relation between the (quantitative) demand for resources imposed by a task and the ability to supply those resources by the operator. In this context prototypes of man-machine interfaces should be tested for their usability and experienced workload before rational decisions can be made concerning their production. As a related discipline, cognitive neuroscience seeks to reveal the neural basis for cognition by employing electroencephalographic (EEG) brain-imaging (PET, fMRI) techniques in human volunteers to determine which cortical regions are involved in psychological tasks. One application of cognitive neuroscience to ergonomics is the study of brain activations during demanding cognitive tasks (Corbetta & Shulman, 2002). For example one can distinguish between different taskloads and states of complexity in verifying the meaning of a sentence by using neuroscientific methods like fMRI (Schmalhofer, Raabe, Friese, Pietruska & Rutschmann, 2004). This research project intends to combine these two areas - ergonomics and cognitive neuroscience - in a neuroergonomic approach (Baldwin, 2003; Sarter & Sarter, 2003) to study the effect of workload on objective measures of brain activation during simulated driving. Mental workload assessment techniques in ergonomics are often grouped into three categories: Subjective measures, behavioral measures (primary, dual or multiple task measures) and
psychophysiological measures (De Waard, 1996; Wickens, 2000). In our neuroergonomic approach we combine all the three categories. We assess the subjectively experienced effort by a rating scale and introduce a psychophysiological assessed dual task paradigm as an objective measurement of workload. More precisely, methods of electroencephalography (EEG) and functional magnetic resonance imaging (fMRI) are combined to determine the effects of simulated driving on the cortical responses to repetitive auditory stimulation (oddball task). After identifying workload-sensitive brain regions we use EEG and fMRI to gain objective measures of workload, which are not possible with behavioral or subjective measurements alone. Dual tasks have been developed to test for limited capacity in divided attention paradigms. Compared with single tasks they provide extensive information concerning cross- and intramodal time-sharing capacities (Wickens, 2000). Event-related potentials are averaged event-triggered brain potentials that can be extracted from on-going EEG (Andreassi, 2001). A prominent component of the ERP in cognitive tasks is the P3, which is expressed in a positive wave with a maximum around 300 msec poststimulus. The amplitude of this positive ERP component is dependent on the stimulus and task: seldom occurring stimuli (oddballs) evoke a prominent P3 (Andreassi, 2001) and its amplitude can be modulated by varying levels of workload (Fowler, 1994; Kramer, Trejo & Humphrey, 1995). Here volunteers perform a primary task (driving under high and low workload demands), while an additional secondary task is performed (listening to intermittent sinusoidal tones of constant frequency). The introduction of seldom, unpredictable oddballs in the form of single tones (one octave above that of the “standards”) is expected to evoke a robust positivity in the EEG approximately 300 ms poststimulus. The amplitude of this evoked response is reduced under high, compared to low, workload (Kramer et al., 1995). This neural activity should also evoke hemodynamic responses that can be detected in fMRI (Soltani & Knight, 2000). A further aim of this study is to locate this cortical activity in human cortex and see how workload effects the extent and distribution of the fMRI response. 2
Methods
2.1 Subjects Overall, 11 participants (females = 5, mean age = 26, SD = 2.7) participated in the EEG experiment at the University of Osnabrück. All of them had normal visual and auditory acuity, had no neurological disturbances and were familiar with playing racecar games. Three of them (n = 3, male, mean age = 27 yrs, SD = 2 yrs) participated in the fMRI experiment. Participants were paid € 22.5 for approximately 3 hours of their time. 2.2 Procedures and material We adapted a commercially available computer game (DTM-Racedriver, Codemasters, U.K.) for our purposes. The test driver could control the simulated speed and steering of the racecar through appropriate manipulation of the keyboard (response box in fMRI), which was practiced in a warm-up session. During the experiments, volunteers were instructed to “drive” a DTM racecar in separate runs under low (self-paced) and high (pace determined by lead car) workloads. While driving the volunteers were instructed to attend to frequent and low (80%, 1000 Hz) or seldom and high tones (20%, 2000 Hz), which were presented via headphones and
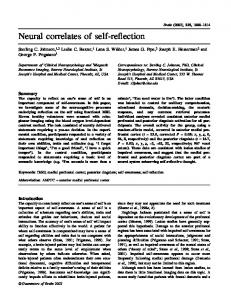
custom-made software in both experiments. In the fMRI experiment one trial consisted of 7 tones. The third position within one trial could either be a frequent or a low tone (see Figure 1 for an illustration of a trial). We presented 96 frequent and 24 seldom trials in a randomized order. For the EEG experiment we presented 40 trials of each condition. To keep the proportion between the frequent and seldom tones constant, the position of the seldom tone within one trial was variable with the restriction that the seldom tones were not allowed to appear consecutively.
Figure 1: Timing of auditory stimuli presented during a representative trial in the fMRI experiment, F = frequent tone, S = seldom tone (target - one octave higher than F).
In the high workload condition subjects were instructed to obtain a new personal “top score”. A lead car, representing the speed recorded in the last lap, was added to provide the participants with feedback about their performance. As a lead car we used a semi-transparent image, since this “ghost” had the advantage of simulating a race without the risk of collisions. In the low workload condition participants were instructed to drive several continuous laps. The lead car was switched off in this condition. In the EEG experiment we inserted an additional control condition. Subjects were instructed to respond to the seldom tones as fast as possible by a button press while maintaining their gaze on a central fixation spot. For assessing the subjectively experienced load of the three experimental conditions, subjects were asked to fill out the Rating Scale Mental Effort (Zijlstra, 1993) after the EEG experiment. 2.2.1 EEG protocol: Acquisition and Analysis EEG data were collected continuously (sampling rate: 50 Hz; bandpass filtering: 0.1-70 Hz; gain: 1000) with the software SCAN 3.0 (Neuroscan Inc., USA) and a 32-channel Synamps EEG amplifier system Model 5083 (Neuroscan Inc., USA). The impedances of the Ag/AgCl electrodes were below 10,000 ohms. Electroencephalographic activity was recorded from 9 sites (F3, Fz, F4, C3, Cz, C4, P3, Pz, P4) according to the international 10-20 System (Jasper, 1958). They were referenced to both mastoids. During simulated “driving” the volunteers sat in a comfortable examination armchair, seated approximately 80 cm away from a LCD monitor and they were given access to a keyboard. The data was post-processed and assessed using BrainVision Analyzer (BrainProducts, Germany). Raw data were inspected (maximum allowed voltage step: 50 µV; maximum allowed absolute difference: 200 µV for 200 ms; lowest allowed activity: 0.5 µV for 100 ms) and elements surpassing our thresholds (including a baseline interval of 1000 ms) were excluded from further analysis. In a next step, the EEG data were filtered (bandpass: 0.01-40 Hz; 50 Hz Notch Filter) and segmented by creating overlapping segments lasting from 500 ms pre- until 1000ms poststimulus. Only seldom tones were included in the segmentation. After correcting the baseline (reference interval 500 ms prestimulus until stimulus onset), the ERPs were calculated. Finally we calculated the grand average for each of the three experimental conditions. For
statistical analysis we identified the positive maximum of the grand average in the control condition, which appeared 330 ms poststimulus. The mean values of each subject for this time point entered a paired T-test on second level to compare the low with the high workload condition. The subjects’ individual P3 peaks of the different conditions were variable. We therefore omitted the latency factor from our approach to significance testing, which was very stringent. 2.2.2 Brain imaging protocol: Acquisition and Analysis Brain-imaging was performed using functional Magnetic resonance imaging on a 1.5 Tesla Magnetom Sonata scanner (Siemens, Germany) at the Brain-Imaging Center, University of Oldenburg. This scanner is equipped with an echo-planar imaging (EPI) booster for fast gradient switching. Subjects were placed in the scanner and equipped with an MRT compatible LUMItouch response box (Photon Control Inc., Canada) and headphones (MR Confon, Germany). Their head position was secured in the head coil, and a mirror system was placed on the coil, so that they could see the racing game on a screen mounted on the rear of the scanner bore. Highresolution, sagittal T1-weighted images were acquired at the end of the experiment with the magnetization prepared, rapid acquisition gradient echo sequence (MP-RAGE) to obtain a 3D anatomical scan of the head and brain (TR = 1900 ms; TE = 3.93 ms; 1 mm3 isotropic voxel size). Functional imaging was performed with T2*-weighted gradient echo-planar imaging (EPI). The time to echo corresponded to TE=50 ms, total scan repetition time was TR=7 sec, the acquisition time was 2 sec, the flip angle corresponded to 90°, and we used a field of view FOV = 192 mm, with a voxel matrix of 3 * 3 mm and a slice thickness of 3 mm, resulting in a 27 mm3 isotropic voxel size. We acquired volumes with 22 contiguous slices and a distance factor of 1020 %. The acquisition sequence of the slices was interleaved. The slices were rotated approximately 20° relating to the AC-PC line thus we could image most of the frontal and parietal lobe and superior temporal areas. The stimulation protocol consisted of 122 volumes per run. We used an event-related design and sparse imaging to separate in time the response to the auditory stimuli and minimize the effects of gradient switching noises on the BOLD response (Mueller et al., 2003). All MR-data were preprocessed and statistically analyzed using SPM2 (Functional Imaging Laboratory, Welcome Department of Imaging Neuroscience, London, UK). Functional images were corrected for acquisition timing, realigned to the first image and coregistered to the structural images. After normalizing all images to the MNI template, functional images were resampled to 2x2x2 mm³ and spatially smoothed using an isotropic Gaussian kernel with 8 mm FWHM. A general linear model was fitted to the individuals, modelling the standard and the deviant sounds as events. We modelled both events explicitly to avoid mixing up the first scan, which was not task-related, with each of our experimental conditions. For statistical analysis, a fixed-effects model was applied, treating the different subjects as different experimental sessions. T-contrasts were calculated between the deviant and the standard tone in the high and the low workload condition. Statistical maps were thresholded with T = 3.1 (uncorrected p-value .001) and clusters surpassing a corrected p-value of .05 on cluster level were reported as significantly activated. 3
Results
3.1
Subjectively experienced load
Figure 2 shows the mean values of the Rating Scale Mental Effort (Zijlstra, 1993) in the low and the high workload condition of the EEG Experiment. Both conditions differ significantly from each other as calculated by a paired t-Test (p