J Neurophysiol 87: 976 –994, 2002; 10.1152/jn.00568.2001.
Neural Correlates of the Precedence Effect in the Inferior Colliculus: Effect of Localization Cues R. Y. LITOVSKY1,2 AND B. DELGUTTE1,3 1 Eaton-Peabody Laboratory, Massachusetts Eye and Ear Infirmary, Boston 02143; 2Hearing Research Center, Boston University, Boston 02215; and 3Research Laboratory of Electronics, MIT, Cambridge, Massachusetts 02114 Received 11 July 2001; accepted in final form 23 October 2001
Litovsky, R. Y. and B. Delgutte. Neural correlates of the precedence effect in the inferior colliculus: effect of localization cues. J Neurophysiol 87: 976 –994, 2002; 10.1152/jn.00568.2001. The precedence effect (PE) is an auditory phenomenon involved in suppressing the perception of echoes in reverberant environments, and is thought to facilitate accurate localization of sound sources. We investigated physiological correlates of the PE in the inferior colliculus (IC) of anesthetized cats, with a focus on directional mechanisms for this phenomenon. We used a virtual space (VS) technique, where two clicks (a “lead” and a “lag”) separated by a brief time delay were each filtered through head-related transfer functions (HRTFs). For nearly all neurons, the response to the lag was suppressed for short delays and recovered at long delays. In general, both the time course and the directional patterns of suppression resembled those reported in freefield studies in many respects, suggesting that our VS simulation contained the essential cues for studying PE phenomena. The relationship between the directionality of the response to the lead and that of its suppressive effect on the lag varied a great deal among IC neurons. For a majority of units, both excitation produced by the lead and suppression of the lag response were highly directional, and the two were similar to one another. For these neurons, the long-lasting inhibitory inputs thought to be responsible for suppression seem to have similar spatial tuning as the inputs that determine the excitatory response to the lead. Further, the behavior of these neurons is consistent with psychophysical observations that the PE is strongest when the lead and the lag originate from neighboring spatial locations. For other neurons, either there was no obvious relationship between the directionality of the excitatory lead response and the directionality of suppression, or the suppression was highly directional whereas the excitation was not, or vice versa. For these neurons, the excitation and the suppression produced by the lead seem to depend on different mechanisms. Manipulation of the directional cues (such as interaural time and level differences) contained in the lead revealed further dissociations between excitation and suppression. Specifically, for about one-third of the neurons, suppression depended on different directional cues than did the response to the lead, even though the directionality of suppression was similar to that of the lead response when all cues were present. This finding suggests that the inhibitory inputs causing suppression may originate in part from subcollicular auditory nuclei processing different directional cues than the inputs that determine the excitatory response to the lead. Neurons showing such dissociations may play an important role in the PE when the lead and the lag originate from very different directions.
Present address and address for reprint requests: R. Y. Litovsky, University of Wisconsin, Waisman Center, Rm. 525, 1500 Highland Ave., Madison, WI 53705 (E-mail:
[email protected]). 976
INTRODUCTION
When a sound is produced in a reverberant environment, it propagates in multiple directions and is subsequently reflected from nearby surfaces. The auditory system is thus faced with resolving competition between the direct sound and its reflections for perception and localization. The neural mechanisms mediating this process are not well understood and are therefore the focus of the present study. A common approach taken by psychophysicists is to create a simplified version of a room. A source and a single reflection are simulated with two loudspeakers positioned in an anechoic room, and stimulated by two identical sounds separated by a delay. The sound pressure waveforms measured at the tympanic membranes for such stimuli are shown in Fig. 1A. In this arrangement, the direct sound is called the lead, and the reflection is called the lag. The simulation is not entirely realistic because the two sounds are presented at the same level, while reflections in real rooms invariably have a reduced amplitude. Moreover, most rooms have multiple rather than a single reflection. Three distinct perceptual phenomena subsumed under the term “precedence effect” (PE) are observed in the lead-lag stimulus configuration (for review see Litovsky et al. 1999). Fusion refers to the fact that, when the lead-lag delay is short (⬍5 ms for clicks), the listener perceives a single, fused auditory event. For delays less than 1 ms, both the lead and lag contribute to the perceived location of that event, a region known as summing localization. Between 1 and 5 ms, the perceived location of the fused event is very close to the leading source, an effect known as localization dominance (e.g., Blauert 1997; Wallach et al. 1949; Zurek 1980). A third phenomenon, discrimination suppression, refers to the degradation in listeners’ ability to identify changes in the location of the lagging source, and this effect is usually effective at the same delays as localization dominance (e.g., Litovsky and Macmillan 1994; Litovsky and Shinn-Cunningham 2001; Shinn-Cunningham et al. 1993; Tollin and Henning 1998). In general, these PE phenomena are distinct from forward masking in that the listener is always aware of the reflection through changes in timbre and spatial extent of the percept. It has been argued that the function of the PE is to enhance localization accuracy in reverberant environments (e.g., Blauert 1997; Litovsky et al. 1999). The costs of publication of this article were defrayed in part by the payment of page charges. The article must therefore be hereby marked ‘‘advertisement’’ in accordance with 18 U.S.C. Section 1734 solely to indicate this fact.
0022-3077/02 $5.00 Copyright © 2002 The American Physiological Society
www.jn.org
LOCALIZATION CUES AND PRECEDENCE IN THE IC
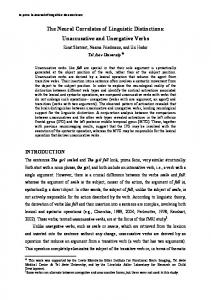
FIG. 1. A: stimulus configurations commonly used in studies of the precedence effect (PE). Shown here is a sketch of 2 impulse responses to click-pairs as the lead and lag sound sources reach the ears in free field from 45° to the right and left. There are natural interaural differences in time and intensity between the stimuli at the 2 ears, as well as some differences in the spectral shape. Finally, to simulate the precedence effect, there is an inter-stimulus delay, simulating the echo delay of the lag relative to the lead. B: responses from one inferior colliculus (IC) neuron to pairs of clicks, presented with a lead-lag delay varying from 1 to 120 ms on a log scale. Dot rasters show responses at each delay as a function of the time lag between the onsets of the leading and lagging click pairs. C: mean spike count vs. azimuth for the lead (●) and lag (—). These values were obtained by windowing the lead and lag responses separately (Litovsky and Yin 1998a).
J Neurophysiol • VOL
977
Fusion and localization dominance have been measured behaviorally in various nonhuman species, including cat (Cranford 1982; Populin and Yin 1998), rat (Kelly 1974), barn owl (Keller and Takahashi 1996), and cricket (Wyttenbach and Hoy 1993). In addition, physiological studies have identified possible correlates of the PE in the responses of single neurons in the inferior colliculus (IC) and other auditory nuclei (Fitzpatrick et al. 1995, 1999; Keller and Takahashi 1996; Litovsky and Yin 1998a,b; Yin 1994). In these experiments, lead-lag click pairs were presented from different locations with varying delays. For nearly all neurons, the response to the lag was suppressed at short delays, with a gradual recovery as delay increased. These findings parallel the perceptual effect of fusion. Even more important is the finding that neural suppression varies with the locations of both the lead and the lag, implicating this mechanism in the perceptual effect of localization dominance. In free-field experiments, Litovsky and Yin (1998b) showed that, for most IC neurons, suppression is strongest when the lead is at the neuron’s “best” location. In a headphone study using dichotic clicks, Fitzpatrick et al. (1995) reported that, while one-half of the neurons show stronger suppression when the lead’s interaural time delay (ITD) is near the neuron’s “best” ITD, the other half show stronger suppression when the lead is near the “worst” ITD. Here we examine in more detail how the directionality of neural suppression relates to the excitatory directional response to the lead. Although these studies demonstrate that neural suppression depends on the lead location, they do not establish the extent to which suppression is linked to specific localization cues. In fact, this work was conducted either under headphones, where only ITD was varied (Fitzpatrick et al. 1995), or in free field (Litovsky and Yin 1998b), where all directional cues co-vary, including interaural differences in level (ILD) and time (ITD), and spectral cues. The IC receives inputs from nearly all brain stem auditory nuclei, and these inputs differ in their sensitivity to localization cues (Oliver and Huerta 1992). For example, low-frequency inputs from the medial superior olive (MSO) are primarily sensitive to ITD, while high-frequency inputs from the lateral superior olive (LSO) are primarily sensitive to ILD, and inputs from the dorsal cochlear nucleus (DCN) are sharply sensitive to spectral features such are notches (see Irvine 1992 for review). This complex pattern of inputs and cue sensitivity raises the question of whether, in a PE paradigm, the sensitivity of IC neurons to the leading source direction, and the directionally dependent suppression of the lagging source are mediated by the same or different inputs. In this paper, we address this question using virtual-space (VS) stimuli obtained by digitally filtering sound waveforms through head-related transfer functions (HRTFs). VS stimuli contain multiple, co-varying localization cues as in free field, and also allow precise control over each individual cue. This technique was used by Delgutte et al. (1995, 1999) to investigate directional sensitivity of cells in the IC of anesthetized cats for broadband noise stimuli, specifically to identify which localization cues are the most potent in these neurons. The present study extends this VS technique to a more complex stimulus consisting of a leading and a lagging sound and measures the effect of variation in directional cues contained in the lead on the suppression of the response to a fixed lag. Our main goal was to tease apart general suppressive mechanisms (such as forward masking) from suppression that is specifically
87 • FEBRUARY 2002 •
www.jn.org
978
R. Y. LITOVSKY AND B. DELGUTTE
dependent on directional cues by selectively manipulating directional cues in the VS stimuli. A secondary, yet necessary, goal was to verify that the time course and directionality of suppression for VS stimuli is consistent with that observed in free field for the same species (Litovsky and Yin 1998a,b; Yin 1994). METHODS
Recording techniques Methods for recording from single units in the IC of anesthetized cats were essentially the same as described by Delgutte et al. (1999). Healthy, adult cats were initially anesthetized with a mixture of diallyl barbituric acid and urethan (75 mg/kg ip), and additional doses provided as necessary throughout the experiment to maintain deep levels of anesthesia. A rectal thermometer was used to monitor and maintain temperature at 37–38°C. A tracheal canula was inserted, both pinnae were partlially dissected away, and the ear canals were cut to allow insertion of acoustic assemblies. A small hole was drilled in each bulla, and a 30-cm plastic tube was inserted to prevent static pressure buildup in the middle ear. The animal was placed in a double-walled, electrically shielded, sound-proof chamber. The posterior surface of the IC was exposed via a posterior-fossa craniotomy and aspiration of the overlying cerebellum. Parylene-insulated tungsten microelectrodes (Microprobe, Clarksburg, MD) with exposed tips of 8 –12 m were mounted on a remote-controlled hydraulic microdrive and inserted into the IC. The electrodes were oriented nearly horizontally in a parasagittal plane, approximately parallel to iso-frequency bands (Merzenich and Reid 1974). Spikes from single units were amplified and isolated, and spike times were measured with 1-s resolution and stored in a computer file for analysis and display. Histological processing for reconstruction of the electrode tracks was performed for six cats, selecting the animals that yielded a large amount of physiological data. Specifically, alternate parasagittal sections of the IC were either Nissl-stained or immunostained for calretinin to visualize putative projections from the MSO (Adams 1995). Staining for calretinin is thought to reveal terminals of MSO axons because MSO is the only auditory structure projecting to the IC in which calretinin labeling is extensive, and inputs to the IC from MSO are confined to the same region of the central nucleus in which calretinin labeling is found (Henkel and Spangler 1983). All reconstructed electrode tracks traversed the central nucleus of the IC, and about one-third penetrated the calretinin-positive region.
Synthesis of VS stimuli Virtual-space stimuli were synthesized in essentially the same manner as in our previous study (Delgutte et al. 1999). Brief (30-s) clicks were processed through digital filters constructed from HRTFs measured in one cat by Musicant et al. (1990). These HRTFs represent the directionally dependent transformations of sound pressure from a specific location in free field to the ear canal and contain three localization cues: ITD, ILD, and spectral features. The HRTF measurements of Musicant et al. (1990) are only valid for frequencies above 2 kHz because their anechoic room was too small to absorb reflections at lower frequencies. Because several studies of neural correlates of the PE focused on low-frequency, ITD-sensitive neurons (e.g., Fitzpatrick et al. 1995; Yin 1994), we used a model to extend the HRTFs to frequencies below 2 kHz. Specifically, model HRTFs were the product of two components: 1) a directional component representing acoustic scattering by the cat’s head was provided by a rigid-sphere model (Morse and Ingard 1968, p. 418 – 422); 2) a nondirectional, frequency-dependent gain representing the sound pressure amplification by the external ear was derived from measurements of acoustic impedance in the cat ear canal J Neurophysiol • VOL
[the “mean-square pressure ratio” shown in Fig. 14 of Rosowski et al. (1988)]. The radius of the spherical head model, as well as the ear coordinates along the sphere were adjusted by a least-squares algorithm to minimize the difference between model HRTFs and measured HRTFs for frequencies between 1,800 and 2,500 Hz. This optimization gave anatomically reasonable values for the head diameter (6.8 cm) and ear coordinates (120° azimuth, 30° elevation). Model and measured HRTFs deviated by ⬍10% on average between 1,800 and 2,500 Hz. We then joined the model HRTF for frequencies below 2 kHz with the measured HRTF above 2 kHz to obtain an HRTF covering the 0- to 40-kHz range. A frequency-dependent weighting function was used to smooth the seam between the two curves. PE stimuli consist of two clicks, each processed through a pair of HRTFs appropriate for its direction. Figure 1A shows an example in which the lead and lag are presented from 45° to the right and left, respectively. The lag is delayed relative to the lead by 5 ms, simulating a reflection from a wall relatively close to the source.
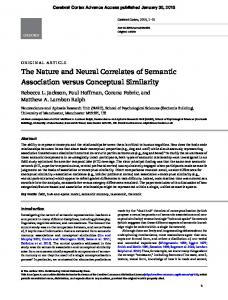
Manipulation of localization cues for VS stimuli VS stimuli synthesized from HRTFs measured in free field contain ILD, ITD, and spectral cues, and are referred to as full-cue. To study neural sensitivity to individual localization cues, we also synthesized partial-cue VS stimuli in which one or two cues were held constant for all azimuths, while the remaining cue(s) varied with azimuth as in free field. Methods for synthesizing partial-cue stimuli are described in detail in the APPENDIX. Table 1 lists which cues are varied and which ones are held constant for each partial-cue condition. Figure 2 shows waveforms and power spectra of full-cue and partial-cue stimuli for an azimuth of 27° to the right. The 0T stimuli (Fig. 2B) were synthesized by temporally aligning the waveforms of the full-cue stimuli at the two ears so as to zero the ITD. The ⌬T stimuli (Fig. 2C) were synthesized by delaying a reference waveform (defined in the APPENDIX) having no ITD by the appropriate ITD for each azimuth. The ⌬L stimuli (Fig. 2D) were synthesized by introducing the appropriate ILD for each azimuth onto a reference stimulus having no significant ILD. The ⌬S stimuli (Fig. 2E) were created to have no significant ITD or ILD, but the same spectral features (peaks and notches) as the full-cue stimuli for each azimuth. Finally, the 0L stimuli (not shown) were synthesized by adjusting the amplitudes of the full-cue stimuli so that their sound pressure level in each ear always matched that for 0° azimuth.
Procedure Search stimuli consisted of broadband noise bursts. Once a single unit was isolated, its frequency tuning curve was measured by an automatic tracking procedure (Kiang and Moxon 1974) to determine the characteristic frequency (CF), and its sensitivity to ITD assessed with binaural beats (Kuwada et al. 1979). A rate-level function was then measured for the VS click stimulus at 45° azimuth contralateral to the recording site, from which a sound level was chosen (approximately 10 –20 dB above threshold) for subsequent stimuli. Responses to VS clicks were then studied as a function of azimuth, using 30 stimulus presentations for each location. Azimuths were presented in TABLE
1. Localization cues in partial-cue VS stimuli
VS Stimulus
ITD
ILD
Spectral Shape
Full Cue 0T ⌬T ⌬L ⌬S 0L
Varied Constant Varied Constant Constant Varied
Varied Varied Constant Varied Constant Constant
Varied Varied Constant Constant Varied Varied
87 • FEBRUARY 2002 •
www.jn.org
LOCALIZATION CUES AND PRECEDENCE IN THE IC
979
FIG. 2. The waveforms and spectra of impulse responses in both ear canals are shown for a sound source at 27° azimuth. Left ear is shown in thick lines and right ear in thin lines. On top is the full cue, or “natural” head-related transfer function (HRTF) containing interaural time delay (ITD), interaural differences in level (ILD), and spectrum. Below are the various cases in which some cues were held constant while others were manipulated (see Table 1 and APPENDIX for details).
random order from ⫺90 to ⫹90°, in either 9 or 18° steps. All stimulus levels are specified as the sound pressure level (SPL) that a free-field stimulus would have at the center of the cat’s head in the absence of the animal. Positive azimuths denote the hemifield contralateral to the recording site. Responses to PE stimuli were measured as a function of delay for lead and lag sources both positioned at ⫹45° (in the contralateral hemifield); in rare cases when the neuron did not respond to clicks at ⫹45°, PE responses were obtained at 0° (front). PE stimuli consisted of pairs of VS clicks with delays ranging logarithmically from 1 to 100 ms, presented in random order, with 30 repetitions at every delay. The half-maximal delay was defined as the delay for which suppression of the lagging response reached 50% of the unsuppressed response (e.g., Litovsky and Yin 1998a). Figure 1, B and C, shows measurements made from one neuron, with a half-maximal delay of 32 ms. Once the half-maximal delay was determined, a suppressive azimuth function (SAF) was measured by holding the lagging click at a location that produced a robust response (usually ⫹45°), and varying the lead azimuth from ⫺90 to ⫹90° in 18° steps. The SAF was initially measured for a delay near the half-maximal delay. When time permitted, it was repeated at longer and shorter delays, where suppression was weaker and stronger, respectively. Whenever possible, the SAF was also measured under conditions in which the sound localization cues contained in the HRTFs were manipulated such that some cues were held constant while others varied with azimuth as in free field. The purpose of these manipulations was to determine, for each neuron, which cue or combination of J Neurophysiol • VOL
cues are most potent in determining the directional sensitivity for the leading sound, and whether the same cues also determine the directionality of lag suppression. While the directional sensitivity to the brief leading click depends primarily on the immediate interplay of excitation and inhibition (Carney and Yin 1989), the directionality of suppression is likely to depend on long-lasting inhibitory inputs that may shape a neuron’s sensitivity to directional information contained in reflections.
Data analysis For rate-azimuth functions, the number of spikes was counted over a time window encompassing the entire response to the click, and azimuthal functions were smoothed by three-point triangular filters. For click-pair stimuli, spike counts were determined over separate time windows for the lead and lag responses. These windows (usually 4 –5 ms in duration) were set semi-automatically for each condition based on the discharge latency, inter-click delay, and response duration. For delays shorter than the window width, the leading and lagging responses overlapped in time. In this case, the lag response was computed by subtracting the mean lead response at long delays (where there was no overlap) from the spike count in a wide window encompassing responses to both the lead and the lag (Litovsky and Yin 1998a). This procedure assumes that the lead response does not vary with delay.
87 • FEBRUARY 2002 •
www.jn.org
980
R. Y. LITOVSKY AND B. DELGUTTE
RESULTS
Data shown here are taken from a total of 63 single units in 10 cats. These units were contacted for a sufficient period of time to thoroughly characterize the directional dependence of suppression. Unit CFs ranged from 800 Hz to 25 kHz; about one-third of the CFs were below 2,000 Hz, and another third above 6,000 Hz. This section first shows that nearly all neurons in our sample showed suppression for VS stimuli, and results are compared with those previously obtained in free field. Next the directional dependence of echo suppression is described in detail. Finally, the dependence of lag suppression on individual directional cues is addressed. Nearly all neurons show lag suppression with VS stimuli The example shown in Fig. 1, B and C, is representative of IC responses to lead-lag click pairs both located at ⫹45° as a function of delay between the two stimuli. Temporal discharge patterns (Fig. 1B) of this neuron show strong responses to both stimuli at long delays and suppressed responses to the lagging click at shorter delays. Figure 1C shows mean spike counts in response to both lead and lag as a function of delay. As expected, the lead response is nearly constant, and the lag response approaches this value for long delays, showing complete recovery from suppression. The half-maximal delay, at which the lag response recovers to 50% of the unsuppressed response, is 32 ms. A vast majority of our neurons (98%) showed a suppressed response at short delays, and we observed large variability in half-maximal delays across the population. Previous measurements of half-maximal delays in anesthetized cats have been reported for both dichotic headphone measurements and anechoic free field stimulation (Litovsky and Yin 1998a; Yin 1994). To validate the use of VS stimuli for physiological studies of the PE, population measures of half-maximal delays obtained in the present study were compared with the Litovsky and Yin (1998a) free-field results (Fig. 3). Responses in both populations are based on conditions in which lead and lag stimuli were positioned at azimuthal locations that produced strong responses. The median half-maximal delay is somewhat lower for VS stimuli (19 ms) than in free field (35 ms), but the range is similar in both conditions (4 –100 and 3– 62 ms for VS and free field, respectively). A 2 test revealed a statistically significant difference between the two distributions [2(13) ⫽ 29.48, P ⬍ 0.006], confirming that, in the populations of cells studied, suppression lasted somewhat longer in free field than with VS stimuli. Suppression of the lag response depends on lead location The SAF represents the neural response to a lagging stimulus positioned at a highly excitatory location (usually in the contralateral hemifield) as a function of the azimuth of the leading stimulus (Fig. 4A). For many units, measurements were obtained at delays equal to, above, and below the half-maximal delay. Figure 4B shows temporal discharge patterns for one neuron at delays of 10 and 35 ms, with the lag stimulus held at ⫹45°. The directional sensitivity of the lead response is noticeable in the left-hand portion of each panel, where responses are robust at contralateral azimuths and minimal at ipsilateral azimuths. The lag responses in the right-hand portions of each panel show directionally dependent suppression for the 10-ms J Neurophysiol • VOL
FIG. 3. Population histograms of half-maximum delays are shown for freefield data from Litovsky and Yin (1998a) (top) and using virtual space stimuli from the present study (bottom). For all neurons, both leading and lagging stimuli were at “preferred” locations. Black bars at the edges indicate number of units for which responses were not measurable if there was either no suppression (left-most bars) or if the lag response never reached 50% of the maximum response at the longest delay tested.
delay, and only weak suppression in the 35-ms case. Suppression is accompanied by an increase in response latency for the lag that, although hard to see in the figure, is very consistent in our data. Figure 4C shows mean spike counts for both the lead and the lag at four different delays. If there were no suppression, the lag response would always equal the lead response at ⫹45°. Reduction in the lag response below this value indicates suppression resulting from the presence of the lead. The dependence of suppression on delay observed in Fig. 1 is also apparent here, in that the lag response diminishes with decreasing delay for every azimuth. For this neuron, suppression is strongest when the lead response is maximal, and weak or absent when the lead response is minimal. Nevertheless, for short delays, suppression can occur even when the lead produces no spike discharges (i.e., ⫺30 to ⫺60° at delays of 5 and 10 ms). This shows that suppression is not merely due to refractoriness, which would prevent the neuron from firing once it has already fired. Rather, it suggests that suppression depends on a more complex mechanism such as long-lasting inhibition (Yin 1994). Directionality of lag suppression and its relation to lead response For the neuron in Fig. 4, both lead and lag response curves are strongly modulated as a function of azimuth for short delays. Moreover, there is a relationship between response to the lead and suppression of the lag response in that suppression
87 • FEBRUARY 2002 •
www.jn.org
LOCALIZATION CUES AND PRECEDENCE IN THE IC
FIG. 4. Example of the suppressive azimuth function (SAF) measurement from one neuron [characteristic frequency (CF) 1.9 kHz]. A: the location of the lead stimulus is varied in azimuth between ⫺90 and ⫹90°, while the location of the lag is held constant at a location that elicits a robust response in the neuron. Dot rasters at delays of 10 and 35 ms are shown in B (left and right, respectively). C: mean number of spikes per stimulus are shown for the lead (dashed lines) and lag (solid symbols) responses.
is maximal when the lead response is largest. While this type of relationship between excitatory lead response and suppression was quite common, several others were seen as well. Figure 5 shows examples from five response types observed in the population; methods used to quantitatively determine these categories are described in relation to Fig. 6. The neuron in Fig. 5A shows the same pattern as in Fig. 4, with directionally dependent lead and lag responses, and a strong negative correlation between the two. In Fig. 5B, both lead and lag responses are also highly directional, but there seems to be little or no correlation between the two. In Fig. 5C, lag suppression is highly directional even though the lead response is nearly flat, suggesting that the excitation and the suppression proJ Neurophysiol • VOL
981
duced by the lead may depend on different mechanisms. Figure 5D shows the opposite pattern, where the lead response varies strongly with azimuth while the lag response is not directional. Finally, in Fig. 5E both lead and lag responses are highly directional, but suppression seems to be maximal when the lead response is minimal, the opposite of the pattern seen in Figs. 4 and 5A. While for some neurons the directional patterns of excitation and suppression were easily categorized, for others the categorization was less obvious. A quantitative approach to determining these categories was therefore developed. Although somewhat arbitrary, the criteria chosen for this purpose are broadly consistent with previous efforts to categorize directional sensitivity of auditory neurons (Aitkin et al. 1984; Delgutte et al. 1999; Imig et al. 1990; Rajan et al. 1990). The categorization scheme was applied to SAFs measured with delays close to or slightly less than the half-maximum delay to ensure that there would be significant, but not complete, suppression. The categorization involved two steps. First, we calculated a directional modulation index (MI), which measures the normalized difference between the maximal and minimal responses MI ⫽ (Rmax ⫺ Rmin)/Rmax, for the lead and lag separately. The distributions of lead and lag MI within the neural population are shown in Fig. 6, A and B, respectively, while Fig. 6C shows a scatter plot of lag MI against lead MI. Responses were considered to be directional if the MI exceeded 0.6. This criterion was met for both lead and lag in a large fraction of units (e.g., Figs. 5, A, B, and E, and 6D). These responses are referred to as MM to indicate the directional modulation of both lead and lag responses. For other units, the lead MI was low but the lag MI was high (e.g., Fig. 5C), while for others the reverse was true (e.g., Fig. 5D). These response types, which are referred to as MU and UM, respectively, point to a partial dissociation between the mechanisms that mediate the directional response to the lead and the directionality of suppression. The obvious remaining type, UU, was rarely observed and is not illustrated. The second step in the classification applied only to MM units. Specifically, we determined whether the directionality of suppression was similar (MMs; e.g., Figs. 4 and 5A) or dissimilar (MMd; e.g., Fig. 5, B and E) to that of the excitatory lead response. To measure similarity, a prediction of the lag response from the lead response was obtained by first carrying out a linear regression of the lag response on the lead response (Fig. 6E), then using the fitted line to compute the predicted lag response for each azimuth (Fig. 6D, solid line). A correlation coefficient R was then computed across all azimuths between the lead response and the lag response to measure the similarity between the directionality of suppression and that of the lead response. A strongly negative correlation (R2 ⬎ 1/2, with R ⬍ 0) indicates that the directional dependence of suppression is similar to that of the excitatory lead response.1 On the other hand, a small correlation coefficient (R2 ⬍ 1/2) indicates that the directionality of the lead response does not resemble that of lag suppression. For example, in Fig. 6D the predicted re1 Note that a negative correlation between lead and lag responses implies a positive correlation between lead response and suppression, which is inversely related to the lag response.
87 • FEBRUARY 2002 •
www.jn.org
982
R. Y. LITOVSKY AND B. DELGUTTE
FIG. 5. Examples of IC neurons falling into each of the 5 most common response types. Numbers in parentheses indicate the delay at which measurements were obtained for each neuron. A: both lead and lag responses are modulated with direction, the lag is well predicted from the lead, and the correlation is negative. B: both lead and lag responses are modulated, but the lag is poorly predicted from the lead. C: the lead response is not modulated with direction, but the lag is. D: the lead response is modulated with source direction, but the lag is not. E: both lead and lag responses are modulated with direction, the lag is well predicted from the lead, and the correlation is positive (opposite from A).
sponse is very close to the actual lag response, with R2 ⫽ 0.91, suggesting that suppression is closely related to the excitation produced by the lead. A similar pattern holds in Fig. 5A (R2 ⫽ 0.96). On the other hand, in Fig. 5B, the predicted curve is nearly flat, while the actual lag response is strongly directional. This poor prediction is reflected in the very low correlation (R2 ⫽ 0.02). Figure 6F shows a histogram of the lead-lag correlation coefficients for all MM responses. The correlations are either highly negative, slightly positive, or near zero. A strong positive correlation was only found in one neuron. This neuron (shown in Fig. 5E) was placed in the MMd category because, despite the good linear prediction of lag response from lead response, the mechanisms underlying suppression and excitation must be different in this case. While MMs responses are consistent with a suppression mechanism that directly reflects the excitation produced by the lead, for MMd responses, the excitation and the suppression must depend in part on different mechanisms. Figure 6F shows that MMs responses represent a much larger proportion than do MMd responses, and further shows that there are no obvious gaps in the distribution of correlation coefficients. The same point applies to the distributions of modulation indexes in Fig. 6, A and B. In practice, the cutoffs for MI (0.6) and R2 (1/2) were chosen based on our overall impression of reliability and reproducibility of responses to PE stimuli. Thus our response types represent labels for endpoints in a continuum rather than discrete categories. Nevertheless, they do provide a firm basis for quantitatively comparing our results with free-field data and for characterizing how these patterns are altered by manipulating directional cues. J Neurophysiol • VOL
Comparison of response types between VS and free field Data from the present study using VS stimuli were compared with the free-field data of Litovsky and Yin (1998b), which were reanalyzed and categorized using the present scheme. Figure 7A shows the proportions of units falling into each category for the VS and free-field data. In free field as in VS, MMs responses are the largest group, forming one-third to one-half of the population. This group is followed by MMd and the partly or fully unmodulated response types. Although there appears to be more MM responses in free field than in VS, the difference between the two distributions did not quite reach statistically significance [2(4) ⫽ 9.05, P ⫽ 0.06]. The overall similarity between the VS and free-field populations suggests that our virtual simulation of a free-field environment was sufficiently accurate for studying the directionality of suppression. The next topic is thus focused on the effect of manipulating specific localization cues in VS stimuli on the directionality of suppression in IC neurons. Figure 7B shows that, for the VS data, there appears to be no obvious relationship between response type and CF (Fig. 7B). Statistical analysis confirmed that there was no significant difference in the distribution of response types for CFs above and below 2,000 Hz [2(4) ⫽ 4.00, P ⫽ 0.41]. This result is interesting, given that sound localization is thought to depend on different cues at low and high frequencies. Effects of individual localization cues Sound localization depends on a combination of directional cues such as ITD, ILD, and spectral features. Here we are interested in understanding which of these cues are most potent
87 • FEBRUARY 2002 •
www.jn.org
LOCALIZATION CUES AND PRECEDENCE IN THE IC
983
FIG. 6. Categorization of suppression types in the IC population. Modulation index (MI) provides a measure of the normalized difference between the maximal and minimal neural responses for the lead response (A), and the lag response (B). C: lag MI is plotted against lead MI, to delineate between MM, MU, UM, and UU. D and E illustrate the prediction method. In D the measured lead and lag responses are shown (‚ and ●, respectively), and in E the lag response is plotted as a function of the lead response. The regression line is then used to characterize how well the directional pattern of lag suppression can be accounted for by variation in the lead response. The predicted lag response is shown against azimuth in D (solid line). The MM population includes 2 units types: units with a strongly negative lead-lag correlation (MMs), and those for which the correlation is either low or strongly positive (MMd). Finally in F the number of units falling into each of the 2 MM categories is shown as a function of correlation R, with the majority of units having a high negative R.
in determining directional responses to the lead as well as the suppression of the lag response. The signal processing approach taken here is similar to that of Delgutte et al. (1995), in which VS stimuli were digitally manipulated so that some cues varied with azimuth as in free field while other were held constant. Similar techniques are used in psychophysics (e.g., Wightman and Kistler 1992). Figure 8 shows an example of the effect of cue manipulations on the responses of a high-CF neuron (16.5 kHz), with measures collected at a delay of 5 ms. In response to the full-cue stimuli (Fig. 8A), both the lead response (filled circles) and the lag response (open circles) are strongly directional, and the two responses show a large negative correlation (MMs). Figure 8, B–D, shows the effects of cue manipulations. When the ITD is set to zero for all azimuths (Fig. 8B), or when only ILD is varied (Fig. 8D), this unit remains MMs. In contrast, when only ITD is varied (Fig. 8D), modulations of both lead and lag responses are lost so that the response becomes UU. Thus when the ILD cue does not vary with azimuth, both lead and lag responses lose their strong dependence on lead aziJ Neurophysiol • VOL
muth, which is observed when ILD varies. For this unit then, ILD is the most potent cue for both excitatory and suppressive responses. Figure 9 shows a different example (CF ⫽ 1.9 kHz) measured at a 20-ms delay, in which the cues mediating excitation and suppression appear to be distinct. Responses in the full-cue condition (Fig. 9A) were again of the MMs type. When only ITD varied with azimuth (Fig. 9C), the response resembled that in the full-cue condition, preserving its MMs type. However, holding ITD at 0 while varying ILD and spectrum (Fig. 9B) greatly reduced the directionality of the lead response but not that of the lag response (UM type). For this unit, then, directionality of the excitatory lead response depends primarily on ITD, but suppression is mediated by a combination of ITD, ILD, and spectrum. A third and final example is shown in Fig. 10 (CF ⫽ 10.7 kHz) studied at a delay of 8 ms. For this unit, either setting the ITD to zero (Fig. 10B) or varying ILD only (Fig. 10E) did not strongly alter the directional responses to either lead or lag. In contrast, varying only ITD (Fig. 10D), or spectral cues (Fig. 10C) had more dramatic effects on the
87 • FEBRUARY 2002 •
www.jn.org
984
R. Y. LITOVSKY AND B. DELGUTTE
FIG. 7. A: the proportion of units falling into each of categories are shown for the free data of Litovsky and Yin (1998a) and the data obtained in the present study using virtual space (VS) stimuli. B: for the VS data, the characteristic frequency of each unit is plotted as a function of unit type.
directionality of responses, particularly for the lead. Thus while the ILD cue appears to play an important role for this unit, the relative potency of the different cues is hard to determine, possibly because the trough in the suppression curve is not aligned with specific features in the excitation curve.
Similar manipulations of directional cues were conducted for 51 neurons. Each panel in Fig. 11 compares the distribution of unit types (based on the categorization of Fig. 6) in one partial-cue condition and the full-cue condition for the same neurons. The ⌬L and 0T manipulations had only weak effects on the type distribution, while the ⌬T and ⌬S/0L manipulations had stronger effects, producing a major drop in the fraction of MMs units, with a corresponding increase in the UU and UM categories. These observations are confirmed by the statistical analyses (2 tests) of Table 2, which shows significant effects for the ⌬T and ⌬S/0L manipulations, and no effect for ⌬L or 0T. Thus for the population as a whole, the relations between the directional sensitivity of excitation and that of suppression, which have been observed for both free-field and VS stimuli, seem to depend more on interaural level cues than on either interaural time or spectral cues. There are nevertheless several examples of individual units that do show a strong effect of ITD, particularly for low CFs. A quantitative analysis was developed to rigorously ascertain to what extent the directionalities of the lead and lag responses depend on the same or different localization cues for each unit. Using linear regression analyses to predict the lag response from the lead response (as in Fig. 6E), two different models were tested for each unit. In the joint model, the regression coefficients (slope and intercept) were constrained to be identical for every full-cue and partial-cue condition, whereas in the separate model different coefficients were used to predict the lag response in each full-cue and partial-cue condition. Predictions of the separate model are guaranteed to be at least as good as those of the joint model because of the larger number of free parameters in the separate model. Thus the two models were quantitatively compared using an F-test for the ratio of the variances in the residuals (the difference between predicted and actual lag responses). If the residuals variances do not significantly
FIG. 8. Responses of one IC neuron (CF ⫽ 16.5 kHz) to VS stimuli in which the directional cues were manipulated. In all cases the lag stimulus was full cue and the delay was 5 ms. Lead responses are shown by closed circles, and lag responses by open circles. Spikes per stimulus are plotted as a function of the leading source azimuth. A: responses to the normal full-cue stimulus. B: the leading source varied in ILD and spectrum, but the ITD was set to 0 at all azimuths. C: only ILD is varied. D: only ITD is varied.
J Neurophysiol • VOL
87 • FEBRUARY 2002 •
www.jn.org
LOCALIZATION CUES AND PRECEDENCE IN THE IC
985
similar directionalities for every cue condition, the joint (R2 ⫽ 0.92) and separate (R2 ⫽ 0.93) models were equally effective in predicting the lag responses from the lead [F(54,59) ⫽ 0.90, P ⫽ 0.687]. Finally, for the unit in Fig. 10, neither model was particularly successful at predicting the lag responses from the lead (R2 ⬵ 0.65), and statistical analysis gives no evidence for decoupling in this case [F(45,50) ⫽ 1.02, P ⫽ 0.952]. In this case, the very fact that the separate model is only moderately successful indicates that the neural mechanisms underlying excitation and suppression differ in their directionality. Figure 12 shows the ratio of the residuals variance for the joint model to the residuals variance for the separate model plotted against CF for all 36 neurons in which this analysis was performed. The ratio is significantly below unity for about one-third of the data points (filled circles), indicating units for which the separate model yielded a better prediction. The remaining two-thirds of units showed no significant difference between the two models, suggesting that lead and lag responses depended on the same localization cues for these neurons. The more effective partial-cue conditions in causing a decoupling of lead and lag responses were ⌬T, ⌬S, and 0L, confirming the dominance of the ILD cue for a majority of units. DISCUSSION
Neural correlates of the precedence effect with VS stimuli
FIG. 9. Responses of one IC neuron (CF ⫽ 1.9 kHz) to VS stimuli in which the directional cues were manipulated. The delay was always 20 ms. A: responses to the normal full-cue stimulus. B: the leading source varied in ILD and spectrum, but the ITD was set to 0 at all azimuths. C: only ITD is varied.
differ for the two models, this means that the directionalities of lead excitation and lag suppression depend on the same localization cues. On the other hand, if the residuals variance of the joint model is significantly greater than that of the separate model (i.e., if the joint model gives a poorer prediction of lag responses), this suggests that lead excitation and lag suppression depend at least partly on different cues. Figures 8 –10, in addition to showing the measured responses to lead and lag, also show predictions from the joint (dotted line) and separate (solid line) models. For example, in Fig. 9, the response to the full-cue stimulus is MMs, while responses to the 0T stimuli shows significant directionality for the lag but not the lead (UM). For this unit, the separate model, with R2 ⫽ 0.93, gave a significantly better prediction of lag responses than did the joint model, with R2 ⫽ 0.74 [F(36,42) ⫽ 0.31, P ⬍ 0.001], suggesting a decoupling between the cues that are important for excitation and suppression. In contrast, for the unit of Fig. 8, in which the excitation and the suppression produced by the lead had J Neurophysiol • VOL
We used a virtual acoustic space to study responses of IC neurons to precedence-like stimuli by filtering click stimuli through HRTFs of a cat. Specifically, we studied the directional dependence of the suppression that was previously reported both in free field (Litovsky and Yin 1998b; Yin 1994) and under headphones (Fitzpatrick et al. 1995). Using a novel approach of selectively manipulating some of the directional cues present in the HRTFs (Delgutte et al. 1995), we tested whether the directional response to the lead and the suppression produced by the lead are sensitive to the same or different cues. Nearly all cells showed suppression of the lagging response, with increasing suppression as the delays are shortened. The relationship between lead and lag responses, and their relative dependence on the lead’s direction, varied widely within the population. The most common response type was when both lead and lag responses were highly directional, with the directionality of suppression similar to that of the excitatory lead response. In other words, for the majority of cells the suppression appeared to be directly related to the excitation in its directionality. For these cells, we observed two different behaviors when the directional cues were manipulated. In the first (about 2⁄3), the same cues appeared to be important for the directionality of both lead and lag responses, whereas for one-third of cells the lead and lag responses showed a decoupling in cue sensitivity. We also found units for which the lag suppression was highly directional although the lead response was not, or for which both responses were directional, but showed no obvious relationships. These response types suggest different neural mechanisms underlying the directionality of the excitatory lead response and that of suppression.
87 • FEBRUARY 2002 •
www.jn.org
986
R. Y. LITOVSKY AND B. DELGUTTE
FIG. 10. Similar to Figs. 8 and 9, responses of one IC neuron (CF, 10.7 kHz) to VS stimuli in which the directional cues were manipulated are shown. The delay was set to 8 ms. A: responses to the full-cue stimulus. B: the leading source ITD was set to zero for all azimuths. C: only spectrum is varied. D: only ITD is varied. E: only level is varied.
This work has several limitations, including the use of nonindividualized HRTFs, the choice of low-to-moderate sound levels, and the fact that our animals were deeply anes-
thetized. These issues are discussed in the following text, where data from this study are compared with previous work in free field and with dichotic stimulation.
FIG. 11. Categorization of suppression types in the IC population of neurons studied with cue manipulations. The populations of neurons in which each manipulation was conducted are not exactly the same, although there is substantial overlap. For each set of neurons studied then, the proportions of neurons falling into each category is shown (number of neurons are shown at top right of each graph).
J Neurophysiol • VOL
87 • FEBRUARY 2002 •
www.jn.org
LOCALIZATION CUES AND PRECEDENCE IN THE IC
2. Comparison of response type distributions for full cue and partial cue stimuli
TABLE
Partial-Cue Condition
2(4)
P
N
0T ⌬T ⌬L ⌬S/0L
2.50 12.59 5.79 11.97
0.78 0.014* 0.22 0.018*
51 44 34 36
* Statistically significant difference.
Azimuth sensitivity of IC neurons Although a number of studies have examined spatial receptive fields of IC neurons in free field, most to date have only reported responses to tone or noise stimuli, whereas relatively little is known about responses to click stimuli such as those used in the present study. Our results are broadly consistent with those of Litovsky and Yin (1998a), considering sample sizes, variability, and differences in unit selection criteria. In both studies, the vast majority of directional neurons had their best azimuths in the contralateral hemifield. In addition, comparing the present results with our previous data for broadband noise (Delgutte et al. 1999), which used the same HRTFs for synthesizing VS stimuli, the proportion of azimuth-sensitive units is high in both cases (85% for clicks and 93% for noise). Here we must also address the issue of the HRTFs themselves and their integrity in representing space as the neurons normally encounter it. Although individualized HRTFs are thought to be necessary for eliciting a realistic impression of sound source location, this issue is most critical for sounds in the median vertical plane, where localization is primarily based on spectral cues. Cat HRTFs tend to be consistent in their directional cues but differ in regard to the exact frequencies of spectral features such as notches, which are most important in elevation (Rice et al. 1992; Xu and Middlebrooks 2000). The extent to which individual HRTFs would be necessary in a study such as ours is not clear. Our study was conducted in the horizontal plane, where localization depends primarily on interaural disparity cues (Wightman and Kistler 1992) and is fairly accurate even with nonindividualized HRTFs (Wenzel et al. 1993). Moreover, two-thirds of our neurons had CFs below 6 kHz, a region in which inter-cat variability in HRTFs is relatively small (Musicant et al. 1990; Rice et al. 1992). On the other hand, using nonindividual HRTFs may not be ideal for teasing apart the relative effects of interaural and spectral cues. Thus conclusions must be reserved until a study determines the extent to which using individualized HRTFs is important for understanding binaural mechanisms in cats.
987
suppression at long delays. Also in agreement among studies is the large variability in the time course of suppression, with the half-maximal delay ranging from a few milliseconds to tens of milliseconds and, in a few cases, to over 100 ms (Fitzpatrick et al. 1995; Litovsky and Yin 1998a; Yin 1994). In general, the distribution of half-maximal delays in the present study is broadly consistent with previous reports from the IC of anesthetized cats (Litovsky and Yin 1998a; Yin 1994). Our median half-maximal delay of 19 ms is very close to the 20 ms found by Yin (1994), but somewhat lower than the 35 ms in the Litovsky and Yin (1998a) study. Although the latter difference did reach statistical significance, such differences are not unexpected considering the moderate sample sizes and the large variability among IC neurons. For example, because we use a posterior approach to the IC, we may oversample the posterior region, where neurons tend to have high best modulation frequencies in response to amplitude-modulated (AM) tones (Schreiner and Langner 1988). One might expect that the long-lasting inhibition thought to be responsible for echo suppression (Yin 1994) might also degrade a neuron’s ability to track rapid AM. If so, by oversampling the posterior region, we might introduce a bias toward neurons with relatively brief half-maximum delays. In any case, the differences among the studies from anesthetized animals are relatively minor. A more striking difference in the time course of suppression emerges when studies using anesthetized preparations (including the present one) are compared with studies in awake rabbits, owls and cats, where half-maximal delays average ⬍10 ms (Fitzpatrick et al. 1995; Keller and Takahashi 1996; Keller et al. 1998; Tollin et al. 2001). Tollin’s recent cat data suggest that the long half-maximal delays observed in previous cat studies were most likely due to effects of barbiturates, which are known to enhance GABAergic inhibition in the CNS (Barker and Ransome 1978) and have been shown to specifically enhance inhibition in some IC neurons (Kuwada et al. 1989). The urethan anesthesia used here seems to result in enhancement of inhibition similar to that observed with barbiturates. Thus one has to be careful when giving functional interpretation to our data from anesthetized animals. In both awake and anesthetized animals, there is a great deal
Time course of suppression A common metric for the strength of echo suppression is the half-maximal delay, where the lag response recovers to half of the spike rate observed in absence of suppression. This metric has been used in both physiological (Fitzpatrick et al. 1995; Litovsky and Yin 1998b; Yin 1994) and psychophysical (Freyman et al. 1991; Litovsky and Shinn-Cunningham 2001; Yang and Grantham 1997; see Litovsky et al. 1999 for review) studies of the PE. Our results concur with those of previous studies in that, with few exceptions, IC neurons show strong suppression of the lagging response at short delays and no J Neurophysiol • VOL
FIG. 12. For each unit the ratio of prediction residuals of the separate and joint models is plotted as a function of unit CF. Units with statistically significant differences are shown in closed symbols, and units with non significant differences are shown in open symbols.
87 • FEBRUARY 2002 •
www.jn.org
988
R. Y. LITOVSKY AND B. DELGUTTE
of variability among IC neurons in the time course of suppression, even though the time courses are relatively short for awake preparations compared with an anesthetized one. The source and functional importance of this variability are poorly understood, although, like any other physiological mechanism, a broad range of options may best represent the task-dependent demands made on the sensory system. Psychophysical measurements in human listeners indicate major task-dependent variability, which may require a broad range of suppression delays. For instance, short recovery may serve to obtain information regarding the presence of an echo, while long recovery may be important for suppressing information regarding the location of echoes (for review, see Blauert 1997; Litovsky et al. 1999). Nevertheless, the psychophysical echo threshold (the delay for which fusion just breaks down) is clearly in the 5- to 8-ms range for clicks, a much narrower range than that of half-maximal delays in IC neurons. Yin (1994) has suggested that psychophysical echo threshold might be based on the neurons with the shortest-lasting suppression, much as detection of pure-tone stimuli is thought to depend on the neurons with the lowest thresholds (Delgutte 1990; Jiang et al. 1997; Kiang et al. 1965). However, the comparison between detection and echo threshold may not be appropriate because the lagging sound is always clearly detectable, even for delays below echo threshold, and contributes to the timbre and spatial extent of the percept. A more promising approach would be to derive the echo threshold from localization judgments by assessing whether there is sufficient information in the responses to both the lead and the lag to ascribe a definite location to each stimulus individually, as suggested by Valenzuela and Hafter (2000). Doing so would require an objective method for estimating the direction of sound sources from the responses of the neural population; for example, using neuromimetic pattern classifiers as Middlebrooks and his colleagues did in the auditory cortex (Mickey and Middlebrooks 2001; Middlebrooks et al. 1994). Until such an objective method is implemented and shown to be effective, there will be no satisfactory neurally based explanation for echo threshold, and therefore no completely convincing neural correlate of fusion in the precedence effect. Directional dependence of suppression As the excitatory response to the lead, suppression of the lagging response was found to depend strongly on lead azimuth for a clear majority of IC neurons. Specifically, 65% of our neurons showed at least 60% directional modulation of the lag response for delays near the half-maximal delay. The fact that both lead and lag responses tend to be directional when lead azimuth is varied suggests a possible relationship between the two phenomena. To get at this issue, we quantitatively characterized the relationship between the directional excitation produced by the lead and the suppression of the lag response and identified five different patterns (Fig. 7). While the method for determining the exact categories was somewhat arbitrary, it was intended to delineate the general types of responses and enable direct comparison with both previous reports and conditions in which localization cues were selectively manipulated. In over one-half of the neurons, both lead and lag responses were modulated along the azimuthal dimension, with clear areas of maximal and minimal responses. In most of these J Neurophysiol • VOL
neurons, there was an approximately linear relationship between the lead and lag responses (MMs), suggesting that excitation and suppression are tightly coupled and may involve synaptic inputs having the same directionality. However, in a minority of neurons (MMd), the lag response was not obviously predictable from the lead response, suggesting that a more complicated array of inputs may be responsible for the excitation and suppression. Finally, for some neurons, modulation along azimuth was only observed for either the lead response (MU) or the lag response (UM), suggesting major differences between the inputs that mediate these two responses. These various response types may all be functionally important, for they can account for numerous scenarios that an organism may encounter in its spatial environment (see the discussion below). Comparing our VS data with the previous free-field study of Litovsky and Yin (1998b) revealed no statistically significant differences in the distribution of the response types, although our data included somewhat fewer MM responses and more MU response. In the Litovsky and Yin (1998b) study, there was an emphasis on studying neurons that showed azimuthal sensitivity to source direction in the first place, while, in the present study we did not select neurons in advance depending on azimuthal sensitivity, so that the VS data may be more representative of the IC population as a whole. Possible differences in which regions of the IC were most densely sampled may also play a role. Our results are more difficult to compare with the Fitzpatrick et al. (1995) data from the awake rabbit, in part because this dichotic study only varied ITD, while our VS stimuli included multiple, co-varying localization cues. Our results with cue manipulations suggest that, overall, ILD is more important than ITD in determining the directional sensitivity of IC neurons. Moreover, Fitzpatrick et al. only placed the lead at two different ITDs (the best and the worst), and therefore cannot provide a complete picture of the directional dependence of suppression. Despite these difficulties, there does seem to be clear differences between the two studies in how the directional dependence of suppression relates to that of lead excitation. Fitzpatrick et al. divide their population of IC neurons into two roughly equal-sized groups depending on whether suppression lasts longer when the lead is placed at the best ITD than when placed at the worst ITD. In contrast, in our data, there was more suppression when the lead was placed at the best azimuth than when placed at the worst azimuth for 78% of our neurons, while only 5/74 (7%) neurons showed the opposite pattern (the remaining 15% of neurons showed similar suppression for both conditions). The five neurons that showed more suppression when the lead was at the worst azimuth included three MMd and two UM units, confirming that using only two lead locations does not completely describe how the directionality of suppression is related to that of excitation. In any case, these proportions are very similar to those found by Litovsky and Yin (1998b) in their free-field study, but clearly different from the 50 –50 proportion of the Fitzpatrick et al. (1995) study. Again, anesthesia is likely to be a factor underlying these differences, although species differences and sampling bias cannot be ruled out, and the fact that Fitzpatrick et al. varied only ITD while both the free-field and VS studies included multiple cues should be kept in mind. Clearly, a detailed study of the directional dependence of suppression in awake animals
87 • FEBRUARY 2002 •
www.jn.org
LOCALIZATION CUES AND PRECEDENCE IN THE IC
is needed. At the very least, the present study introduces techniques for quantitatively characterizing the directional dependence of suppression that can be used in awake as well as anesthetized preparations. Neural mechanisms underlying suppression Previous studies of neural correlates of the PE in the IC (Fitzpatrick et al. 1995; Litovsky and Yin 1998a,b; Yin 1994) have suggested that inhibition from the dorsal nucleus of the lateral lemniscus (DNLL) is the most likely mechanism underlying suppression of the lag response. Although a form of suppression is observed in almost every auditory neuron from the auditory nerve to the auditory cortex (Fitzpatrick et al. 1999), indirect arguments suggest that much of the suppression observed in the IC occurs via inhibitory inputs to the IC. The following statements summarize these arguments. 1) Suppression observed in the auditory nerve and cochlear nucleus is too brief and too weak to significantly contribute to suppression in the IC (Fitzpatrick et al. 1999; Parham et al. 1996; Wickesberg 1996). 2) Most known inhibitory inputs to the superior olivary complex (SOC) are monaural, whereas suppression observed in the IC is strongly directional (Litovsky and Yin 1998b) and depends on binaural cues such as ITD and ILD (Fitzpatrick et al. 1995; Yin 1994; present study). 3) Any suppression mechanism that would require IC neurons to discharge (such as refractoriness or recurrent inhibition) can be ruled out because suppression is often observed even when the lead evokes no spike discharges (Yin 1994). UM neurons, in which suppression is directional despite a nearly constant response to the lead also argue against this possibility. On the other hand, projections from DNLL meet all the requirements to account for suppression in the IC. 1) Projections from both the ipsilateral and contralateral DNLL are thought to be largely GABAergic and therefore inhibitory (Adams and Mugnaini 1984; Shneiderman et al. 1988; Yang and Pollak 1998). 2) Most DNNL neurons are sensitive to binaural cues such as ITD and ILD (Brugge et al. 1970; Kelly et al. 1998; Markovitz and Pollak 1994), consistent with the directionally dependent suppression found in the IC. 3) DNLL appears to project to all regions of the IC (Shneiderman et al. 1988), consistent with our finding that the characteristics of suppression in the IC do not depend much on CF (Fig. 7). 4) Inactivation of the DNLL by excitatory amino acid receptor antagonists alters binaural properties of most IC neurons (Kidd and Kelly 1996; Li and Kelly 1992) and specifically reduces the duration of inhibition produced by stimulation of the ipsilateral ear (Kelly and Kidd 2000). The hypothesis that inhibitory inputs to the IC play a major role in echo suppression is also consistent with the observation of multiple waves of inhibition, some long-lasting, in intracellular recordings from IC neurons (Covey et al. 1996; Kuwada et al. 1997). Although the preceding arguments suggest that inhibition from DNLL is a likely substrate for echo suppression in the IC, it may not be the only one, and other ascending inhibitory inputs to the IC (Klug et al. 1995, 1999), inhibition in subcollicular nuclei, local inhibitory circuits within the IC, descending inputs from the thalamus and cortex (Yan and Suga 1996), and intrinsic membrane properties of IC neurons (Sivaramakrishnan and Oliver 2001) may also play a role in some cases. Nevertheless, the following discussion adopts the workJ Neurophysiol • VOL
989
ing hypothesis that inhibition from DNLL is the main substrate for echo suppression in IC. Our results show that, for a majority of neurons (those in the MMs class), suppression is highly directional and its directionality is similar to that of the excitatory lead response. This finding suggests that the DNLL neurons mediating suppression may be primarily located in the ipsilateral DNLL and receive inputs from the same types of binaural cells in SOC as do their targets in the IC. On the other hand, for the MMd neurons, suppression is highly directional and is either uncorrelated or inversely correlated with the lead response. Here, the DNNL inputs mediating suppression would have a different directional sensitivity from the inputs mediating the excitatory response to the lead. Moreover, some of these inhibitory inputs might be from the contralateral DNLL (Fitzpatrick et al. 1995). For MU units, the suppression is poorly directional, so that it may not even be mediated by DNLL inputs since most DNNL neurons are sensitive to binaural cues. Finally, for UM neurons, suppression may be mediated by DNLL inputs, but the excitatory response to the lead is poorly directional and may depend primarily on monaural inputs. Thus our results suggest a complex neural circuitry with many variations. Pharmacological studies with inhibitory neurotransmitter antagonists could help in pinpointing these neural circuits. The finding that, in a majority of IC neurons, long-lasting inhibitory inputs underlying suppression have similar properties as the inputs underlying the lead response appear to have parallels in related studies of masking and suppression. A study of temporal interactions in the IC for pairs of tone stimuli separated by a delay (Delgutte 1998) found that, for almost all neurons, suppression of the lagging tone was maximal when the leading tone was at the neuron’s best frequency. Similarly, in a study of directional dependence of masking using VS stimuli, Litovsky et al. (2001) found that, in a majority of IC neurons, the azimuth of a broadband noise that was the most effective in masking a simultaneously presented complex tone was also the azimuth to which the noise was the most sensitive. In many of these neurons, masking appeared to be due to an inhibitory mechanism because the noise suppressed the excitatory response to the tone signal. If these masking and suppressive effects are also mediated by inhibitory inputs from DNLL, they point to a general principle that, for the most part, these inputs have similar frequency and directional tuning as the inputs that shape the excitatory response to the lead or masker. A similar match between excitatory and inhibitory receptive fields has been noted for the cochlear nucleus (Caspary et al. 1994), suggesting a very general principle of organization. Relation to psychophysical data The large number of units for which the directionality of lag suppression was highly correlated with that of the lead response (MMs) suggests that suppression in the population of IC neurons would be maximal when the lead and lag emanate from the same location. Specifically, given a population of MMs neurons tuned to different azimuths, a given lead location will induce the most suppression in those neurons whose best azimuths match the lead azimuth, and therefore will most effectively suppress lags located near the lead azimuth. This prediction is consistent with the psychophysical finding that the
87 • FEBRUARY 2002 •
www.jn.org
990
R. Y. LITOVSKY AND B. DELGUTTE
precedence effect is stronger when the lead and the lag occupy the same location, and weakens as the separation between the two sources is increased (Litovsky and Shinn-Cunningham 2001). Here also, parallels are found in related psychophysical studies. Studies of sound localization in the presence of distracters preceding a target have shown that performance is most impaired when the target and the distracter arrive from similar spatial locations (Langendijk et al. 2001). This idea is reinforced in cross-correlation models of the binaural system (e.g., Colburn 1996; Stern and Trahiotis 1997), which suggest that the interference between directional information from a lead and a lag may be greatest when the two stimuli have similar ITDs and therefore excite overlapping populations of ITD-sensitive neurons. One would then predict that suppression should be weaker when the lead and the lag arrive from very different directions because the lag would cause less interference with estimation of the lead position. Litovsky and Shinn-Cunningham (2001) suggest that the precedence effect may be a by-product of a more general process that enables accurate localization, not only in the presence of echoes, but whenever any competing information from a second source arrives before the direction of a previous source has been computed. This view suggests that echo suppression is a special case of a more general computational mechanism in the auditory system for suppressing any information that could be disruptive to spatial auditory perception. These considerations do not provide a functional interpretation for the substantial minority of MMd, MU, and UM neurons, in which the directionality of echo suppression clearly differs from that of the lead response. Ironically, the awake rabbit preparation, which should be more representative of the listeners’ state during psychophysical experiments, is less predictive of the human psychophysical data, since there are many neurons for which suppression can be large when the lead and lag have very different ITDs (Fitzpatrick et al. 1995). While such neurons do not exactly predict the psychophysical data, they may be relevant to everyday experiences in reverberant environments, where echoes arriving from locations other than that of the lead might be rather confusing if they were not suppressed. Another means of relating the current data to human psychophysics is to consider whether any of the effects are related to CFs of the neurons. Thus far, no relationship has been observed in the present or previous work (Fitzpatrick et al. 1995; Litovsky and Yin 1998a,b) between CF and either the time course or the directional dependence of suppression. While somewhat surprising, since low and high frequencies are largely processed by different nuclei in the SOC, these results are consistent with psychophysical reports that the strength of the PE does not depend on the frequency content of stimuli, again suggesting a more generalized mechanism that suppresses information from echoes regardless of their specific content (e.g., Blauert and Divenyi 1988; Divenyi 1992; McCall et al. 1998; Shinn-Cunningham et al. 1995). Relative importance of directional cues for echo suppression A known characteristic of IC neurons is their sensitivity to directional cues, especially along the azimuthal dimension. To determine the relative importance of these cues for echo supJ Neurophysiol • VOL
pression, we presented a lagging sound, always having the full complement of directional cues, following a leading stimulus for which the directional cues were selectively manipulated. In this paradigm, the lead is akin to the single source stimulus in the Delgutte et al. (1995) study, with the added benefit that one can also study the effect of varying directional cues in the excitatory stimulus (lead) on the suppression of a constant stimulus (lag). Broadly speaking, the present data for the lead response are consistent with our previous work on directional sensitivity of IC neurons for broadband noise in virtual space (Delgutte et al. 1995, 1999). In both studies, ILD turned out to be important for the directional selectivity of most neurons with CFs above 2 kHz. Interestingly, no neuron with a CF above 3 kHz was found to be strongly sensitive to ITD for clicks, even though these brief stimuli might seem better suited for revealing ITD sensitivity than the long noise bursts with gradual rise times we used in our previous study. However, our sample of neurons was relatively small. A reverse pattern was found in low-CF (⬍2 kHz) neurons, where ITD tended to be the most potent cue, although some neurons were sensitive to ILD as well. These results are consistent with previous reports for both click and pure-tone stimuli that low-CF IC neurons tend to be more sensitive to ITD than to ILD (Caird and Klinke 1987; Kuwada and Yin 1983). Turning now to which cues determine the directionality of suppression, it is already clear from the data with full-cue stimuli that the relationship between excitation and suppression in the PE paradigm is not simple, with some neurons showing a tight relationship and others showing little or no relationship. With the cue manipulations, we further found that, while for a majority of neurons the same directional cues seemed to mediate the excitatory and suppressive responses produced by the lead, for a fair proportion of the population (1⁄3) the cues were probably different. Specifically, holding some cues constant (especially ILD in the 0L, ⌬S, or ⌬T conditions) resulted in a significant shift from the MMs response type, in which there is a strong relationship between excitation and suppression, to UM or MMd response types, in which that relationship is a weak or entirely lacking. The most obvious explanation for the apparent decoupling of excitation and suppression is that the two responses are mediated by different synaptic inputs. The cue manipulation results allow further refinements of the working hypothesis that inhibition from the DNLL is a major cause for suppression observed in the IC. The most common case when the same directional cues are important for both lag suppression and the lead response require no modification of the hypothesis that the DNLL neurons thought to underlie suppression receive inputs from the same neuron types in the SOC as do their targets in the IC. The case when lead excitation and lag suppression, although having similar directionality for the full-cue condition, become more dissimilar when one or more directional cues are held constant is more complex. One possibility is that the responses to both lead and lag for full-cue stimuli are dominated by a potent, highly directional input from the SOC (with a relay in DNLL for suppression). When this potent directional cue is held constant, other secondary inputs that are normally swamped by the dominant cue may be uncovered and able to affect the neuron’s behavior. If these secondary inputs to the DNLL and the IC differ in their directional sensitivity, excitation and suppression
87 • FEBRUARY 2002 •
www.jn.org
LOCALIZATION CUES AND PRECEDENCE IN THE IC
become less directly related. For example, for the neuron of Fig. 9, the directionality of both suppression and excitation are primarily determined by ITD, suggesting that this IC neuron may receive inputs from the same MSO neurons that also project to the putative DNLL neuron responsible for suppression. Rendering this MSO input nondirectional by setting ITD to zero eliminates the directionality of the lead response, but not that of suppression. Possibly, this IC neuron receives secondary inhibitory inputs from other DNLL neurons having different directional tuning, or there is only one kind of input from DNLL, but these DNLL neurons receive inputs from other nuclei as well as MSO. While these ideas are highly speculative, they have the merit of showing how our data, no matter how complex, can be accounted for by the interplay of different excitatory and inhibitory inputs to the IC and DNLL. If suppression were created by an entirely different mechanism such as receptor desensitization or intrinsic membrane properties of IC neurons, it is hard to see how the directionality of suppression and excitation could be differentially altered by holding constant some of the directional cues. Summary Here we studied physiological correlates of the precedence effect, a psychophysical phenomenon thought to be directly involved in our ability to localize sounds in reverberant environments. We found that, for a majority of neurons, there was a direct relationship between excitation and suppression, in that azimuthal locations with maximal sensitivity to the lead also produced maximal suppression of the lag, consistent with psychophysical reports that precedence is strongest when the lead and lag emanate from similar directions. By using headrelated transfer functions and digitally manipulating the directional cues contained in the stimuli, we found that, for a substantial minority of neurons, the excitatory and suppressive responses produced by the lead depend on different localization cues. This finding suggests that a conspicuous proportion of inputs mediating excitation and inhibition arise from different populations of neurons and may be most important when sound sources arise from different directions in space. These data, together with binaural models, imply that the precedence effect may be the by-product of a more general computational mechanism in the auditory pathway for suppressing any information that could be disruptive to spatial auditory perception. Finally, it is important to note that studies such as the present one, which investigate physiological correlates of the precedence effect, may improve our understanding of mechanisms associated with echo suppression at relatively early stages in the auditory pathway. However, they may not account for other phenomena associated with the precedence effect, which are thought to occur at higher levels in the pathway. A well-known example is the “build-up” and “break-down” of precedence, which suggests that listeners rely on internally built-in expectations about room acoustics acquired throughout life (Clifton and Freyman 1997). Litovsky and Yin (1998a) failed to find neural correlates for this phenomenon in the responses of IC neurons. Thus the data presented here are most likely applicable only to perceptual effects that are mediated by relatively early stages of auditory processing. J Neurophysiol • VOL
991
APPENDIX
Synthesis of partial-cue VS stimuli Designing “partial-cue” VS stimuli, in which some localization cues vary with azimuth while others are held constant, is tricky because the cues are inherently not independent. For example, because ILD varies with frequency as well as with azimuth, it is not possible to change ILD without also altering spectral cues. Any method must therefore be a compromise where the goal is to achieve maximum independence between the different cues. Over the course of this study, we used two different methods for synthesizing partialcue stimuli. We initially used the same method as in our previous work with VS stimuli (Delgutte et al. 1995). After identifying deficiencies in this simple method, we devised a more sophisticated method based on principal components that largely remedied these deficiencies. The original method for synthesizing partial-cue stimuli was designed so that the waveform of every partial-cue stimulus would be derived from that of a full-cue stimulus by introducing either a delay, or an amplitude scaling, or both. This strategy was motivated by the fact that most single-unit studies of binaural interactions also manipulate the interaural delay and amplitude of acoustic stimuli, operations that do not alter the spectral shape. We chose as a reference condition the full-cue stimulus for 0° azimuth because ITD and ILD are nearly zero at this location. ⌬T stimuli were synthesized by delaying this reference stimulus so as to give it the same ITD as the full-cue stimulus for every azimuth. ITD was defined as the maximum of the cross-correlation function of the stimulus waveforms at the two ears. On the other hand, 0T stimuli were obtained by delaying the full-cue stimulus for each azimuth so as to give it the same ITD as the 0° stimulus. To manipulate ILD, we first measured the root-mean-square (r.m.s.) pressure amplitude of the full-cue stimuli in each ear for every azimuth. ⌬L stimuli were then obtained by scaling the waveform of the 0° reference stimulus in each ear so as to give it the same r.m.s. amplitude as the full-cue stimulus for every azimuth. On the other hand, 0L stimuli were created by scaling the waveforms of the full-cue stimuli at each azimuth so as to give them the same r.m.s. amplitude as the 0° stimulus in each ear.2 While this simple method has the merit of using the same waveform operations as in previous studies of binaural interactions, it has the major disadvantage that azimuth response curves for complementary partial-cue stimuli can be highly correlated. Specifically, we found that azimuth response curves for the 0L stimuli showed a strong positive correlation with response curves for ⌬L stimuli for IC neurons with CFs above 5 kHz. Such correlations are undesirable because, ideally, the ⌬L stimuli should contain the potent ILD cue that is lacking in the 0L stimuli. These correlations can be understood if we consider that, for all azimuths, HRTF gains typically peak near 4 –5 kHz (corresponding to the resonance of the cat ear canal), so that the r.m.s. amplitude of any VS stimuli is primarily determined by its frequency components near 4 –5 kHz. Unlike HRTF gains, the ILD for a given azimuth increases monotonically with frequency up to 8 –10 kHz, above which it can become nonmonotonic depending on the locations of spectral notches in HRTFs. The ⌬L stimuli have the same ILD for all frequencies. Because this ILD is the ratio of the r.m.s amplitudes at the two ears, it only matches the ILD of the full-cue stimuli near 4 –5 kHz, while it underestimates the actual ILD for frequencies above 5 kHz. Similarly, because the 0L stimuli are derived from the full-cue stimuli by applying the same gain for all frequencies, their ILDs are actually 0 dB only near 4 –5 kHz, while they favor the same ear as the ILDs of ⌬L stimuli for frequencies above 5 kHz. Thus the use of broadband r.m.s. amplitudes for synthesizing 0L and ⌬L stimuli results in their patterns of ILD against 2 ⌬S stimuli were also synthesized but rarely used in practice responses to these stimuli almost invariably resembled responses to 0L stimuli, which also lack the powerful ILD cue (Delgutte et al. 1995).
87 • FEBRUARY 2002 •
www.jn.org
992
R. Y. LITOVSKY AND B. DELGUTTE
azimuth to be positively correlated for frequencies above 5 kHz, and therefore the neural responses of high-CF neurons to these stimuli to be positively correlated.3 To reduce these strong correlations between different partial-cue stimuli and their neural responses, we devised a new method for synthesizing partial-cue stimuli based on principal component analysis of the HRTFs (Chen et al. 1995; Kistler and Wightman 1992). This technique expresses the magnitude of the HRTF, H( f, ) (in dB) as a weighted sum of principal components H共 f, 兲 ⫽
冘
共 f兲 Wn共兲Cn共 f 兲 ⫹ H
(A1)
rather on how the relationship between the response to the lead and suppression of the lag response depends on localization cues. Statistical tests revealed no statistical difference in this relationship between the data collected with the new partial-cue stimuli and those collected with the original stimuli. The authors are grateful to C. Atencio and B. Cranston for expert technical assistance, L. Dodds for surgery, J. Rosowski for acoustic data from the cat external ear, and J. Desloge for the spherical head model software. This research was supported by National Institute on Deafness and Other Communication Disorders Grant DC-00119.
n⫽1
The principal components Cn( f ) are only a function of frequency, so that all directional information is contained in the azimuth-dependent weights Wn().4 The first principal component represents the overall shape of the HRTF, while higher-order components represent detailed spectral features such as notches. Based on this decomposition, ⌬L stimuli are defined so that their magnitude spectrum consists only of the weighted first principal component 共 f兲 H ⌬L共 f, 兲 ⫽ W1共兲C1共 f 兲 ⫹ H
(A2)
In contrast, the magnitude spectrum of a ⌬S stimuli is the weighted sum of all the higher-order components, plus the first component for the 0° azimuth stimulus H ⌬S共 f, 兲 ⫽
冘
共 f兲 Wn共兲Cn共 f 兲 ⫹ W1共0兲C1共 f 兲 ⫹ H
(A3)
n⫽2
The magnitude spectra of the ⌬L and ⌬S stimuli for 18° azimuth are shown in Fig. 2, D and E, respectively. As expected, the ⌬L stimuli have relatively smooth spectra and show a pronounced ILD for frequencies above 5 kHz, while the ⌬S stimuli show the same detailed spectral features as the full-cue stimuli, but have no systematic ILD over a broad frequency range. The principal component decomposition specifies only the magnitude spectrum of the ⌬L and ⌬S stimuli. Realizable filters were obtained by giving each magnitude spectrum its corresponding minimum phase. Giving HRTFs minimum phase has been shown to cause little or no degradation in human localization performance in a virtual acoustic space (Kulkarni et al. 1999). The new method for synthesizing 0T and ⌬T stimuli was the same as the original one, except that the reference condition for the ⌬T stimuli was the ⌬L stimulus at 0° azimuth rather than the full-cue stimulus at 0°. This was done to avoid sharp spectral features that might complicate the interpretation of the results with ⌬T stimuli. The new method for synthesizing partial-cue stimuli proved better than the original one in that there was little or no correlation between azimuth response curves for the ⌬L and ⌬S stimuli for neurons with CFs above 5 kHz. 0L stimuli were not synthesized with the new method because, based on previous results (Delgutte et al. 1995), they are expected to give similar responses as the ⌬S stimuli for neurons with CFs above 2–3 kHz. Because about one-half of our neural data were collected with the original partial-cue stimuli, and the other half with the new stimuli, an obvious question is whether it is appropriate to pool the two sets of data in summary plots such as Figs. 11 and 12. Such pooling was done because the primary focus of this paper (including Figs. 11 and 12) is not on neural sensitivity to individual localization cues per se, but 3 The same argument predicts that azimuth response curves for 0L and ⌬L stimuli should be negatively correlated for CFs below 4 kHz. While this prediction was verified for a few neurons, results were less consistent, perhaps because ITD becomes a potent cue at low frequencies and blurs the expected correlation. 4 ( f ) is the mean of the HRTF magnitudes over all directions. The term H
J Neurophysiol • VOL
REFERENCES ADAMS J. Cytochemical mapping of the inferior colliculus. Assoc Res Otolaryngol Abstr 18: 40, 1995. ADAMS JC AND MUGNAINI E. Dorsal nucleus of the lateral lemniscus: a nucleus of GABAergic projection neurons. Brain Res Bull 13: 585–590, 1984. AITKIN LM, GATES GR, AND PHILIPS SC. Responses of neurons in inferior colliculus to variations in sound-source azimuth. J Neurophysiol 52: 1–17, 1984. BARKER JL AND RANSOME BR. Pentobarbotone pharmacology of mammalian central neurons grown in tissue culture. J Physiol (Lond) 280: 355–372, 1978. BLAUERT J. Spatial Hearing: The Psychophysics of Human Sound Localization (Revised Edition). Cambridge, MA: MIT Press, 1997. BLAUERT J AND DIVENYI PL. Spectral selectivity in binaural contralateral inhibition. Acustica 66: 267–274, 1988. BRUGGE J, ANDERSON DJ, AND AITKIN LM. Responses of neurons in the dorsal nucleus of the lateral lemniscus of cat to binaural tonal stimulation. J Neurophysiol 33: 441– 458, 1970. CAIRD D AND KLINKE R. Processing of interaural time and intensity differences in the cat inferior colliculus. Exp Brain Res 68: 379 –392, 1987. CARNEY LH AND YIN TCT. Responses of low-frequency cells in the inferior colliculus to interaural time differences of clicks: excitatory and inhibitory components. J Neurophysiol 62: 144 –161, 1989. CASPARY DM, BACKOFF PM, FINLAYSON PG, AND PALOMBI PS. Inhibitory inputs modulate discharge rate within frequency receptive fields of anteroventral cochlear nucleus neurons. J Neurophysiol 72: 2124 –2131, 1994. CHEN J, VAN VEEN BD, AND HECOX KE. A spatial feature extraction and regularization model for the head- related transfer function. J Acoust Soc Am 97: 439 – 452, 1995. CLIFTON RK AND FREYMAN RL. The precedence effect: beyond echo suppression. In: Binaural and Spatial Hearing in Real and Virtual Environments, edited by Gilkey RH and Anderson TR. Mahwah, NJ: Lawrence Earlbaum Associates, 1997, p. 233–255. COLBURN HS. Computational models of binaural processing. In: Springer Handbook of Auditory Research: Auditory Computation, edited by Fay RR and Popper AN. New York: Springer, 1996, p. 332– 400. COVEY E, KAUER JA, AND CASSEDAY JH. Whole-cell patch-clamp recording reveals subthreshold sound-evoked postsynaptic currents in the inferior colliculus of awake bats. J Neurosci 16: 3009 –3018, 1996. CRANFORD JL. Localization of paired sound sources in cats: effects of variable arrival times. J Acoust Soc Am 72: 1309 –1311, 1982. DELGUTTE B. Physiological mechanisms of psychophysical masking: observations from auditory-nerve fibers. J Acoust Soc Am 87: 791– 809, 1990. DELGUTTE B. Temporal interactions for speech and nonspeech stimuli in the inferior colliculus. Assoc Res Otolaryngol Abstr 21: 205, 1998. DELGUTTE B, JORIS P, LITOVSKY R, AND YIN TCT. Relative importance of different acoustic cues to the directional sensitivity of inferior-colliculus neurons. In: Advances in Hearing Research, edited by Manley GA, Klump GM, K¨oppl C, Fastl H, and Oeckinghaus H. Singapore: World Scientific, 1995, p. 288 –299. DELGUTTE B, JORIS P, LITOVSKY R, AND YIN TC. Physiological studies in the inferior colliculus of the cat. I. Neural sensitivity to sound source direction as measured with virtual space stimuli. J Neurophysiol 81: 2833–2851, 1999. DIVENYI PL. Binaural suppression of nonechoes. J Acoust Soc Am 91: 1078 – 1084, 1992. FITZPATRICK DC, KUWADA S, BATRA R, AND TRAHIOTIS C. Neural responses to simple, simulated echoes in the auditory brainstem of the unanesthetized rabbit. J Neurophysiol 74: 2469 –2486, 1995.
87 • FEBRUARY 2002 •
www.jn.org
LOCALIZATION CUES AND PRECEDENCE IN THE IC FITZPATRICK DC, KUWADA S, KIM DO, PARHAM K, AND BATRA R. Responses of neurons to click-pairs as simulated echoes: auditory nerve to auditory cortex. J Acoust Soc Am 106: 3460 –3472, 1999. FREYMAN RL, CLIFTON RK, AND LITOVSKY RY. Dynamic processes in the precedence effect. J Acoust Soc Am 90: 874 – 884, 1991. HENKEL CK AND SPANGLER KM. Organization of the efferent projections of the medial superior olivary nucleus in the cat as revealed by HRP and autoradiographic tracing methods. J Comp Neurol 221: 416 – 428, 1983. IMIG TJ, IRONS WA, AND SAMSON FR. Single-unit selectivity to azimuthal direction and sound pressure level of noise bursts in cat high-frequency primary auditory cortex. J Neurophysiol 63: 1448 –1466, 1990. IRVINE D. Physiology of the auditory brainstem. In: The Mammalian Auditory Pathway: Neurophysiology, edited by Popper AN and Fay RR. New York: Springer-Verlag, 1992, p. 153–231. JIANG D, MCALPINE D, AND PALMER AR. Responses of neurons in the inferior colliculus to binaural masking level difference stimuli measured by ratelevel functions. J Neurophysiol 77: 3085–3106, 1997. KELLER CH, HARTUNG K, AND TAKAHASHI TT. Head-related transfer functions of the barn owl: measurement and neural responses. Hear Res 118: 13–34, 1998. KELLER CH AND TAKAHASHI TT. Responses to simulated echoes by neurons in the barn owl’s auditory space map. J Comp Physiol 178: 499 –512, 1996. KELLY JB. Localization of paired sound sources in the rat: small time differences. J Acoust Soc Am 55: 1277–1284, 1974. KELLY JB, BUCKTHOUGHT AD, AND KIDD SA. Monaural and binaural response properties of single neurons in the rat’s dorsal nucleus of the lateral lemniscus. Hear Res 122: 25– 40, 1998. KELLY JB AND KIDD SA. NMDA and AMPA receptors in the dorsal nucleus of the lateral lemniscus shape binaural responses in rat inferior colliculus. J Neurophysiol 83: 1403–1414, 2000. KIANG NY AND MOXON EC. Tails of tuning curves of auditory-nerve fibers. J Acoust Soc Am 55: 620 –30, 1974. KIANG NYS, WATANABE T, THOMAS EC, AND CLARK LF. Discharge Patterns of Single Fibers in the Cat’s Auditory Nerve. Cambridge, MA: MIT Press, 1965. KIDD SA AND KELLY JB. Contribution of the dorsal nucleus of the lateral lemniscus to binaural responses in the inferior colliculus of the rat: interaural time delays. J Neurosci 16: 7390 –7397, 1996. KISTLER DJ AND WIGHTMAN FL. A model of head-related transfer functions based on principal components analysis and minimum-phase reconstruction. J Acoust Soc Am 91: 1637–1647, 1992. KLUG A, BAUER EE, AND POLLAK GD. Multiple components of ipsilaterally evoked inhibition in the inferior colliculus. J Neurophysiol 82: 593– 610, 1999. KLUG A, PARK TJ, AND POLLAK G. Glycine and GABA influence binaural processing in the inferior colliculus of the mustache bat. J Neurophysiol 74: 1701–1713, 1995. KULKARNI A, ISABELLE SK, AND COLBURN HS. Sensitivity of human subjects to head-related transfer-function phase spectra. J Acoust Soc Am 105: 2821– 2840, 1999. KUWADA S, BATRA R, AND STANFORD TR. Monaural and binaural response properties of neurons in the inferior colliculus of the rabbit: effects of sodium pentobarbital. J Neurophysiol 61: 269 –282, 1989. KUWADA S, BATRA R, YIN TCT, OLIVER DO, HABERLY LB, AND STANFORD TR. Intracellular recordings in response to monaural and binaural stimulation of neurons in the inferior colliculus of the cat. J Neurosci 17: 7565–7581, 1997. KUWADA S AND YIN TCT. Binaural interaction in low-frequency neurons in inferior of the cat. I. Effects of long interaural delays, intensity, and repetition rate on interaural delay functions. J Neurophysiol 50: 981–999, 1983. KUWADA S, YIN TCT, AND WICKESBERG RE. Response of cat inferior colliculus neurons to binaural beat stimuli: possible mechanisms for sound localization. Science 206: 586 –588, 1979. LANGENDIJK EHA, KISTLER DJ, AND WIGHTMAN FL. Sound localization in the presence of one or two distracters. J Acoust Soc Am 109: 2123–2134, 2001. LI L AND KELLY JB. Inhibitory influence of the dorsal nucleus of the lateral lemniscus on binaural responses in the rat’s inferior colliculus. J Neurosci 12: 4530 – 4539, 1992. LITOVSKY RY, COLBURN HS, YOST WA, AND GUZMAN S. The precedence effect. J Acoust Soc Am 106: 1633–1654, 1999. LITOVSKY RY, LANE CC, ATENCIO C, AND DELGUTTE B. Physiological measures of the precedence effect and spatial release from masking in the cat inferior colliculus. In: Physiological and Psychophysical Bases of Auditory Function, edited by Houtsma AJM, Kohlrausch A, Prijs VF, and Schoonhoven R. Maastricht, The Netherlands: Shaker Publishing, 2001. J Neurophysiol • VOL
993
LITOVSKY RY AND MACMILLAN NA. Sound localization precision under conditions of the precedence effect: effects of azimuth and standard stimuli. J Acoust Soc Am 96: 752–758, 1994. LITOVSKY RY AND SHINN-CUNNINGHAM BG. Investigation of the relationship between three common measures of precedence: fusion, localization dominance and discrimination suppression. J Acoust Soc Am 109: 346 –358, 2001. LITOVSKY RY AND YIN TCT. Physiological studies of the precedence effect in the inferior colliculus of the cat. I. Correlates of psychophysics. J Neurophysiol 80: 1285–1301, 1998a. LITOVSKY RY AND YIN TCT. Physiological studies of the precedence effect in the inferior colliculus of the cat. II. Neural mechanisms. J Neurophysiol 80: 1302–1316, 1998b. MARKOVITZ NS AND POLLAK GD. Binaural processing in the dorsal nucleus of the lateral lemniscus. Hear Res 73: 121–140, 1994. MCCALL DD, FREYMAN RL, AND CLIFTON RK. Sudden changes in spectrum of an echo cause a breakdown of the precedence effect. Percept Psychophys 60: 593– 601, 1998. MERZENICH MM AND REID MD. Representation of the cochlea within the inferior colliculus of the cat. Brain Res 77: 397– 415, 1974. MICKEY BJ AND MIDDLEBROOKS JC. Influence of the precedence effect on localization of sound by cortical neurons. Assoc Res Otolaryngol Abstr 24: 60, 2001. MIDDLEBROOKS JC, CLOCK AE, XU L, AND GREEN DM. A panoramic code for sound location by cortical neurons. Science 264: 842– 844, 1994. MORSE PM AND INGARD KU. Theoretical Acoustics. New York: McGraw-Hill, 1968. MUSICANT AD, CHAN JCK, AND HIND JE. Direction-dependent spectral properties of cat external ear: new data and cross-species comparisons. J Acoust Soc Am 87: 757–781, 1990. OLIVER DL AND HUERTA MF. Inferior and superior colliculi. In: The Mammalian Auditory Pathway: Neuroanatomy, edited by Webster DB and Popper AN. New York: Springer, 1992, p. 168 –222. PARHAM K, ZHAO HB, AND KIM DO. Responses of auditory nerve fibers of the unanesthetized decerebrate cat to click pairs as simulated echoes. J Neurophysiol 76: 17–29, 1996. PARK TJ AND POLLAK GD. Azimuthal receptive fields are shaped by GABAergic inhibition in the inferior colliculus of the mustache bat. J Neurophysiol 72: 1080 –1112, 1994. POPULIN IC AND YIN TCT. Behavioral studies of sound localization in the cat. J Neurosci 18: 2147–2160, 1998. RAJAN R, AITKIN LM, IRVINE DRF, AND MCKAY J. Azimuthal sensitivity of neurons in primary auditory cortex of cats. I. Types of sensitivity and effects of variations in stimulus parameters. J Neurophysiol 64: 872– 887, 1990. RICE JJ, MAY BJ, SPIROU GA, AND YOUNG ED. Pinna-based spectral cues for sound localization in cat. Hear Res 58: 132–152, 1992. ROSOWSKI JJ, CARNEY LH, AND PEAKE WT. The radiation impedance of the external ear of cat: measurements and applications. J Acoust Soc Am 84: 1695–1708, 1988. SCHREINER CE AND LANGNER G. Periodicity coding in the inferior colliculus of the cat. II. Topographical organization. J Neurophysiol 60: 1823–1835, 1988. SHINN-CUNNINGHAM BG, ZUREK PM, AND DURLACH NI. Adjustment and discrimination measurements of the precedence effect. J Acoust Soc Am 93: 2923–2932, 1993. SHINN-CUNNINGHAM BG, ZUREK PM, DURLACH NI, AND CLIFTON RK. Crossfrequency interactions in the precedence effect. J Acoust Soc Am 98: 164 –171, 1995. SHNEIDERMAN A, OLIVER DL, AND HENKEL CG. Connections of the dorsal nucleus of the lateral lemniscus: an inhibitory parallel pathway in the ascending auditory system? J Comp Neurol 276: 188 –208, 1988. SIVARAMAKRISHNAN S AND OLIVER DL. Distinct K currents result in physiologically distinct cell types in the inferior colliculus of the rat. J Neurosci 21: 2861–2877, 2001. STERN RM AND TRAHIOTIS C. Models of binaural perception. In: Binaural and Spatial Hearing in Real and Virtual Environments, edited by Gilkey RH and Anderson TR. Mahwah, NJ: Erlbaum, 1997, p. 499 –531. TOLLIN DJ AND HENNING GB. Some aspects of the lateralization of echoed sound in man. I: Classical interaural delay-based precedence. J Acoust Soc Am 104: 3030 –3038, 1998. TOLLIN DJ, POPULIN LC, AND YIN TCT. Psychophysical and physiological studies of the precedence effect and echo threshold in the inferior colliculus of the behaving cat (Abstract). J Acoust Soc Am 109: 2407, 2001.
87 • FEBRUARY 2002 •
www.jn.org
994
R. Y. LITOVSKY AND B. DELGUTTE
TRAHIOTIS C AND STERN RM. Lateralization of bands of noise: effects of bandwidth and differences of interaural time and phase. J Acoust Soc Am 86: 1285–1293, 1989. VALENZUELA MN AND HAFTER ER. Influence of source and echo separation on echo threshold of natural complex sounds. J Acoust Soc Am 107: 2822, 2000. WALLACH H, NEWMAN EB, AND ROSENZWEIG MR. The precedence effect in sound localization. Am J Psychol 42: 315–336, 1949. WENZEL EM, ARRUDA M, KISTLER DJ, AND WIGHTMAN FL. Localization using nonindividualized head-related transfer functions. J Acoust Soc Am 94: 111–123, 1993. WICKESBERG RE. Rapid inhibition in the cochlear nucleus complex of the chinchilla. J Acoust Soc Am 100: 1691–1702, 1996. WIGHTMAN FL AND KISTLER DJ. The dominant role of low-frequency interaural time differences in sound localization. J Acoust Soc Am 91: 1648–1661, 1992. WYTTENBACH RA AND HOY RR. Demonstration of the precedence effect in an insect. J Acoust Soc Am 94: 777–784, 1993.
J Neurophysiol • VOL
XU L AND MIDDLEBROOKS JC. Individual differences in external-ear transfer functions of cats. J Acoust Soc Am 107: 1451–1459, 2000. YAN J AND SUGA N. Corticofugal modulation of time-domain processing of biosonar information in bats. Science 273: 1100 –1103, 1996. YANG L AND POLLAK GD. Features of ipsilaterally evoked inhibition in the dorsal nucleus of the lateral lemniscus. Hear Res 122: 125–141, 1998. YANG X AND GRANTHAM DW. Echo suppression and discrimination suppression aspects of the precedence effect. Percept Psychophys 59: 1108 –1117, 1997. YIN TCT. Physiological correlates of the precedence effect and summing localization in the inferior colliculus of the cat. J Neurosci 14: 5170 –5186, 1994. ZUREK PM. The precedence effect and its possible role in the avoidance of interaural ambiguities. J Acoust Soc Am 67: 952–964, 1980. ZUREK PM. The precedence effect. In: Directional Hearing, edited by Yost WA and Gourevitch G. New York: Springer-Verlag, 1987, p. 85–105.
87 • FEBRUARY 2002 •
www.jn.org