raitied onl a t raining seo consisting of 75 particle size distributions obtained from three ...... a contractor's report, or tasking agency. we entered in section 6.1.
{UNCLASSI1FIED
Dfnctiona Difnse
lft t
H11111111
Iii
lllE } Dl SUFFIELD REPORT
I INO. 531 UNLIMITED DISTRIBUTION
NEURAL NETWORK RECOGNITION AND CLASSIFICATION
0
OF AEROSOL PARTICLE SIZE DISTRIBUTIONS
CN
by
E. 1ee and J. Ho
PCN No. 051SP
January 1990
DEFENCE
I
C
ma
I
RESEARCH ESTABLISHMENT
SUFFIELD: RALSTON : ALBERTA
WARNING . *The r~oanition use of thisof information Is permitted rights" sub pet to orotwkrwv and patet
I
UNCLASSIFIED DEFENCE RESEARCH ESTABLISHMENT SUFFIELD RALSTON ALBERTA
SUFFIELD REPORT NO. 531
NEURAL NETWORK RECOGNITION AND CLASSIFICATION OF APiAR
'L
1'AItTICLiE sIZE DISTRIBUTIONS
by
E. Yce afld ,. Ho
PCN No. 051SP
I
WARNING The use of this infnrmation is permitted subject to recognition of proprietary and patent rights*.
UNCLASSIFIFJ)
I
UNCLASSIFIED
ACKNOWLEDGEMENTS Thre authors raful
wroeg
tirevaluable comwinrts arid encouraging remarks fromr Dr. T. V.
.13;COhsoir, Dr. S. J. Armour and Mir. S. Meliseir oni the contents of this paper.
Accession For DTIC TA'B
U NCLASSI[F IED
U NCLASSIFIED
ABSTRIACT Thliis paper dlescribes thc applic atlonl of a neural comt putationial network mtodel to the pattern recogit -
iju
and cailtoll
of anro(Iv ii
particle size distributions associated with a number of environmiental,
bacterial, and art ificial aerosols. 'I'lie aerodviiaiic particle size dist ributions are measuired in real-timen with Ii gill resolution using a two-s1 ot li-elaser velocinuet er. 'I'lie t ccli ique emiployedI here for t li recognitionl c assificat ion of aerosols of
aii
iunk nowni
orig-il is based onl a t Iire'- layered fictiral network thiat ha;s been
raitied onl a t raining seo consisting of 75 particle size distributions obtained from three distinct type(s of aerosols. r th
'Ile' trainiung of' tlie neural nietwork was arcoi pl islied with the back-propagation learninig algo-
Thi [le etrec ts of the niutmber of processing uinits inI
lie hiidden laver and1 the level of noise corruptintg
II training set, tie test set , and the c'onnectioni weights onl the learning rate and classification dfIic icicy of
lhe neural net work art, st udied. 'Tle abhilit y of the traiiied network to generalize froin the fi ite nmber of SIZe distributions inI the traiinig set to iunkiiowii size dist ributions obtained from uiicertamii mid~ uiifamiiliair enTVironments is i evest iga tte~l.
'['lie approach offe~rs the op~portuni ty of recogniizinhg, claissifyi hg, anid cliarac-
irizi ug aerosol particles ini real-timie accordinig to their aerodyiiainic particle size spectrum and Its high r cogiit ion accuracy shows considerable proniise for applications to rap~id real-time air mon itoriing inI thle areas of OeCti patiOn al heCalth anld air polluition standlardls.
U NC LAS SIFI ED
UNCLASSIFIED EXECUTIVE SUMMARY lit recent yers, the mnilitary's concern with the vitem~y utse
or classical biological agenIts as wellI as
I li newly elnerginlg mid-spectrii Ii agents (which wvill all be dhissemihlnated as solid aerosols) has led, to COjL.iI eri;lhe r4'soarel efforts in Lte developmienit of acrosol detectors and sensors capale of rapidlly i(ntifjilg and classifying patihogenic aerosols. lThis paper analyzes and develops a relatively new approach to thle 'kilptive recognitionl anid classificat loil of valis types
of enviroinmental, bacterial and -artificial acrosols that ~Is based
onl an iiitegratcd mieasuremient and compul~ltation~al environment involving the use
or an Aerodynamic Particle
Size \nial vzvr for Lte real-tI Ime and high r( sohiition measurement of aerodynamic particle size (listLribu Lions intevrfaced withk a feed-forward neural network for the adaptive pattern recognitioni and classiricationi of tlc Observed paicle size spectra. TFheie nral network is a computational paradigm based onl the concept that a
sively p~arallel network of eloelntal processors (i .e., artificial lieurall units) arranged in a man ner rein-
inliscenit. of biological neural nets mlight. be able to learn to recognize and~ clasisify patterns in ant auiton~omlous m~anne11r.
Ill I his paper, it. is shlown I flat a fully inlterconnlected three-layered nleural n~etwork (48 input, neurouns1 illinblir of hidden nieuron", and *2 output neurons) withl noniline'ar sigllloidl units for thlreshld~inlg
Ivariabile
can be trained with the standard back-prolpagation learning algorithm using a training set consisting of 25
tarticle size distribution funict ions from each of three classes of aerosols (one atmospheric and twoi latex particle stanidards). It was found that a recognition rate of 100 percent can be obtained for the1training set using neural networks with three or imore hidden neurons. I',xperiments conducted to study the pcrfornmnce chiaract eristics of the neural network as a fu nction of Lte quality of data, used for Lte training and test sets anid of inclsionl of random noise ill Ihe conniection strengths of the trained tietwvork showed that. the neural net work call func1Wtion as a very 'an It- toleraii t patternl recogn itionl and classi ficationi systemi.
Fu rtier Ilore, it
wa shown thlat. a fully trained ileliral network can be used to form reliable generalizations to particle size
dist ributionls that it has never "seen". l-lpboof
lIn this regard, it was; demonstrated that the trai iicd nietwork was
grouiping particle size dlistribuitions of uniknown type into simiilar categories for Lte case where tie
ilmnhier of cluster categories was unknlown a prior-i.
AlIthoughi thle present work has focussed exclusively oil Lte coulpling of the neuiral network paradigml to all iAerodvnaiiic Particle Size!r for aerosol idenitification , it only reprcmsents bi recogiiitioll and classification of aerosols.
olle possibhility for Lt(e
It would be desirable to investigate the coupling or adaptive
patternl recognlitionl al(I classiticationl systems based on neural networks (implemented either as sof'tware 11111 lations or as electronlic anid/or optical hardware) withl detection methlods thlat provide ant opti mum siji1sitivit y anld speci licity for tile detection01 aiind quantitative evaluation of the chlemical or biological ageint..
lit this regatrd, it might be useful to inlvestigate tile application of neural networks to Lte adaptive recognition and classification of Chemical agents (vapors) and of biological agents (biological components in aerosols)
based onl ioul no1bility spectromnetry aiid pyrolysis mass spectrometry, respectively.
UN CLASSI FIED
UNCLASSIFIED I.
INTRODUCTION
The extraction of features from patterns and waveforms is important in a number of pattern recognition applications spanning a range of different scientific disciplines such as image and scene analysis, computer vision, speech and character recognition, biological taxonomy and medica! diagnosis, radar and sonar target recognition and classification, robotics and remote manipulators, and seismic data analysis. The design of an optiial classifier for these patterns and waveforms invariably requires knowledge
''
he st 2 t ;st
jc
of the signal and noise processes and, with regard to the latter aspect, the performance of the classifer is dependent on how well these statistics have been characterized.
However, in most practical applications,
the statistics of the signal and noise processes are either not knc,vn or have been wrongly assumed to possess certain characteristics. Uncertainties, introduced as the result of unknown noise processes and/or ignorance of the processes and systems generating the waveforms and patterns, require the development, of new pattern recognition methods aid, in this rpgard, the self-organizational and perceptual capabilities displayed by artificial neural network architectures offer considerable promise. The artificial neural network, largely inspired by developments in neurobiology, is a con, pu tational paradigm which consists of a network of parallel distributed processing units (i.e., nomirons) which are interconnected to one another according to some prescribed topology. Research into arlificial nemi ral networks dates hack to the seminal work of McCulloch and Pitts [1] in the 1940s and to the development of early two-layered neuronal models in the 1950s and 1960s, such as the PERCEPTON proposed by lioseitlatt [2] and the ADALINE developed by WVidrow [3]. However, interest in neural network research waned in the 1970s after Minsky and Papert [,4] demonstrated the limitations and restrictions inherent in all the early two-layered neuronal models. Recently, there has been a resurgence of interest in neural network paradigms and connectionist architectures. This renewed interest has largely been engendered as the result of certain theoretical developments in neural network models and of advances in VLSI technology for the construction and implementation of massively parallel computational architectures [5,6]. The present study applies a neural network computational model to the recognition and classification of environmental (i.e., natural), bacterial, aid artificial aerosols on tile basis of the aerodynamic particle size distribution.
Typical measurenients of tie aerosol size distributions of atmospheric aerosols
wit h an Aerodynaniic P)article Size analyzer indicate that, there is a considerable variability in the shape of th, partile size spectrum of natiral aerosols over a givein interval of
tinue
and it is this wotutral temiporal
variability in shape that makes it difficult to discriminate airborne containiation froin nat.iral aeros(,Is using converntiona pattern recognition techniiques. With regard to the latter )oit., the detectioni arid classilication of sources of contamination from chaitges in the shape of the background aerosol size distribution is an important prucess in the adequate assessment of the safety of the environment,. Indeed, within the fields of applied and environmental biology, of air quality monitoring, and of toxicological research, the health effects
UNCLASSIFIED
UNCLASSIFIED
2
posed by airborne industrial, bacterial and viral particles depend critically on the ability t, 1ecognize, characterize, and classify these particles oil the basis of their particle size distribution function. In this paper, we demonstrate how a neural netwcrk model may be applied to recognize and classify the complex shapes of particle size distributions of a number of environmental, biological, and artificial aerosols assuming an ignorance of the structural information of the underlying processes generating the aerosols. The paper is organized as follows. In Section II, a brief description is provided of the architecture of Ihe neural network model used in the present study. Then, in Section IfI, we review briefly the mathematical formulation of the back-propagation lwarning algorithm that is utilized to train the network. In Section IV, we, desc ribe the aerosol particle size dist ribution data and the construction of the training and test data sets. 'otiter simulation results and experiments relating to various aspects of network training, classification performance, fault-tolerance and generalization are presented in Section V. Finally, we discuss our findings and draw some conclusions in Section VI. II.
DESCRIPTION OF NETWORK ARCHITECTURE
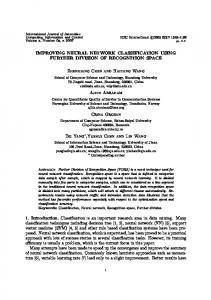
The architecture of the neural network used in the present study is illustrated in Fig. 1. The neural network model is essentially a directed graph of processing units or artificial neurons organized into three layers. The input layer of the network consists of 48 neurons-each neuron is associated with one of the 48 aerodynamic particle diameter channels which span the range from 0.5 to 15 jim. Indeed, during normal operation, each of the neurons of the input layer is externally forced or "clamped" to the value of the input aerosol size distribution in a particular particle diameter channel. In this respect, the values of the input neurons are proportional to the probability that the aerosol particle size lies within the particular size, interval.
The output layer of the neural network consists of two neurons whose particular state is used to encode the class of the aerosol size distribution. In the present application, the neuron output responses (0,1) and (1,0) are used to represent artificial spherical monodisperse aerosols composed of polystyrene spherical latex particles of I- and 3-jim diameters, respectively, whereas the output response (1,1) is used to represent natural (atmospheric) aerosol size distributions. Consequently, each of the possible classes of aerosol size distributions is represented by a particular combination of responses of the output neurons. The input neurons are connected to the output neurons through an intervening layer of hidden neurons by a set of connections with adjustable (i.e., adaptive) weights. The connection weights between neurons in the input MiI biddvn layers and the hidden and output layers can be "tuned" by a learning algorithm in order to encode the structural features and higher-order correlations in the input patterns (i.e., aerosol size distributions) that are useful for the detection, identification, and classification of the input. These weights can have both positive and negative values and correspond, respectively, to excitatory and inhibitory connections between the neurons. Finally, it should b,; noted that the neural network shown in Fig. 1 is feedforward in the sense UNCLASSIFIED
UNCLASSIFIED
3
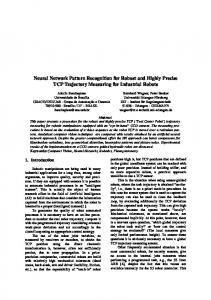
that the signal flow in the connections of the network proceeds unidirectionally from the input to the hidden layer and from the hidden to the output layer. In other words, the output of a neuron in a given layer is only connected to the input of the neurons in the subsequent laycr. The structure of a single processing unit or neuron is illustrated in Fig. 2. The output of the i-th neuron is obtained by first computing the weighted sum of the inputs to the neurons according to the prescription Si =
_Wijpj,
(I)
where p, denotes the output of the j-th neuron and wij denotes the weight (i.e., interconnection strength) associated with the connection of the output of the j-th neuron to the input of the i-th neuron. summation in Eq. (1) i- over all the inputs to the i-th neuron.
The
The summed output Si is subsequently
subjected to a monotonic signoidal transformation which provides a graded response between 0 (miniiiuin) and I (maximum). Consequently, the output of the i-th neuron is given by 1 Pi=
1 + exp(-7(S + SO))'
(2)
where S, is the threshold or bias for the i-th neuron and y is the gain of the sigmoid function. The effect of S0 is to shift the signioid function to the left (S9 > 0) or right (S °0 < 0) along the horizontal axis, and tle effect of j is to modify the shape of the signioid. The sigmoid function with gain 7 = i and shift Sc = 0 is displayed in Fig. 3, where X =_ Si an(] Y = pi. It is important to note that the soft-limiting siginoid function serves a threshold device (activation function) for the processing unit and, in this sense, can be considered to be an approximation of the hard-limiting signum function used in some of the early neural network models. However, unlike the signum function, the signoid function possesses the necessary differentiability for the application of the back-propagation learning algorithm used for training the neural network. III.
BACK-PROPAGATION LEARNING ALGORITHM
The use of a neural network model consists of two basic phases: (1) a training phase and (2) an operational phdse. The primary purpose of the training phase is to encode the features of the input patterns presented to the neural network through the proper selection of the interconnection strengths or weights u,j between the various neurons of the network.
To this purpose, a supervised gradient-descent
learning scheme known as the back-propagation learning algorithm is utilized to train the neural network model. The back-propagation learning algorithm was developed by Rumelhart cl. al. [7] and is, in esseuce, a generalization of the Widrow-Iloff
LMS (least mean square) algorithm [8,9] that was originally formulated
for adaptive signal processing. ,THieback-propagation learning algorithin is a gradient-descent algorithin in we'iglt, space whereby the output error signals are propagated back through the network in order to niodify tlic weighis i UNCLASSIFIED
lhe
UNCLASSIFIED direction that results in the largest reduction in the error. Application of the back-propagation rule to the training of a neural network involves two passes through the network. In the forward pass, -. given training patte:n from the training set is presented to the input layer of the network.
The signal-
generated in
the network by the given training pattern, are propagated forwards through the various neurons and their connections according to Eqs. (1) and (2) to produce a response in the neurons of the output layer. In the backward pass, the product of the discrepancy between the observed and desired output responses and the derivative of the threshold (sigmoid) function is propagated in reverse through the connections of the network with the objective of modifying those weights that had a large effect on the output response more than those that did not. More specifically, the error signal 6i in the i-th output neuron is calculated according to the prescription
b,= (ti - Pi) 0"(si),
(3)
where Pi denotes the response of the i-th output neuron, tidenotes the desired (i.e., target) response of the i-th output neuron, and 0'- denotes the first derivative of the threshold function. This output error signal is then back-propagated to the hidden layer where the hidden error signal 6* for the i-th hidden neuron is computed as follows:
6i
=E~j~j07,Si),(4)
where wij is the weight associated with the connection from the i-th hidden neuron to the j-thi output neuron. Obviously, the summation over j in Eq. (4) is over all neurons of the output layer. With the calculation of the error signals as per Eqs. (3) and (4), the connection weight tvi between the i-th hidden neuron and the j-th output neuron is modified according to the prescription Awij(k) = Y((1 - p)6jpi + pAwij(k - 1)), where A denotes the "change in",
7i
(6)
is the learning rate parameter that governs the speed of convergence of
lie algorithm, p is the smoothing parameter (p
e
[0, 1]), and p, is the response of the i-th hidden neuron. The
index k in Eq. (6) denotes the number of the iteration cycle. Similarly, the weight change in the connection between the i-th input neuron and the j-th hidden neuron is given by Aw, (k) = 7((i - p)6,p, + pAwj(k - 1), where pi is the response of the i-th input neuron.
(7)
It should be noted that the smoothing parameter p
serves to suppress oscillations in the weight changes, thus permitting the use of larger values for the learning rate parameter T1.In addition to the weights wi , the thresholds S? also need to be determined. With regard to this point, it is important to note that these threshold parameters can be determined with the back-propagation learning algorithm in exactly the same manner as for the connection weights. It is only UNCLASSIFIED
UNCLASSIFIED
5
necessary to imagine the thresholds S," as the weights from neurons that always have output values of unity.
In practice, the elements ot the training set are cycled through the neural network antid th, connection strengths and thresholds are adaptiv,ly adjusted with tile back-propagation learn inig algorithl
unil the
discrepancies between all the observed and desired out put responses are reduced to below some prescribed tolerance for all the input patterns of the training set. IV.
AEROSOL SIZE DISTIIBIfUTION DATA
The data sets used for the present investigation are constructed from aerodynamic particle size ,ttribution functions (PISDFs) obtained from 11 different aerosol populations. The lSI)l's were ti,asurd with an Aerodynamic Particle Sizer (APS), Model
331
( I'SI Incorporated) which determines the aorolyN-
narnic diameter of individual aerosol particles by measuring the transit time of tihe particles l etweeti two spots generated by a laser velociieter that employs a polarized 2-mW lile-Ne laser as the light source. The APS brings the aerosol sample into at outer accelerating orifice and focuses the sampled aerosol into an inner nozzle which directs the individual particles through a dual-beant laser formed by splitting a focused la.ser beam on the basis of polarization using a calcite plate. The beams are then focused using a cylindrical lens to produce two flat beams of rectangular cross-section just downstream of the nozzle orifice. As the aerosol particle passes through these two beams, it triggers a pair of elect rical pulses whose temporal separation is accurately measured using a high-speed digital clock. A ,iiulti-channel acumulator (\(A) is used to record the transit tilnes o all tile aerosol particles and, at the end of a prescrib.d salmpliiig t i11,, a tiicroeoititlpler reads each channel of the MCA, translates the channel numbers to aerodytiaric
;particle sizes, and displays
the information as a histogram consisting of 48 size intervals (i.e., bins) spanning the 0.5- 15 im aerosol diameter range. The aerosol size distributions utilized in the study were obtained from artificial, environmental, and biological (i.e., bacterial) aerosols. All the aerosols considered were non-volatile under ambient conditions. The size distributions were classified into 11 ci-Legories depending ott the source of the aerosol particles generating the distribution. Integer values of 1 through II were assigned to these categories for convenient reference. des
A summary of the aerosol size distribution category notation is found in Table I and a brief
iption follows. Particle size distributions 1 and 2 correspond to spherical monodisperse polystyrene
latex (PSI,) particles at nominal I- and 3-pin diameters and geometric standard deviations (a_)
of 1.035
and 1.02, respectively. Particle size distribution 3 corresponds to atmospheric aerosols (i.e., background) composed of a population of aerosol particles of both natural and athropogenic origin suspended ini the atmosphere.
A mixture of equal proportions of I- and 3-tm PSL particles, of I-pin PSI, particles and
atmospheric aerosols, of 3-p n PSI, particles ai-t] atmospheric aerosols and, of I-,
: -plli
PS1, parlicles anud
at mospheric aerosols provide particle size distrihutions 4, 5, i, and 7, respectively. IParticle size (list riit
ion
8 coincides with 0.6-pin PSL particles with a geometric standard deviation of 1.05. Vinally, particle size UNCLASSIFIED
UNCLASS IFIE D
6
lr.'t-1 but ions 9),1t), and~ 11 correspond~ to viable rod-shaped aerosolized bacteria Er-winia hierbicola (Ell) 2 5 x 0.5 Inm), "i17'.
itive Baillrs subblis rar. globzgii
(13IG) (1.5 x 0.5 jim) and -clean" Bacilhis sribtilus
glotigit (1.5 x 0.5 jim). respectively. The latter b~acterial particle-, were obtained fromn the native 13G
by wash inrg once withI rut rap ure watcr followed by cen trifugat ion. Th'le Eli and fIG pre-- ide examples of long-roil and short -rod inlirogerieous bacterial cells, respecti~ ely. Furthermore, it should be noted that Ell anl
IG were aerosolized in the form of liquid suispensions of vegetative cells and spores, respectively, and
these pairticles were found to be almost completely dehydrated within a few seconds after aerosolization. All the aerosol size dist ribu tions measuired were normalized to take values between 0 and 'before Il,.
%v
ueised ;Ls input to lie neural network. Particle size distribution-, I, 2, and 3 were used to train and
1-tIlw irot work. I.t.
1o thIis liurpotse, (he PI'S
,is* , set of 25 I SD l'swere ranrionrl I . Ili, trainling Set eirtsof
in ach of thlese( thIree classes were divided equally to form III
selected fromn each of thle thIiree classes to fo. i the training set
25 l t SIA's fronti each of the three claLsss for a total )f 75 P )iii's) arid tire
rrrrarnirrg 25 PSDFs fromn each of' thre three (lasses sorved as the test set. Thre aerosol s"ze distributions frorri categories 4 to 11 were 'ised tL Stidy the operational properties of the trained neural network and, Inl tairticular, to investigate, the capability of the trained network to generalize, recognize, and classify PSDFs fir which it has riotbeen trained
V.
NEURAL NETWORIK EXPERIMENTS
,Neural network expvriurrerits were carried out using the aerosol data sets described above. The net works were simnulatedl ]i soft ware on a Compaq 3186/20 computer with a neural network simulator program tliveb ped b~y California Scierntific Softwarte [It)1. 'lie experiments onl training of the neural network w, ., N'
rforrue-d with Ire smroothiinig parameter it
0.1 and thle learning rate paramet er Yj =1 .0, unless oth 'rwise
indicated. The neural net work, which consisted of 48 input neurons in the input layer, 2 output neurons in i rer of hidden neurons Ii the hiidden layer, was frully i nter~ on nected , viz., Ihe outpuint layer, anid a variable numb
iClhIiwnulron in tire in prit layer was con nectedl to every nieu ron in thle hidden iaver arid, iii turn, each neur on in)thre hidden layer was connected t~o every neuron in thre output layer. Each of the 418 neurons in tire input laye,(r was "clarnped" to the value of thle aerodynanmic particle size distribution in one of the corresponding,48 size Intervals or binls Training proceeds by presenting the PSDFs in tire training set to thre neural network ,-iIId a training cycle will refer to one presentation of all (75) PSDFs in tCre training set to the network. The desired oujtput response of the network was chosen so that a(erosol size d istribu t.ions inl categories 1, 2, and 3 tg,;vo out pit neunrm responses (0,1), (1,0). and (1,I), respectively. These responses identify the three pat tern tlasses in) tire training set. Th'le Connection strengths (weights) in thre neural network were initialized with rainidomi values drawn fronti a uini formi dist ribuition withr a ranige fromt
-1.
to 1. Training of the net work with
lie- loiuk-propagatioii learning algorillhim proceeded mit i the all output responses weewithin a tolerance of 10I) lieri
of I lie desired responses.
UNCLASSIFIED
UNCLASSIFIED
7
A set of learning curves which characterize the speed of convergence (i.e., learning speed) of the back-propagation rule for adjusting
hie weights of the( network was desired.
One - alization of a set of
lariing c:urves (percent of the( mint/output pairs in tie( training set c().ectlv tiaped as a fiitictioii
fiftlie
niumiber of training cycles) of the net work is shown in Fig. .1 for the( specified tnimber of hiddent neurons. it this figure. the lit rning curves are plot tedl for iieural rietw,- ks with n =3, 5. 7, It), and 20 hiddeni uits. Observe that thle learning rates of Ihle networks generally inicrease with itnincrease in ioden units since tie( utse of nmore liildtiu units provide a greater flexibility Ii
tlie,
tlie
number of
network encoding process
Futrthlernmore. altlioiigli there is a significantly faster leartning rate fo(r the network with 10 hiddelln tti-o comnparedl with tilie net work with :3 hidden neurons, trlli
imtprovenient iii le:'-itiig rate do~es not sen to
(cAiitiiiie for networks wvithI more than 10 hidden utits- Indeed, the( networks with 10 and 2k) hidden units have almtost identical iear iig
i;:i
T
The smooth ensemble average learing curves were
oljtailietl
liv
thle average of 20 individual lwarning curves thal correspond to the use of different ranidomly sei cted
nitial weight valuies, The rei i'
'jeliavior.
Its ar, lpresettted in Fig. 5 or net works withIi i
3, 5. ;in( 10 :,iddenl neurons.
effec t of the Iwarning rate, parameter q onl thle learning buhavior of the netwvork is exhibited in Fig. 6.
11*re. the( niuber of training cycles required to fully train the nrtwork is plotted against thle number of hiidden units in the network for two values of thle leariting rate p- rameter, nanmely rl
1 .0 and I .5.
As
expected,. incretsing thle learniing rate parameter results in an improvement in the learning behavior (I e., less training cycles are reqluiredl to train thle network) for a specified number of hidden units. However, it is itiportant to emphasize that if q~ is chosen too large., tile back-propagation algorithlm exhibits instability tld fails to converge properly. Also evidett
ii
Fig. 6 is the (decrease lin the learning rate withl atii increasew lit
ie( nuimiber of hidden units in the network.
After tilie networks were fitlly tratined, it was foi u
that inpu~t, of tilie lPS1) Is Mithle te'st Set to thle
itworks provided recognit ion accuracies of 100 percent, for all the networks tiained, viz. for networks with iiimlwrs of hidden tieurons ratnginhg from :1to 20. Next,, we investig;ated thle effects of noise onl thle recognition
pverformance of
tilie
neuiral tiet work. All the( following experiments involved neural networks withI 20 hiddell
iiiits. It is itmportanut that the network be robust itt the sense that slight to moderate p~erturb~ations intith *,ystemn (i.e., degradatiotis in t lie cotitect iou
affect tile rerognuitioti performnance.. * .li
stretigthls of tie fully t rained network) should not adversely
Tlowards this purpmo, consider, for exaiuille
tOli
representative result
it d in, Fi8, 7. 'I'lie figure shows tie, recognition accuitracy of the nieiural net work onl the test set, after
all tilie weights itt the trained iiet work had been corrupt ed with zero- mean Gaussian dev iat ion adj tist ed to provide thle requi redi root- neati -squ are d#fi tied by I te ratio (r,,
sigtual, re-spectively. h'ittillii tielevel.
all thi
t lie
tioise wi
th thle stanidara
(Wh~IS) nolk-e level. The hiMS noise level is
.c expressedl as a pi (en agewer
antI
T') ar'' t
ie varianices iti the( noise anid
Observe tHat t ho recognitinii pe'rformtancie of (,te tte.work was relatively Insenitive to conliuect
efiite
lo
weight's till to a hNIS nloise level of about 201 hutruluit
of tilie itt work deteriorated lrt-ciitotsy withI the adlit it U NCLASS I FIED
Ilov
cr, after t his
offijirther
tuoise
to)
UNCLASSIFIED the weights. Furthermore, similar results were obtained when the weight- wc=_
8 corrupted with non-Gaussian
noise (e.g., a noise process drawn from a uniform distribution). Consequently, the neural network model is relatively fault-tolerant to perturbations in the components of the system. Fig. 8 exhibits the result of training the neural network with a noise corrupted training set. 'This figure shows the recoguition performance of the network on the test set after training the network on a training set corrupted with noise at the sp-,cified level. Observe that the trained network achieved an recognition accuracy of 100 percent for a RMS noise level of up to 10 percent on the training patterns. After this noise level, the performance of the network monotonically decreased (albeit, rather slowly) until it
pie idldc, a ri-cognition aceuracy of 70 Iercent at the 50 percent RMS noise level.
Il itat
It should be noted
lese highr levels of noise degradation, the input PSDFs are no longer consistent, with the result
I hal liwnetwork cannot b, trained to classify the training set with an accuracy of 100 percent. In fact, it
, (,,-,rv.d in tls,
experiueits that the recognition accuracy of the trained network on the test set was
r,,ughly equal to the recogntitiot performance on the training set. Along the same theme, Fig. 9 depicts the r,.ogntion performance of a trained network on the test set that has been degraded with different levels f nolis.
Note that this performance curve is remarkably similar to that in Fig. 8. Again, the recognition
rate (of the network remained at 100 percent, for up to 10 percent RMS noise level in the test set. Above this level, the performance gradually decreased until a recognition accuracy of only 40 percent was achieved at .55 percent RMS noise level.
Along these lines, Figs. 10 arid 11 display representative output neuron
rrsponises (i.e., activation levels of output neuron 2 versus that of output neuron 1)of the trained network to t
,t sets
that have been corrupted with RMS noise at the 5 and 25 percent levels, respectively. Observe
hat th th tree categories of lPSI)Fs in the test set produced the expected clustering patterns in the output r,.sponse space with the scatter within these clusters increasing with the noise level. In summary, the results in Figs. 7 to I I indicate that the recognition performance of the neural network model is reasonably tolerant
1,)lgralations ii the connection weights arid to variations of PSDFs in the training and test set. We remark I tat the insensitivity of the neural network to these forms of degradations is not surprising since it is the
inherenit parallelism and built-in redundancy embodied in the various interconnections of the network that render this forni of computational paradigm so attractive for processing of data involving incomplete and/or lhegradi, informat ion. The litxt series of experimlnitt.s investigates the ability of the fully trained neural network to form i,.at
i rtgfl lgereralizationis on arosol size distributions for which it has never been trained. Specifically, we
;ir,. M1,.r,.-st,d in the ability of the trained network to function as a featuretmap classifier for a number of titaleled particle size distributions where the number of categories is unknown a priori. In the following xperiiments, a neural network with 20 hidden units was trained on the training set and then presented with a m1unib)1er of PSI)Fs that it. has never "seen". In Figs. 12 and 13, we show the output network response to It cot
,tiig of
a railoi mixture of 25 PSI)Fs from each of categories I to 6 for a total of 150 PSI)Fs. UNCLASSIFIED
UNCLASSIFIED
9
Observe that the PSDFs from classes 1, 2, and 3 (i.e., the classes which the network was trained to recognize) cluster in the expected positions in the output response space. Note that there is no scatter in the responses of the network to PSDFs from classes I and 2, indicating that the PSDFs from these classes are highly reproducible. The lPSDFs from classe -1, 5 and 6 (i.e., three classes for which the network has not been trained) yielded clusters of points in the output response space with centroids at (0.55,0-35), (0.35,0.95), and (1.0,0.5), respectively. It is interesting to note that the Irained network seems to have formed ineaningful generalizations from tie training examples. In particular, PSDFs from class 4, which are composed of a superposition of aerosols froni classes I and 2, are clustered roughly about a point in the output response space that lies on the line connecting (0,1) (cluster point for PSDFs of class 1) and (1,0) (cluster point for PSDFs of class 2). A similar statement can be made with respect to the centroids of the clusters for PSI)Fs of classes 5 and 6 (mixture of aerosols from classes I and 3 and 2 and 3, respectively) which roughly lie on the lines connecting the points (0,1) and (1,1) (cluster point for PSDFs of class 3) and (1,0) and (1,1), respectively. Fig. 14 shows the output, response of the neural network to a set comprised of PSDFs from class 7 which is a mixture of aerosols from classes 1, 2, and 3. The centroid of the cluster in the response space is located at the point (0.84,0.73). Observe that this point lies within the triangle whose vertices are (0.1). (1,0), and (1,1) which are the centroids of the clusters for PSDFs from classes 1, 2, and 3, respectively. Next, we study the ability of the trained network to classify bacterial aerosols. Fig. 15 illustrates the network output response to a data set composed of PSDFs from categories 1, 2, 3, 8, and 9, with each category contributing 25 PSDFs. The PSI)Fs of classes 8 (0.6 pim PSI, particles) and 9 (Eli) produced clusters in the response space with centroids at (0.38,0.87) and (0.11,0.90), respectively. Only one sample PSI)F from class 9 was incorrectly placed. Next, a data set was constructed from PSI)Fs from classes 3, 9. 10, and 11 and used as input to the trained network. The output responses of thle network for this data ,-t
ar ,- shown in Fig. 16. Observe that t lie network was able to separate the various clakses of I'S[)1's and
plae them in distinct clusters in the output, response space. Indeed, only 2 PS)Fs from the data set were incorrectly placed to provide a classification accuracy of 98 percent. Of interest is the fact that the network was able to recognize the difference in the shape of PSi)Fs between native and "clean" BG. It is hypothesized that washing the native 1G removed extracellular material from tlie cell wall of the bacteria which resulted in a subtle alteration in the aerodynamic properties of tie cell. This alteration produced a subtle change in ti,, shape characteristics of the aerodynamic particle size distribution which was recognized by the traited ti ural network. With regard to tle latter point, ti
cernt roids of the clusters formed froni PSDFs of classes
10 (native BG) arid 11 ("clean" 13G) are located at (0.20,0.95) and (0.60,0.87), respectively. As a final example, ai, experiment was conducted to study the response of the trained network to an aerosol PSI)F that slowly evolves over a given interval of time. Towards this objective, all aerosol of "clan" B(; was slowly slrayd into an aero.,ol chalmber and the particle size dist ribut inn of the evolving inixt uir' im lieh chamber was mne.sur'd every :1 seconds with aii APS. A total of 1(10 I'SI)l's was measured UNCLASSIFIED
UNCLASSIFIED
10
over a period of 300 seconds arid this suite of PSDFs provided a "spectrogram" of the evolhing PSDF in the chamber. A data set was constructed from these 100 PSDFs and 25 PSDFs from category 3. The output responses of the neural network to this data set are exhibited in Fig. 17. Observe that the PSDFs from class 3 ar, clustered about the expected position. The responses of the network to the PSDFs of the "spectrogram" generally displayed an ordered trajectory of points in the response space that is indicative of an evolutionary behavior. These points eventually clustered about the point (0.60,0.87), which coincides with the centroid of the response cluster for "clean" BG (cf. Fig. 16). This clustering of points in the response space corresponds to that portion of the spectrogram where the PSDFs have reached a steady-state in the aerosol chamber. At this point, the PI)SDFs no longer change shape as a function of time. VI.
CONCLUSIONS
In this paper, we have applied a neural network model for the recognition and classification of a number of aerosol particles (e.g., environmental, bacterial, and artificial) based on their aerodynamic particle size distribution as measured with an Aerodynamic Particle Size analyzer.
It was demonstrated
1hat a fully interconnected three-layered neural network (48 input neurons, a variable number of hidden iturons, and 2 output neurons) with nonlinear sigmoid units for thresholding can be trained with the standard back-propagation learning algorithm using a training set consisting of 25 PSDFs from each of three cla.sses of aerosols (one atmospheric and two polystyrene latex particle standards).
It was found that a
recogniti n rate of 100 percent can be obtained for the training set using neural networks with three or more hidden units and that there was a monotonic increase in the learning rate (viz., a smaller number of passes through the training data) with an increase in the number of hidden units in the network. However, it is important to emphasize that there was virtually no increase in the learning times of the networks with more than 10 hidden neurons. Furthermore, it is interesting to note that the performance of the networks did not deteriorate when the number of hidden units was increased beyond 10, despite the fact that for these nv"Norks, thr -~imher of connection weights that have to be adjusted greatly exceeded the number of training data. In this respect, the back-propagation rule appears to be stable for underdetermined problems. After training, the connection weights were frozen at their final values and a further pass through the test data set consisting of 25 PSDFs from each of the same three classes of aerosols represented in the training set, yielded a 100 percent recognition rate. Evidently, the trained network has properly encoded the significant characteristic features in the PSDFs to permit effective recognition and classification of these three aerosol reLasses. Experiments were conducted to study the performance characteristics of the neural network as a lunction of the quality of data used for the training set and the test set and of the inclusion of random noise in fli, cornnection strengths of the trained network. Firstly, it was found that the neural network is structurally robust in the sense that deviations in the connection weights (i.e., up to about 20 percent RMS noise in all
UNCLASSIFIED
UNCLASSIFIED
11
the weights) (did not adversely affect the recognition accuracy of a fully trained network. Consequently, the neural network paradigm, with its high degree of parallelism and redundancy in interconnect ions between neurons, functions as a very fault-tolerant pattern recognition and classification system. Secondly, it was found that the neural network was robust with respect to the type and level of noise corrupting the data in bth the training and test sets. In this regard, the neural network was able to perform
adequately in the
face of uncertainties introduced as the result of undesirable disturbances in the data. This is in contrast to all statistical techniques for pattern classification which are invariably affected by noise type and level. Consequently, the neural network model is more suited for classification of signals from systems where one is confronted with ignorance of the statistical characteristics of the noise corrupting the signals. After the neural network has been fi, ly trained, it was shown that the network was capable of forming
reliable generalizations to 'Sl)Fs that, it has never "seen". In other words, a properly trained neural
network can be used to rapidly characterize and classify airborne environmental, chemical and biological, and artificial aerosols with a high accuracy rate. Indeed, it was demonstrated that a neural network that was trained to recognize and classify only three categories of aerosols can be used effectively to classify aerosols from eight other categories for which it has never been trained. It was shown thatr the aerosols from these eight categories produced separable clusters in the output response space of the trained network. Consequently, the trained network was shown to be able to group PSI)Fs of unknown type into similiar categories for the case where the number of cluster categories was unknowni a priori. Indeed, for a properly trained neural network, cluster classification accuracies of better than 98 percent were obtained for all eight aerosol classes utilized. This rather surprising classification performance on unknown PSDFs indicates that the trained network had properly encoded the characteristic features of the PSI)Fs of the training set in the connection strengths and had been able to generalize this encoding to extract characteristic features in the un known PSJ)Fs and to use this iiformation to form appropriate cluster categories for the PSI)IVs in the outp u t response space. II view of this, a properly traie(d neural network coupled to an A PS p)rovides one possibility of recognizing, characterizing, and classifying aerosol particles iii real-t iuie.
UNCLASSIFIED
UNCLASSIFIED
12
REFERENCES 1. McCulloch, W. S. and Pitts, IV., "A Logical Calrulus of the Ideas Imminent in Nervous Activity", Bull. Math. Biophys., Vol. 5, 115-133, 1943. 2. Rosenblatt, F., Principles of Neurodynamics: Perceptrons and the Theory of Brain Mechanisms, Spartan Books, Washington, D. C., 1961. 3. Widrow, B., "Generalization and Information Storage in Networks of Adaline Neurons", in SelfOrganizing Systems, Yovitz, M.C., Jacobi, G. T. and Goldstein, G. (eds.), Spartan Books, Washington, D. C., 435-461, 1962. 4. Minsky, M and Papert, S., Perceptrons: An Introduction to Computational Geometry, MIT Press, Cambridge, MA, 1969. 5. Rumelhart, D. E., McClelland, J. L. and the PDP Research Group (eds.), Parallel Distributed Processing: Explorations in the Microstructure of Cognition, Volume 1: Foundations, MIT Press, Cambridge, MA, 1986. 6. Rumelhart, D. E., McClelland, J. L. and the PDP Research Group (eds.), Parallel Distributed Processing: Explorations in the Microstructure of Cognition, Volume 2: Psychological and Biological Models, MIT Press, Cambridge, MA, 1986. 7. Rumelhart, D. E., Hinton, G. E., and Williams, R. J., "Learning Internal Representations by Error Propagation", in Parallel Distributed Processing: Explorations in the Microstructure of Cognition, Rumelhart, D. E., McClelland, J. L. and the PDP Research Group (eds.), MIT Press, Cambridge, MA, 318-362, 1986. 8. Widrow, B. and lloff, M.E., "Adaptive Switching Circuits", in IRE WESCON Cony. Rec., pt. 4, 9G-104, 1960. 9. Widrow, B. and Stearns, S. D., Adaptive Signal Processing, Prentice-Hall, Englewood Cliffs, NJ, 1985. 10. BRAINMAKER: Users Guide and Reference Manual (3rd Edition), California Scientific Software, Sierra Madre, CA, 1989.
UNCLASSIFIED
SR 531
UNCLASSIFIED
TABLE I Summary of class notation used for aerosol size distributions.
Numerical assignment
Aerosol particle descriptor PSL particles (1 pim)
I
PSL particles (3 vn,)
2
Atmospheric
3
PSL particles (1 and 3 pm)
4
PSL particles (1 pm) and atmospheric
5
PSL particles (3 pm) and atmospheric
6
PSL particles (1 and 3 pim) and atmospheric
7
PSL particles (0.6 pmn)
8
Erivinia herbicola (2.5 x 0.5 pm)
9
Native Bacillus sublilus var. globigii (1.5 x 0.5 pm)
10
-(-lean" Bacillus subtilus var. globigiz (1.5 x 0.5 pim)
11
UNCLASSIFIED
UNCLASSIFIED
SR 531
4)
44 p44
F4G)F
1.
0
m
Schematic of the architecture of a feedforward three-layered neural network.
UNCLASSIFIED
-!
UNCLASSIFIED
C4
FIGURE 2 The components of a single processirg unit (neuron).
UNCLASSIFIED
SR1 531
SR 531
UNCLASSIFIED
1.00
0.80
0.60
0.40
0.20
-5.00
-3.00
-1.00
x
1.00
3.00
5.00
FIGURE 3 Thp sigmoid function with unit gain that serves as the threshold or activation function for a neuron.
UNCLASSIFIED
Sit 531
UNCLASSIFIED
100.00
&&p!
L
m-
80.00
-
0
60.00
Qo 40.00 0
3 Hidden Neurons Hidden Neurons S--5 -- u-u-u- 7 Hidden Neurons 10 Hidden Neurons 20 Hidden Neurons o .-
20.00 0.00
0
40
20
60
Training cycle
FIGURE 4 )nc re;lization of learning cuirves for neural networks with 3, 5, 7, 10, and 20 hidden neurons.
UNCLASSIFIED
UNCLASSIFIED
SR 531
100.00
80.00 4
-J
Q)
o0 ~-60.00
1366683
o
&A*A
Hidden Neurons
5 Hidden Neurons 10
Hidden Neurons
-4--i
Q0
40.00
200
20.00
010
20
30
40
Training cycle
FIGURE 5 1Lnserrnble average learning cuIrve~s coiist ric ed from 20 individual realizations of learning curves for networks withi.3, 5, and 10 hidden neuronls.
UNCLASSIFIED
SR 531
UNCLASSIFIED
70
C/) (D 60
C5
50
.c:\
==
"/ =1 5 1.5 1 3-6--~-7 7
C40
c- 40
7-7'' = 1.0
30-
0 L-
ci)
20
E0 E10:
0
5
10
15
20
25
Number of Hidden Units
FIGURE 6 Nmiid,'r of traifiig cycles v'rsis Ilc niumber of hidden units for two values of the learning rate parameter
.
U
UNCLASSIFIED
UNCLASSIFIED
SR? 531
100.00
80.00 Q-)
0 60.00 C-) 0 00
20.00
0.00
5.00
10.00
15.00
20.00
25.00
30.00
RMS Noise Level
FI(;UI.7 R1crognition arrulrarv oii theI test set versuis the RMS level of noise corrupting all weights of a trained network with 20 hidden units
UNCLASSIFIED
UNCLASSIFIED
SR 531
100.00
90.00 Q) 0 0 80.00 4
-
(i) 0
CL
70.00
6 0 .0 0
,, , ,, , , ,, , ,, , , ,, , ,, , , ,,1,,
0.00
10.00
20.00
30.00
40.00
, ,,1,
50.00
,, , ,
60.00
RMS Noise Level (Input)
FIGURE 8 I,.'ogniition perfornmance of a neural network on the test, set. The network was trained on the training set corrupted with a prescribed RNIS level of noise.
UNCLASSIFIED
UNCLASSIFIED
SR 531
100.00
80.00 0Q)
0 60.00 4-j
c0
0.-
40.00
2 0 .0 0 ' '' '' ' '' ' 'l ' ' ' , , ' ' ' ' ' '' ' ' , , , ,, 0.00 10.00 20.00 30.00 40.00 50.00 60.00
RMS Noise Level (Input)
FIGURE 9 Recognition performance of a trained neural network on the test set that has been corrupted with the prescribed RMS level of noise.
UNCLASSIFIED
UNCLASSIFIED
SR 531
1.00
0
0.6
00.60
u000
PSDF
2
A,&AAA
PSDF 3
0.40
0.60
C 0.40 0
Z 0.20
0 .0 0
,,,,,,,,,I,,i
0.00
,,
0.20
Neuron
,,
,
Il,
0.80
,,
,,
,
1.00
1 (Output)
FIGURE 10 (M llu
r('iral network responses to the test set thal has been corrupted at, 5 percent. RMS noise level.
UNCLASSIFIED
UNCLASSIFIED
1.00
AA
SR 531
A
A
A
:3
.-- 0.80
zA
4-A D 00.60-
*
PSDF 1
mm[]m
oooiooo PSDF 2 ,,/,, PSDF 3
(N c 0.40
0 :3
[
()
Z 0.20 CP
0E 00 0 .0 0
0.00
1 1 1 1 1 1 T-
0.20
=
-,
II rI,
I I
,,
0.40
Neuron
0.60
I,I I I
,I I
0.80
0
,I I I ,
1.00
1 (Output)
FIGURE 11 Output neural network responses to the test set that has been corrupted at 25 percent RMS noise level.
UNCLASSIFIED
UNCLASSIFIED
SR 531
1.00
PSDF 1 -DDDD PSDF 2
,0.800.mu80
00.60
AL LA
PSDF 3
AAAAA
PSDF 4
s's..
PSDF 5
C 0.40 0 0.20
0. 0
0.00
I I1 1 1 1 1 1
C.20
1 1 1 1 11 1
I I
1 1[ 1 1 1 1
0.40
0.60
l
l
l l
l l
0.80
l
l l
l
1.00
Neuron 1 (Output)
FIGURE 12 Otitput neural network responses to a data set consisting of a mixture of 25 PSDFs from each of categories I to 6. This figure only displays the responses of PSDFs in catcgories 1 to 5.
UNCLASSIFIED
SR 531
UNCLASSIFIED
1.00
PSDF PSDF 21
m-,n.
,0.80
0100
PSDF 3 +++++ PSDF 6
t
2_
AA
0 0.60
c 0.40 0 Q)
0.20
0. 00
0.00
.. . .
0.20
.. . . .
0.40
0.60
. . .
0.80
1.00
Neuron 1 (Output)
FIGURE 13 Output neural network responses to a data set consisting of a mixture of 25 PSDFs from each of categories I to 6. This figure only displays the responses of PSDFs in categories 1, 2, 3, and 6.
UNCLASSIFIED
UNCLASSIFIED
SR 531
1.00
,,0.80
4 -j
0-
====ons PSDF 1 ooooo PSDF 2
00.60
"
' PSDF 3
000oo
PSDF 7
C 0.40
0 0:3
(I) Z 0.20
0 .0 0
0.00
I I I I I
I
I I I I I I
0.20
I
I I I
I
I I I
0.40
I
0.60
0.80
1.00
Neuron 1 (Output)
FIGURE 14 Outiput neural network responses to a data set consisting of a mixture of 25 PSDFs from each of categories 1, 2, :3, and 7.
UNCLASSIFIED
SR 531
UNCLASSIFIED
1.00 it
0.80
4_j
PSDF 1 ooooo PSDF 2
0-60.60-
tAb
mu"''
PSDF 3 o00000 PSDF 8 xxxxx PSDF 9
C 0.40
0
x
0
(Q)
0.20
0 .00
, , ,
0.00
,
,,
0.20
,
I
,
,
0.40
,
0.60
, ,
, ,
0.80
,
,
,
1.00
Neuron 1 (Output)
FIGURE 15 Output neural network responses to a data set consisting of a mixture of 25 PSDFs from each of categories 1, 2, 3, 8, and 9.
UNCLASSIFIED
SR 531
UNCLASSIFIED
1.00
,o0.80
4-0
PSDF 3 00000 PSDF 9
00.60
00000. PSDF 10 S**** PSDF 11
(N C- 0.40
0
0
Z 0.20
0.00
-
0.00
1
I,
0.20
1
1
1
1
1
jI
0.60
0.40
Neuron
1
1
1
1
11
11
0.80
1it
1
1
I-
1.00
1 (Output)
FIGURE 16 Output neural network responses to a data set consisting of a mixture of 25 PSDFs from each of categories 3, 9, 0 and 1).
UNCLASSIFIED
SR 531
UNCLASSIFIED
1.00
0.95
0.90
0,0.85
*
(N 0.80
o z
PSDF 3
" "
PSDF (evolutionary) 0.75 *
0.70
0 .65 0.00
. . . .. . .
0.20
I
.I..I.I..
0.40
0.60
I
I
I
I
IT
0.80
l
1.00
Neuron 1 (Output) FIGURE 17 Output neural network responses to a data set consisting of a suite of 100 evolutionary PSDFs corresponding to the "spectrogram" from the aerosolization of Bacillus sublilus var. globigii in an aerosol chamber and of 25 PSDFs from category 3.
UNCLASSIFIED
SECURITY CLASSIFICATION OF FORM (highest classification of Title. Abstract. Keywords)
DOCUMENT CONTROL DATA (Securltv classification of titll@, body of abstract and indexing annotation must be entered when the overall document is classifiead)
1.ORIGINATOR (the name and address of the organization preparing the document Organizationts for whom the document was prepared. e.g. Establishment sponsoring a contractor's report, or tasking agency. we entered in section 6.1
2. SECURITY CLASSIFICATION (overall security classification of the document. including special warning terms if applicable)
UNCLASSIFIED
Defence Research Establishment Suffield Box 14000 Medicine Hat, Alberta, TiA 8K6
TITLE tire compiete document title es indicated on the title page. Its classification should be indicated by the appropriate abbreviation (S.C.R or U) in parentheses after the title.)
3
N',TURAI, HETtWORK RECOGNITION AND CLASSIFICATION OF AEROSOL FARTTCLE SIZE DISTRIBUTIONS (U) 4.
AL7THORS
YEE,
(4ast name, first name, middle initial. if military, show rank, e.g. Doe. Mal. John E.)
Eugene and HO,
Jim
5. ATE CF P..2.ICATION (month and year of publication of do-zurentI January
1990
(total 6a NO. OF PAGES containing information. Include Annexes, Appendices, etc)
bo. NO. OF REPS (total cited in document)
34
1
E. DE=SCRIPTIVE- NOTES (the category of the document. e.g. technical report, technical note or memorandum. If appropriate, enter the type of report. e ;. interim, progress, summary, annual or final. Give the inclusive dates when a specific reporting period is covered.)
SR 5V1 8
JUNE i989,
,'FINAL)
SPONSORING ACTIVITY addoress.)
OCTOBER 1989
(the name of the department project office or laboratory sponsoring the research and development Include the
9a PRO2IECT OR GRANT NO. (if appropriate, the applicable research and develcoment prolect. or grant number under which the document was written Please tpecily whether pro;ect or grant)
PCN1T.
ICa
rlo. 2% 1
CRIG;NA1OR'S COCUIMENT NUMBER (the off icial document rurnoer by wrrch the document is identified by the originating activity Tnis number must be unique to this document)
I COCUJV=-*T AVAILAB..;TY N1 -
9b. CONTRACT NO. (if appropriate, the applicable number under which the document was written)
JnIrlimited distribution IC:St'ibul.iori lirmi.d to is',ribui~ion I-nited to D':,bu:,jn limited to IDisi.iti.,-icri Ihnitd to iOihe- 'c.ease specify):
1Ob. OTHER DOCUMENT NOS. (Any other numbers which may oe assigned this document either by the originator or by tne sponsor)
(any Iimitaticris on further dissemination of the document, other than those imposed by security classification) defence departments and defence contractors; further distribution only as approved defence departments and Canadian defence contractors: further distribution only as approved government departments and agencies further distribution only as approved defence departments; further distribution only as approved
*2. CCOCUME% ANNOUNCEMENT (anv limitation to the bibiiographic announcemert' of this document This will normally correspond to t'e Docon'e'i,. AvatlabiI'. W11.However, wnere further distribution (beyond the audience specified in 11) is possible, a wider an.ouncereni ajceice may be selected.)
UNCLASS IF IED SECURITY
CLAESIFiCATION OF FORNM
UN CLAS S TFT ED SECURT
13
ABSTRACT
( a brief and factual
.
CLASSIFICATION OF FORM
Summary of the document It may also appear elsewhere
in the body of the
document itself.
It rS highly
desirable that the abstract of classified documents be unclassified. Each paragraph of the abstract shall begin with an indication of the security classification of the information it the paragraph (unless the document itself is unclassified) represented as (S). IC), (R, or wi). It is not necessary to include here abstracts in both offical languages unless the text is bilingual). This paper describes the application of a neural comiputational network mnodel to the patterni recogill io[oil d
I witeritil
classification of a rodynanic particle size distributions associated %vithI a number ofecnv ironiiinitil and artificial aero ,als. Tlie avrodyttaiiiic particle size distribution- are nieasurcd in real-tiiiic withI
hig-h rosotution using a two-spiol, 1k-Ne laser velocirneter. The technique ciiiployed hecre for (lhe recognition01 .uiil
cl;isificatioit of aerosols of unknown origin is based on a three-layered neural network that has beeii
r;iiried onl a training set consisting of 75 particle size distributions obtained frorn three (list inct tvpes of wr sols.
T[he training of the neural network was accomiplishied with the hack-propagation learinig algo-
11111 1li0
1-1ItIsOf the
nuitriher of processing initits itt t le hidden layer and the level of noise;( corruptiiig
i ,Ir;niiiiig si't, the test set, and the connection weights onl the learning rate and classification (Ilicielicy ()f t iiiral tiet work are studiied. T[he ability of' thle t rainied network to genteralize from thii finite iiiiiliber .1" disi ribut ions in the
trrat
'if
mug set to unknown size dist ribut ions obtained froin uncertain and iiifaimiilliar
iiroinienrts is Investigate 'The
approach ofle-rs the opportunity of rec:ognizing, classifying, and cliarac-
friling aerosol particles ill real-timec according to their aerodynamic particle size spectrumi and its li-i'h rcigu iitioni accuracy shows considerable promise for applications to rapid real-tlime air inoititoring in) lhoi iras of occ upational health and air 1)011111 ion standards. 4 KEYWORDS, DESCRIPTORS or IDENTIFIERS (technically meaningful terms or short phrases that characterize a document and could be helpful in cataloguing the document They should be selected so that no security classification is required. Identifiers, such as equipment model designation, trade name. military project code name, geographic location may also be included. If possible keywords should be selected rom a published thiesaurus. e.g. Thesaurus of Engineering and Scientific Terms (TEST) and that thesaurus- identified If it is not pcssible to select indexing terms which are Unclassified, the classification of each should be indicated as with the title.)
NEURP.T NETWORK ,ATTERN RECOGNITION (ADAPTIVE) i-RGPYNAMIC PARTICLE -TZE DISTRIBUTION ;PACT:ERTAL AEROSOLS ()JPT -A. PARTICLE SI-IN EACK-PROPAGATION LEARNING ALGORITHM (;O0MMECTTOt!TST ARCHITECTURES PARALLEIL DISTRIBUTED PROCESSING
UNCLASSIFIED