NEURAL NETWORKS FOR SIGNAL PROCESSING VII PROCEEDINGS OF THE 1997 IEEE SIGNAL PROCESSING SOCIETY WORKSHOP Seventh in a Series of Workshops Organized by the IEEE Signal Processing Society Neural Networks Technical Committee
Edited by Jose Principe Lee Gile Nelson Morgan Elizabeth Wilson
Published under the sponsorship of the IEEE Signal Processing Society in cooporation with the IEEE Neural Networks Council and co-sponsored by the Air Force Office of Scientific Research (AFOSR)
The Institute of Electrical and Electronic Engineers, Inc. New York, New York
PTIC QUALITY INSPECTED 4
1997 IEEE Workshop on Neural Networks for Signal Processing Proceedings Copyright © 1997 by the Institute of Electrical and Electronics Engineers, Inc. All rights reserved. Copyright and Reprint Permission Abstracting is permitted with credit to the source. Libraries are permitted to photocopy beyond the limit of U.S. copyright law, for private use of patrons, those articles in this volume that carry a code at the bottom of the first page, provided that the per-copy fee indicated in the code is paid through the Copyright Clearance Center, 222 Rosewood Drive, Danvers, MA 01923. Other copying, reprint, or reproduction requests should be addressed to: IEEE Copyrights Manager, IEEE Service Center, 445 Hoes Lane, P.O. Box 1331, Piscataway,NJ 08855-1331.
IEEE Catalog Number
97TH8330
ISBN
0-7803-4256-9 (softbound) 0-7803-4257-7 (microfiche)
ISSN
1089-3555
Additional copies of this publication are available from IEEE Operations Center P.O. Box 1331 445 Hoes Lane Piscataway, NJ 08855-1331 USA 1-800-678-IEEE 1-908-981-1393 1-908-981-9667 (FAX) 833-233 (Telex) email:
[email protected] The chapters in this book are based on presentations given at the IEEE Signal Processing Society Workshop on Neural Networks for Signal Processing.
Farm Approved OMB Wo. 0704-01B8
REPORT DOCUMENTATION PAGE
Public roportlna burden for this collection of information is estimated to avenue 1 hour per rtsponso. including Ute time for reviewing instructions, searching existing daia sources, Bothering and maintaining tne data needed, and completing and reviewing the collection or information, Send comments regerdlno this burden estimate or any otner aspect of this collection of information, Including suggestion« for reducing this Burden, to Washington Headquartera Services, Directorate for Information Operations and Reports, 1215 Jefferson Oavh Highway. Suite 1204, AfflUQton, VA 22202-4302, and to the Office Of Management and Budget Paperwork Reduction Project (0704-0188). Washington, DC 20503. 1. AGENCY USE ONLY (LBW$ Blank)
2. REPORT DATE
3. REPORT TYPE AND DATES COVERED FINAL
16 March 98
4. TITLE AND SUBTITLE 1997 IEEE Workshop on Neural Networks for Signal Processing
5. FUNDING NUMBERS G
6. AUTHORS See Attached Proceedings 7. PERFORMING ORGANIZATION NAME(S) AND ADDRESS(ES) Institute of Electrical and Electronics Engineers, Inc 446 Hoes Law, P.O. Box 1331 Piscataway, NJ 08856-1331 SPONSORING / MONITORING AGENCY NAME(S) AND ADDRESS(ES) Air Force Office of Scientific Research 110 Duncan Avanue. Room B11G Boiling AFB, DC 20332-80BO
PERFORMING ORGANIZATION REPORT NUMBER
10. SPONSORING/MONITORING AGENCY REPORT NUMBER F49620-97-1-0311
11. SUPPLEMENTARY NOTES
12a.
■
DlSTRIBUT|OJi/AVAJLABJL^
12b. DISTRIBUTION CODE
Igwioved tot subEe isiecfi^ Vi G A,
(5)
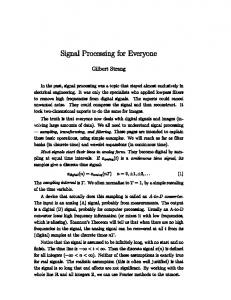
with t] the learning rate (a positive constant), w,- = [WJI,W»2] the weight vector of neuron i, v = [(ajtx7"),^] € V the current input vector, 5,- the two quantization regions that have neuron i as a common bound, and Sgn(.) the sign function taken componentwise. The effect of a single MER update is shown in Fig. 1A (thick dashed line). It can be formally proven that for a one-dimensional lattice, developed in one-dimensional space, MER yields an equiprobable quantization at convergence for any N [9], and that in the multi-dimensional case, MER yields a quantization which will approximate an equiprobable one at convergence for large N [10]. This implies that, e.g. for neuron j in Fig. IB, there will be an equal number of data points below and above j (i.e. in the light and dark shaded regions). Since this is the case for every neuron of the lattice, there will be, roughly speaking, an equal number of data points from the set {(afcxmT, r^)} above and below the piecewise smooth activation function ft (thick full line) at convergence. Furthermore, the neuron weights will represent the medians of the corresponding quantization regions: each weight vector will converge to the median, with the "median" defined as the vector of the (scalar) medians in each input dimension separately. (Note that there exists no unique definition of median for the higher-than-one dimensional case.) Finally, since a one-dimensional lattice is guaranteed to converge to an unfolded one in one-dimensional space [10], the lattice of Fig. 1A is guaranteed to converge to one which will always be unfolded with respect to the horizontal axis and, hence, we are assured to obtain a functional mapping. Finally, the efficiency with which the input statistics is modeled can be improved by considering several regression models in parallel and treat them as classes. Each model can be trained with the aforementioned MER/PPR combination on common or on separate data sets. In case of the former, a class membership definition is needed. After training, data compression can be performed using the weights and projection directions of the trained regression models; model selection occurs according to the class membership function definition adopted for this application.
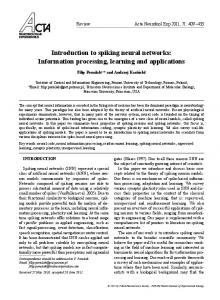
IMAGE COMPRESSION Training of regression models Consider a grey scale image I(i, j) sized M x M pixels in which we select an mx m region or block (Fig. 2). The selected region is divided in two parts: 1) the central pixel at row i and column j, and 2) the surrounding pixels (shaded area), termed surround(i, j). Consider now the regression fitting of the grey level of the central pixel as a function of the vector of grey levels of the surround: the pixels in the surround define an m x m — 1 dimensional vector of independent variables and the central pixel represents the possibly noisy measurement of the unknown function which is to be estimated. In order to better capture the local image statistics, we consider a total of L classes in parallel. Each class is represented by a regression model eq. (2) but with different projection directions and weight vectors. We divide the original image into L subimages sized M x M pixels. We assume a toroidal
Hbi H,
m
Figure 1: (A) Definition of quantization region in a one-dimensional lattice. The weights of the lattice are joined by line segments so as to yield the activation function /*. The thick full and thick dashed lines represent /* before and after the weights are updated once using MER, respectively. The thin dashed, vertical lines represent the borders of the quantization regions prior to updating the weights. The shaded region corresponds to the receptive field of neuron j and it comprises the quantization regions Hc and Hd- The present input is indicated by the black dot in Hc. (B) At convergence, there will be an equal number of data points in the dark and light shaded regions, below and above neuron j, respectively. The thick full line represents the piecewise linear activation function /*.
J Figure 2: Definition of central pixel at coordinate (i, j) and the vector of surrounding pixels (shaded area), termed surround(i,j).
extension for each subimage and a lateral shift of one pixel between two successive image blocks so that, in this way, we dispose of M2 measurements per subimage in an m x m dimensional data space. Each regression model is trained on a different subimage until convergence.1 The latter greatly simplifies the computational complexity of the algorithm, and the overall training time, and it alleviates the problem of how to properly initialize the regression models (see e.g. [7]). Definition of codebook vector and class membership Before we can perform image compression, we have to decide on the definitions of codebook vector and class membership. The latter will be similar but not equal to the one used in subspace classifiers. Assume that we use L classes of which the corresponding regression models consist of N neurons and K projection directions, for simplicity's sake. Each regression model is trained on blocks sized m x m pixels as explained in the previous paragraph. We now partition the image into nonoverlapping but juxtaposed blocks sized mxm pixels and project the mxni-l dimensional surround vector of each block (cf. Fig. 2) along the K projection directions of each class. The nearest neuron weight vectors (in Euclidean sense), along each of the K projection directions, are then used for discretizing the projected surround vector and the binary indices of these weight vectors for storing the discretized surround vector; the central pixel value need not be discretized (and stored) since it can be predicted from the regression model of the selected class. The discretized surround vector can be computed from its K discretized projection coordinates. Hence, for each class, we store the N x K weight vectors from which the NK codebook vectors needed for decompression can be determined. Finally, for cases in which L > 1, we use the following definition of class membership: for each image block, we use the class which produces the smallest sum of the following two quantities: 1) the quantization error between the projected and the original surround vector, and 2) the regression error between the predicted and the original central pixel value. The binary code of the selected class is then stored together with the binary code of the K discretized projection coordinates. Decompression is achieved when the binary codes are substituted for the corresponding codebook vectors; the central pixel value is obtained from the corresponding regression model. The image obtained in this way is termed the decompressed image. The quality of the decompressed image can be improved when, for L = 1, the regression model is applied to the decompressed image but now with overlapping image blocks. For L > 1, we can take a conservative approach by selecting the regression model which yields the smallest discrepancy between the central pixel value it produces and the one we had before in the decompressed image. Since we do not treat the subimages as preclassified data, we also considered the alternative case where a single training set is used and where training of each one of the L regression models continues on those training samples for which it yields the smallest regression errors until all samples are consistently represented. However, since this recursive approach yielded only a minor improvement for the case reported in the Simulation Results section, but at the expense of a much increased computational complexity and training time, we did not consider it further.
SIMULATION RESULTS In the simulations, we consider 8 bit images and surrounds sized 5x5-1 pixels (i.e. m = 5). We use lattices of N neurons, with cubic spline interpolation between the neuron weights, K projection directions and L regression models in such a way that (N + 1) x K x L = 64 (we use (N + 1) to account for the space needed for storing the codebook vectors). The compression ratio can be estimated as follows: for the original image we need 8 bits per pixel (6pp) and for the compressed image we need (N + 1) x K x L values or 6 bits to code for the vector of grey values of each m x m block in which the image is partitioned, i.e. 0.24 6pp. We run MER in batch mode (i) = 0.02) and determine, after each epoch, the MSE between the actual and the desired, equiprobable code membership function usage. We run MER until the magnitude of the difference between • the present and the previous running-averaged MSE is lower than 1.0 10-7 or until 15,000 epochs have elapsed; the present running average equals 10% of the present, unaveraged MSE added to 90% of the previous running average. In order to optimize C(ai), the procedure is run for the at taken as unit vectors; the components of the unit vector with the lowest residual error are then further optimized by performing hill descent on C(ajfc) in steps of 0.01; after each update, a* is renormalized to unit length. Finally, in order to further optimize the K projection directions obtained, we apply backfitting: we cyclically minimize C(&K) f°r the residuals of projection direction k, until there is little or no change (< 0.1%) or until 10 full cycles have elapsed. We also ensure that, after each update, at is renormalized. As an example, we consider the LENA image (Fig. 3A), sized 512 x 512 pixels at 8 bits per pixel. We modify the grey scale of the image from [0,255] to [0,10] and select L subimages sized 128 x 128 pixels (Fig. 3B) and use the 16,384 data vectors corresponding to each subimage for training the lattices as explained in the previous section. For the time being, we have considered only L = 1, 2 and 4. When L = 1 only subimage 1 is used, when L = 2 subimages 1 and 2 are used, and so on. In order to quantify the simulation results, we compute the MSE (MSEC) and the signal-to-noise-ratio due to quantization between the original and the decompressed image:
SNRC = 10\ogl0—^M^-—,
(dB)
(6)
with I the decompressed image. The results for the LENA image are summarized in Table 1; the second column lists the actual configuration used, abbreviated symbolically as L/N/K; the last two columns list the corresponding MSEC and SNRC values. We observe that the performance of MER/PPR improves when N is lowered from 15 to 7 so that L and K can increase. The decompressed image for L/N/K = 2/7/4 is shown in Fig. 3C. Using the same standard image, the results obtained with the OIAL and KLT algorithms are also shown in Table 1 [16]. The OIAL algorithm uses K = 4 projections and L = 128 classes and the KLT algorithm uses K = 4 projections only, both for 0.25 6pp but for blocks sized 8x8 pixels. We observe that MER/PPR performs reasonably well for N = 7, however, we hasten to
10
Figure 3: (A) Original LENA image, (B) subimages used for training, and (C) decompressed image obtained with MER/PPR {L/N/K = 2/7/4).
11
Table 1: Performances obtained with the MER/PPR, OIAL and KLT algorithms L/N/K MSEC SNRC algorithm
MER/PPR OIAL KLT
1/7/8 2/7/4 4/7/2 1/15/4 2/15/2 128/-/4 1/-/4
82.6 56.7 69.8 89.7 91.1 54.9 71.0
23.0 24.6 23.8 22.7 22.6 24.8 23.7
add that much more images should be considered before any judgment can be made.
CONCLUSION In this paper, we have introduced a new approach to lossy image compression using topographic maps and a technique similar to subspace classification. Within each class, a number of topographic, maps were trained so that a nonparametric, regression model of the local image statistics is obtained. The topographic maps were trained using our recently introduced rule, called the Maximum Entropy learning Rule (MER) [9, 10], in combination with projection pursuit regression (PPR) learning [11]. The use of PPR in combination with MER offers the advantage that we don't need a prohibitive amount of neurons for regression modeling in high dimensional spaces and a high number of input samples to allocate the neuron weights reliably (cf. the curse of dimensionality). Furthermore, and in particular with respect to small data sets, since with MER the neuron weights converge to the medians of their quantization regions, the regression models obtained will be less sensitive to outliers but, on the other hand, they will be more sensitive to biased noise. Fortunately, the effect of the latter can be reduced by backfitting. Finally, since we have essentially trained our topographic maps for nonparametric regression purposes, we could equally'well have considered noise cancelling as an application. This will be explored in our future work.
ACKNOWLEDGEMENTS The author is a research associate of the Fund for Scientific Research - Flanders (Belgium) and is supported by research grants received from the Fund for Scientific Research (G.0185.96), the Research Fund of the K.U.Leuven (F/95/138) and the European Commission (ECVnet EP8212).
12
REFERENCES [1] T. Kohonen, "Self-organized formation of topologically correct, feature maps," Biol. Cybern., vol. 43, 1982, pp. 59-69. [2] T. Kohonen, "Self-organizing maps," Heidelberg: Springer, 1995. [3] H. Ritter, and K. Schulten, "Combining self-organizing maps," Proc. Intl Joint Conference on Neural Networks 2, pp. 499-502, 1989. [4] V. Cherkassky, and H. Lari-Najafi, "Constrained Topological Mapping for Nonparametric Regression Analysis," Neural Networks, vol. 4, 1991, pp. 27-40. [5] R.C. Gonzales, and R.E. Woods, "Digital image processing," Reading Mass: Addison-Wesley, 1993. [6] E. Oja, "Neural networks, principal components, and subspaces," International Journal of Neural Systems, vol. 1, 1989, pp. 61-68. [7] R.D. Dony, and S. Haykin, "Optimally Adaptive Transform Coding," IEEE Trans, on Image Processing, Vol. 4(10), 1995, pp. 1358-1370. [8] T.D. Sänger, "Optimal unsupervised learning in a single-layer linear feedforward neural network," Neural Networks, vol. 2, 1989, pp. 459473. [9] M.M. Van Hulle, "Globally-ordered topology-preserving maps achieved with a learning rule performing local weight updates only," Proc. IEEE NNSP95 (Cambridge, MA 1995), pp. 95-104, 1995. [10] M.M. Van Hulle, "The formation of topographic maps which maximize the average mutual information of the output responses to noiseless input signals," Neural Computation, vol. 9(3), 1997, pp. 595-606. [11] J.H. Friedman, and W. Stuetzle, "Projection pursuit regression," Journal of the American Statistical Association, vol. 76(376), 1981, pp. 817823. [12] P.R Krishnaiah, and L.N. Kanal, eds., "Classification, Pattern Recognition, and Reduction of Dimensionality." Handbook of Statistics, vol. 2, Amsterdam: North Holland, 1982. [13] J. Hertz, A. Krogh, and R.G. Palmer, "Introduction to the theory of neural computation," Reading MA: Addison-Wesley, 1991. [14] Y. Linde, A. Buzo, and R.M. Gray, "An Algorithm for Vector Quantizer Design. IEEE Trans, on Communications, vol. COM-28, pp. 84-95, 1980. [15] S.P. Luttrell, "Code vector density in topographic mappings: scalar case," IEEE Trans, on Neural Networks, vol. 2, pp. 427-436, 1991. [16] S. Haykin, "Neural networks expand SP's horizons," IEEE Signal Processing Magazine, March 1996, pp. 24-49.
13
Entropy Manipulation of Arbitrary Nonlinear Mappings John W. Fisher III
Jose C. Principe
Computational NeuroEngineering Laboratory EB, #33, PO Box 116130 University of Floridaa Gainesville, FL 32611-6130
[email protected] [email protected]
Abstract We discuss an unsupervised learning method which is driven by an information theoretic based criterion. Information theoretic based learning has been examined by several authors Linsker [2, 3], Bell and Sejnowski [5], Deco and Obradovic [1], and Viola etal [6]. The method we discuss differs from previous work in that it is extensible to a feed-forward multi-layer perceptron with an arbitrary number of layers and makes no assumption about the underlying PDF of the input space. We show a simple unsupervised method by which multi-dimensional signals can be nonlinearly transformed onto a maximum entropy feature space resulting in statistically independent features.
1.0 INTRODUCTION Our goal is to develop mappings that yield statistically independent features. We present here a nonlinear adaptive method of feature extraction. It is based on concepts from information theory, namely mutual information and maximum crossentropy. The adaptation is unsupervised in the sense that the mapping is determined without assigning an explicit target output, ä priori, to each exemplar. It is driven, instead, by a global property of the output: cross entropy. There are many mappings by which statistically independent outputs can be obtained. At issue is the usefulness of the derived features. Towards this goal we apply Linsker's Principle of Information Maximization which seeks to transfer maximum information about the input signal to the output features. It is also shown that the resulting adaptation rule fits naturally into the back-propagation method for training multi-layer perceptrons. Previous methods [1] have optimized entropy at the output of the mapping by considering the underlying distribution at the input. This represents a complex problem for general nonlinear mappings. The method presented here, by contrast, is more directly related to the technique of Bell and Sejnowski [5] in which we manipulate
0-7803-4256-9/97/$ 10.00 ©1997 IEEE
14
entropy through observation at the output of the mapping. Specifically, we exploit a property of entropy coupled with a saturating nonlinearity which results in a method for entropy manipulation that is extensible to feed-forward multi-layer perceptrons (MLP). The technique can be used for an MLP with an arbitrary number of hidden layers. As mutual information is a function of two entropy terms, the method can be applied to the manipulation of mutual information as well. In section 2 we discuss the concepts upon which our feature extraction method is based. We derive the adaptation method which results in statistically independent features in section 3. An example result is presented in section 4, while our conclusions and observations appear in section 5.
2.0 BACKGROUND The method we describe here combines cross entropy maximization with Parzen window probability density function estimation. These concepts are reviewed. 2.1 Maximum Entropy as a Self-organizing Principle Maximum entropy techniques have been applied to a host of problems (e.g. blind separation, parameter estimation, coding theory, etc.). Linsker [2] proposed maximum entropy as a self-organizing principle for neural systems. The basic premise being that any mapping of a signal through a neural network should be accomplished so as to maximize the amount of information preserved. Linsker demonstrates this principle of maximum information preservation for several problems including a deterministic signal corrupted by gaussian noise. Mathematically Linsker's principle is stated I(x,y) = hY(y)-~hYlx(y\x)
(1)
where I(x,y) is the mutual information of the RVs X and Y, and h(^]) is the continuous entropy measure [4]. Given the RV (random vector), Y e W , the continuous entropy is defined as 00
fly(u) = - j lOg(fy(u))fy(u)du,
(2)
—00
where fY(u) is the probability density function of the RV, the base of the logarithm is arbitrary, and the integral is TV-fold. Several properties of the continuous entropy measure are of interest. 1. If the RV is restricted to a finite range in 5R maximized for the uniform distribution.
the continuous entropy measure is
2. If the covariance matrix is held constant the measure is maximized for the normal distribution.
15
N
3. If the RV is transformed by a mapping g: 9? -»9? new RV, y = g(x), satisfies the inequality
N
hY(y)!
/r(")= v tr
N > IKÜT»)-
r/= l
16
(4>
The vectors y- e 9? are observations of the random vector and K([ ]) is a kernel function which itself satisfies the properties of PDFs (i.e. K(U) > 0 and \K.(u)du - 1). Since we wish to make a local estimate of the PDF, the kernel function should also be localized (i.e. uni-modal, decaying to zero). In the method we describe we will also require that K([ ]) be differentiate everywhere. In the multidimensional case the form of the kernel is typically gaussian or uniform. As a result of the differentiability requirement, the gaussian kernel is most suitable here. The computational complexity of the estimator increases with dimension, however, we will be estimating the PDF in the output space of our multi-layer perceptron where the dimensionality can be controlled.
3.0 DERIVATION OF LEARNING ALGORITHM As we stated our goal is to find statistically independent features; features that jointly posses minimum mutual information or maximum cross entropy. Suppose we have a mapping g:5R -> 9? ; M < JV, of a random vector X e 9? , which is described by the following equation Y = g(a,X)
(5)
How do we adapt the parameters a such that the mapping results in a maximum cross-entropy random variable? If we have a desired target distribution then we can use the Parzen windows estimate to minimize the "distance" between the observed distribution and the desired distribution. If the mapping has a restricted range (as does the output of an MLP using sigmoidal nonlinearities), the uniform distribution (which has maximum entropy for restricted range) can be used as the target distribution. If we adapt the parameters, a, of our mapping such that the output distribution is uniform, then we will have achieved statistically independent features regardless of the underlying input distribution. Viola et al [6] has taken a very similar approach to entropy manipulation, although that work differs in that it does not address nonlinear mappings directly, the gradient method is estimated stochastically, and entropy is worked with explicitly. By our choice of topology (MLP) and distance metric we are able to work with entropy indirectly and fit the approach naturally into a back-propagation learning paradigm. As our minimization criterion we use integrated squared error between our estimate and the desired distribution, which we approximate with a summation. 1 2 J = 5 | i.fy{u)-fY{u,y)) du 1-2
(6)
In (6), Qy indicates the nonzero region (a hypercube for the uniform distribution) over which the Af-fold integration is evaluated. The criterion above exploits the fact that the MLP with saturating nonlinearities has finite support at the output. This
17
fact coupled with property 1 (i.e. as the integrated squared error between the observed output distribution and the uniform distribution is minimized, entropy is maximized) makes the criterion suitable for entropy manipulation. Assuming the output distribution is sampled adequately, we can approximate this integral with a summation in which u ■ e iR are samples in M-space and Aw is represents a volume. The gradient of the criterion function with respect to the mapping parameters is determined via the chain rule as
3a
\dfA dg Ada
^)y(fv(u:)-fv(u,v))(Ü-Y^
where eY(u.-, y) is the computed distribution error over all observations y. The last term in (7), dg/da, is recognized as the sensitivity of our mapping to the parameters a. Since our mapping is a feed-forward MLP (a represents the weights and bias terms of the neural network), this term can be computed using standard backpropagation. The remaining partial derivative, df /dg, is
— MT K'(g(a,x;.)-W/) Substituting (8) into (7) yields
g = ^IM-^WM,.)-^«.,,))
(9)
The terms in (9), excluding the mapping sensitivities, become the new error term in our backpropagation algorithm. This adaptation scheme is depicted in figure 1, which shows that this adaptation scheme fits neatly into the backpropagation paradigm. Examination of the gaussian kernel and its differential in two dimension illustrates some of the practical issues of implementing this method of feature extraction as well as providing an intuitive understanding of what is happening during the adap-
18
tation process. The N-dimensional gaussian kernel evaluated at some u is (simplified for two dimensions) K(V, — U)
= —
.,,/?
(2K)
|Z|
, ,»1/7^-4^-»)^ '(y,-«) (10) 1=
>vt v. — i
27ia
;
^ 2a
a2 0
N=2
2
Oa
The partial derivative of the kernel (also simplified for the two-dimensional case) with respect to the input y( as observed at the output of the MLP is exp(--(y;— n)tZ \y-«)) 5K dyt
S (v.- H)
,o JV/2,„,l/2
KO,.-W)E
(11)
(w-y,)
expf j^'-"^«-") ^ 2a
0-7,)
2?ta
Af = 2
Z =
0 a
These functions are shown in figure 2. The contour of the gaussian kernel is useful in that it shows that output samples, y(, greater than two standard deviations from the center, u, of the kernel (in the feature space) do not significantly impact the estimate of the output PDF at that sample point. Likewise, the gradient term, is not significant for output samples exceeding two standard deviations from the kernel center. Consequently sample points for the PDF estimate should not exceed a distance of two standard deviations from each other, otherwise, samples caught "in between" do not contribute significantly to the estimate of the PDF. A large number of such samples can cause very slow adaptation. Recall that the terms in (9) replace the standard error term in the backpropagation algorithm. This term is plotted as a surface in figure 2 minus the PDF error. From this plot we see that the kernels act as either local attractors or repellors depending on whether the computed PDF error is negative (repellor) or positive (attractor). In this way the adaptation procedure operates in the feature space locally from a globally derived measure of the output space (PDF estimate).
4.0 EXPERIMENTAL RESULTS We have conducted experiments using this method on millimeter-wave ISAR (inverse synthetic aperture radar) images (64 x 64 pixels). The mapping structure we use in our experiment is a multi-layer perceptron with a single hidden layer (4096 input nodes,4 hidden nodes, 2 output nodes). Using the adaptation method
19
described, we trained the network on two vehicle types with ISAR images from 180 degrees of aspect. The projection of the training images (and between aspect testing images) is shown in figure 3 (where adjacent aspect training images are connected). As can be some significant class separation is exhibited (without prior labeling of the classes). We also note that the points where the classes overlap correspond to the cardinal aspect angles, which are, in general, difficult aspect angles to separate on similar vehicles in this type of imagery.
5.0 CONCLUSIONS We have presented what we believe to be a new method of unsupervised learning. This method unlike previous methods is not limited to linear topologies [3] nor unimodal PDFs [5]. In effect, we achieve features which are statistically independent from each other and yet are still, clearly, structurally related to the input structure as exhibited by the results of our example. This property bears similarity to Kohonen's discrete SOFM, however our map exists in a continuous output space. We are pursuing in our research more rigorous analysis in the comparison of the resulting feature maps to the Kohonen type. We are utilizing this method as a preprocessing for classification in our continuing research, although other applications certainly exist (e.g. blind separation).
Acknowledgments This work was partially supported by DARPA grant F33615-97-1-1019.
REFERENCES [1]
G. Deco and D. Obradovic, 1996, An Information-Theoretic Approach to Neural Computing, Springer-Verlag, New York
[2]
R. Linsker, 1988, "Self-organization in a perceptual system.", Computer, vol. 21, pp. 105-117.
[3]
R. Linsker, 1990, "How to generate ordered maps by maximizing the mutual information between input and output signals.", Neural Computation, 1, 402411.
[4]
A. Papoulis, 1991, Probability, Random Variables, and Stochastic Processes, 3rd Ed, pp. 533-602, McGraw-Hill.
[5]
T. Bell and J. Sejnowski, 1995, "An Information-Maximization Approach to Blind Separation and Blind Deconvolution", Neural Computation 7, 11291159.
[6]
P. Viola, N. Schraudolph, and J. Sejnowski, 1996, "Empirical Entropy Manipulation for Real-World Problems", Neural Information Processing Systems 8, MIT Press, 1996.
20
[7]
E. Parzen, 1962, "On the estimation of a probability density function and the mode.", Ann. Math. Stat, 33, pp. 1065-1076.
[8]
T. Kohonen, 1988, Self-Organization and Associative Memory (1st ed.), Springer Series in Information Sciences, vol. 8, Springer-Verlag.
Mapping Network BP algorithm '
£(,>j(0 ■
(4)
where Oi(t) denotes the output of the ith node at time t, and / is the nonlinearity. For a network with embedded memory of order m, the output of the dynamic neurons becomes Oi(t) = / ij2 v>uOi(t - n) + ^uiV.Uj-(t) + w\
(5)
Figure 2 (b) shows a LR network with embedded memory of order two. Locally recurrent models usually differ in where and how much output feedback is permitted; see [29] for a discussion of architectural differences. 2.3 NARX recurrent neural networks An important class of discrete-time nonlinear systems is the Nonlinear AutoRegressive with eXogeneous inputs (NARX) model [3, 18, 27, 28]: y(t) = /(u(t-/>„),... ,u(t),y(t-Dy
,y(t-
D).
(6)
where u(t) and y(t) represent input and output of the network at time t, Du and Dy are the input-memory and output-memory order, and the function / is a nonlinear function. When the function / can be approximated by a Multilayer Perceptron, the resulting system is called a NARX recurrent neural network [3, 21].
37
Figure 2: (a) A standard LR network, (b) A LR network with embedded memory of order two. In this paper, we shall consider NARX networks with zero input order. Thus, the operation of the network id defined by y(t) = f (u(t),y(t -Dy),...,y(t-1)).
(7)
Figure 3 shows a NARX architecture with output memory of order 3.
3 Experimental Results Simulations were performed to explore the effect of embedded memory on learning long-term dependencies in these three different recurrent network architectures. The long-term dependency problems investigated were the latching problem and a grammatical inference problem. These problems were chosen because they are simple and should be easy to learn but exemplify the long-term dependency issue. For more complex problems involving long-term dependencies see [12]. In order to establish some metric for comparison of the experimental results, we gave the recurrent networks sufficient resources (number of weights and training examples, adequate training time) to readily solve the problem but held the the number of weights approximately invariant across all architectures. Also note that in some cases the order of the embedded memory is the same. 3.1 The latching problem This experiment evaluates the performance of different recurrent network architectures with various order of embedded memory on a problem already used for studying the difficulty in learning long-term dependencies [2, 11, 17]. This problem is a minimal task designed as a test that must necessarily be passed in order for a network to robustly latch information [2]. In this two-class problem, the class of a sequence depends only on the first 3 time steps, the remaining values
38
y(t)
_ D
u(t)
y(t-3)
^
I
D
y(t-2)
-^-J
D
y(t-l)
Figure 3: A NARX network with output memory of order 3.
Architecture GR(1) GR(2) GR(3) NARX(2) NARX(4) NARX(6) LR(1) LR(2) LR(3)
Memory order 1 2 3 2 4 6 1 2 3
Network Description # hidden neurons # states 6 nodes 6 5 nodes 10 4 nodes 12 11 nodes 2 8 nodes 4 6 nodes 6 14 nodes 14 11 nodes 22 9 nodes 27
# weights In-hid-out 3-6-1 3-5-1 3-4-1 3-11-1 3-8-1 3-6-1 3-14-1 3-11-1 3-9-1
85 91 81 111 97 85 109 110 111
Table 1: Architecture description of different recurrent networks used for the latching problem. We used the hyperbolic tangent function as the nonlinear function for each neuron.
39
in the sequence is uniform noise. There are three inputs ui(t), u2(t), and a noise input e(t). Both ui(t) and u2{t) are zero for all times t > 1. At time t = 1, ux(l) = 1 and u2(l) = 0 for samples from class 1, and ui(l) = 0 and u2(l) = 1 for samples from class 2. The class information of each strings is contained in m (t) and u2(t). We used two delay elements for both ux (t) and u2(t) in order to hold the class information until t = 3. The noise input e(t) is given by
e(t)=l° [)
\U{-b,b)
*-3
3~*vw
(i)
'Note that we use notation which includes both time and the (/-operator, as is standard practice in the literature.
0-7803-4256-9/97/$ 10.00 © 1997 IEEE
44
where bi are constants and q lx(t) = x(t - 1). Eqn (1) can be equivalently written as m
y(t) = H(l-ciq-1)x(t)
(2)
«=i
If Cj is a complex number, then it will appear with its complex conjugate for real y(t). This model has been proven to be capable of universally approximating a functional [7,16]. However, for real world applications, there are a number of other aspects which also need to be considered when implementing cost effective models in hardware. One area normally considered, is the round-off error and quantization error due to the finite arithmetic wordlengths. It is known in the digital signal processing literature [14,19] that with the realization of FIR and IIR (infinite impulse response) filters using devices capable of only finite precision arithmetic, (1) is more sensitive to round-off effects and coefficient quantization than (2). Eqn (1) is known as a direct form implementation, while (2) is known as a cascade form [19]. While the sensitivity properties of linear filters are well known, in general, it appears that this area has not been considered in neural networks. It appears to be quite common that experiments are conducted using time delay neural networks with a direct form structure and not to consider potential problems of numerical effects such as parameter sensitivity. Hence, in this paper we investigate the sensitivity of TDNN networks which are based on (1) and propose a new class of TDNN architecture based on the cascade form model. The main aim of the paper, is therefore to demonstrate the validity and usefulness of using cascade form structures in time delay neural networks.
2
A Cascade Form Time Delay Neural Network
As implied in (1), we may equivalently formulate the input layer of the TDNN2 as FIR filters Goj(q) from the input to the jth unit in the first hidden layer. This approach allows us to easily consider various extensions to the basic TDNN structure. Hence we may have
Go(