Mobile Adaptive Visual Navigator (MAVIN) at Lincoln Laboratory. ..... images and
corresponding aspect graph, and Cb) functional block diagram of system. As a
target ..... fuse recognition events over time. .... from which 2000 views of each
aircraft were used for training the system, (b) view sphere showing the trajectory
from.
Neural Systems for Automatic Target Learning and Recognition Allen M. Waxman, Michael Seibert, Ann Marie Bernardon, and David A. Fay II We have designed and implemented several computational neural systems for the automatic learning and recognition of targets in both passive visible and synthetic-aperture radar (SAR) imagery. Motivated by biological vision systems (in particular, that of the macaque monkey), our computational neural systems employ a variety of neural networks. Boundary Contour System (BCS) and Feature Contour System (FCS) networks are used for image conditioning. Shunting center-surround networks, Diffusion-Enhancement Bilayer (DEB) networks, log-polar transforms, and overlapping receptive fields are responsible for feature extraction and coding. Adaptive Resonance Theory (ART-2) networks perform aspect categorization and template learning of the targets. And Aspect networks are used to accumulate evidence!confidence over temporal sequences of imagery. In this article we present an overview of our resellrch for the past several years, highlighting our earlier work on the unsupervised learning of threedimensional (3-D) objects as applied to aircraft recognition in the passive visible domain, the recent modification of this system with application to the learning and recognition of tactical targets from SAR imagery, the further application of this system to reentry-vehicle recognition &om inverse SAR, or ISAR, imagery, and the incorporation of this recognition system on a mobile robot called the Mobile Adaptive Visual Navigator (MAVIN) at Lincoln Laboratory.
of biological vision systems, we can learn much that applies to the design ofcomputational neural systems for target recognition. These insights are most relevant to passive vision systems, such as visible and multispectral infrared imaging systems, but similar organizing principles are also useful in the radar imaging domain. In the next section, we summarize the primary lessons that have been learned from the anatomical, physiological, and psychophysical study of vision systems in the macaque monkey and man. These insights are then applied throughout the remaining sections of this review. (Note: An introduction to biological vision, learning, and memory can be found in the September 1992 special issue of Scientific American, which is entitled "Mind and Brain.")
F
ROM THE STUDY
Design Constraints from Biological Vision The vision systems of primates contain two primary processing streams: the parvocellular stream, which processes shape information, and the magnocellular stream, which processes motion information (see References 1 and 2, and the references cited therein). Both streams begin in the retina and culminate in the parietal and temporal lobes of the cerebral cortex. Our automatic target recognition (ATR) systems have focused on the modeling of the parvocellular stream for the learning and recognition of three-dimensional (3-D) objects, although we have utilized image sequences to accumulate evidence over time. The image motion of objects can also be useful for recognizing potential targets, and we have developed VOLUME 6, NUMBER 1, 1993
TilE LINCOLN LABORATORY JOURNAL
77
• WAXMAN ET AL.
Neural Systems for Automatic Target Learning and Recognition
neurocomputational systems [3] to extract such information in real time (30 velocity fields per second) on the Pipelined Image Processing Engine (PIPE), a videorate parallel-processing computer. The integration of an object's image motion with its shape information can potentially enhance the ATR process, and is a topic we are currently investigating. The early visual processing that takes place in the retina, lateral geniculate nucleus, geniculo-cortical connections, and visual cortical areas VI, V2, and V4 of the occipital lobe are responsible for 1. conditioning imagery so as to render it invariant to the prevailing illumination (while producing smoothly shaded percepts of objects), 2. localizing features (such as edges, high-curvature points, and high-contrast points) that describe 2-D shapes, and 3. transforming the resulting feature pattern so as to render it invariant to object location, scale, orientation around the line of sight, and small deformation due to any foreshortening resulting from a rotation in depth (i.e., a totation around an axis perpendicular to the line of sight), while still retaining measurements of these spatial attributes. These invariant representations of 2-D object shapes make their way to the inferior temporal cortex via connections between the occipital and temporal lobes, whereas the location/scale/orientation information is relayed to the posterior part of the parietal lobe via connections between the occipital and parietal lobes. Object-location information is conveyed to the parietal lobe also via the superior colliculus, which receives direct connections from the geniculate nucleus and is intimately involved in attentional processes. These two cortical pathways-one subserving object vision (in the temporal lobe) and the other subserving spatial vision (in the parietal lobe)-have come to be known as the what and where systems [4]. Fusion of the what and where information is achieved via reciprocal connections between the temporal and parietal lobes, as well as by indirect connections between other regions of the brain such as the hippocampus, although the details are not yet understood. Insight into the later stages ofvisual processing and 78
THE LINCOLN LABORATORY JOURNAL
VOLUME 6, NUMBER 1. 1993
3-D object representation can be gained by studying the superior temporal sulcus (STS) in the temporal lobe of the macaque monkey. This area is known to be the site of cells tuned for the recognition of faces and other body parts. Of course, the faces that a monkey recognizes are indicative of the monkey's visual experiences, and reflect the visual learning process itself We have learned much from the work of D.1. Perrett and his colleagues at the University of St. Andrews in Scotland [5-8]. The notion of cells specifically tuned to the recognition of certain objects (analogous to the orientationally tuned edge sensitive neurons in VI discovered by D. Hubel and T. Wiesel in 1959) was popularized by H. Barlow in 1972, and became known as the grandmother-cell hypothesis, as if to emphasize that a single neuron becomes active to signal the recognition of one's grandmother. And, for the past 20 years, a debate has raged over this notion of single-cell versus distributed-network coding of visual objects. In fact, this seemingly absurd notion of single-cell coding seems to have much supporting evidence, as illustrated in Perrett's work below (and confirmed by other investigators). The strict notion of grandmother cells, however, must be reinterpreted in light of the fact that many layers of processing precede the viewspecific coding of objects, and a hierarchical pooling of cells is required to influence the object-specific cell. Moreover, many visual objects may activate this cell, although it is maximally active for a specific object, whereas other cells are more active in the case of the other objects. Hence, a recognition decision must follow a neural competition between grandmother cells, and possibly an evidence-accumulation phase among multiple views when such views are available. Figure 1 (from Reference 5) illustrates the STS area in the macaque monkey brain. The figure shows the locations of neurons detected by Perrett that are highly tuned to the face and profile views of heads, rotations of heads between specific views, and conjunctions of face views with up/downlleftlright motions. Perrett's subsequent work [7] indicates the existence of viewspecific cells, each one tuned for a particular view around a certain class of heads, and still other cells, called view-general cells, that respond to any view of a
• WAXMAN ET AL.
Neural Systems for Automatic Target Learning and Recognition
Section through A
(b)
A
I"
5mm
-I
(c)
FIGURE 1. View-based coding of faces in the temporal cortex of the macaque monkey: (a) lateral view of the monkey brain, (b) coronal cross section with a red box around the superior temporal sulcus (STS), and (c) serial sections ofthe STS area investigated. From left to right, the sections illustrate the electrode tracks, cells selective to face views, cells selective to profile views, cells selective to transitions between views during head rotations, cells selective to faces moving left/right, and cells selective to faces moving up/down. (Adapted from 0.1. Perrett et al. [5], with permission from Trends in Neurosciences, Elsevier Science Publishers B.V.)
specific head (as if the view-general cells were connected to all of the corresponding view-specific cells). View-specific cells respond to the same face views with similar activity levels, regardless of the illumination strength or color, the size or 2-D orientation of the face, and the position of the face in the field of
view. Such cells have apparently learned 2-D-invariant shape codes. Figure 2 (from Reference 6) provides a striking example of view and identity coding in the macaque temporal cortex. In the experiment, a monkey was shown different views of the faces of two familiar VOLUME 6, NUMBER I, 1993
THE LINCOLN LABORATORY JOURNAL
79
• WAXMAN ET AL.
Neural Systems ftr Automatic Target Learning and Recognition
o I
10 ,
Spikes/sec
(a)
Spikes/sec
(b)
FIGURE 2. View and identity coding in the macaque temporal cortex for (a) subject 1 and (b) subject 2. In the experiment, a monkey was shown different views of the faces of two familiar people (subjects 1 and 2), and the activity of a single STS neuron in the monkey's brain was monitored with an electrical probe. The results are plotted in spikes/sec radially from the "+" symbol; the black solid circle denotes the spontaneous background activity level. The experimental measurements are represented by the large red dots with error bars indicating standard deviations over several repeated trials. Note that the neuron has a clear preference for the right profile view of subject 1, and no significant response to any view of subject 2. (Adapted from Perrett et al. [6], with permission from the Journal of Experimental Biology, the Company of Biologists Ltd.)
people, while an electrical probe monitored the activity of a single STS neuron in the monkey's brain. The results are shown in Figure 2, in which cell activity is plotted radially from the "+" symbol and the solid circle denotes the spontaneous background activity level. The expetimental measurements are represented by the large dots with error bars indicating standard deviations over several repeated trials. Figure 2(a) shows that the neuron is highly tuned for the right profile view of subject 1. Nearby views (some at a 45° angle from the right profile) still generate cell activity, though at a much reduced rate. All views of subject 2 (a rather different-looking face) generate no significant activity above the background level, as shown in Figure 2(b). Thus this neuron might someday become a grandfather ceIL! In summary, monkeys learn to recognize faces by employing a view-based strategy. Representations of 2-D shapes are learned and stored in view-specific STS cells. These cells code shape information that is invariant to illumination, position, scale, orientation 80
THE LINCOLN lABORATORY JOURNAl
VOLUME 6, NUMBER 1, 1993
around the line of sight, and small foreshortening deformation. Other cells code transitions between neighboring views that have been exposed by the rotations of a subject's head. A hierarchical combination of the two types of cells allows the construction of view-general cells that are selectively activated by specific heads regardless of the viewing direction. This same strategy for the learning and recognizing of 3-D heads (and, possibly, other objects) can be applied usefully to the design of artificial neural systems for ATR. Aircraft Recognition from Visible Image Sequences We designed our first end-to-end ATR system for the passive visible domain, and applied the system to high-contrast imagery of model F-16, F-18, and HK1 (Spruce Goose) aircraft moving against textured backgrounds. (Note: Detailed descriptions of this neural system are contained in several papers by M. Seibert and A.M. Waxman [9-11].)
- WAXMAN ET AL.
NeuraL Systems for Automatic Target Learning and Recognition
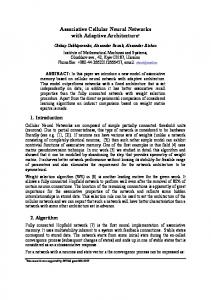
Figure 3 provides a conceptual overview of the system, in which a temporal view sequence of an object leads to the learning of an aspect graph [12] representation of that 3-D object. We can divide the system into three main functional stages, the first of which performs 2-D view processing to extract features (invariant to illumination) from the individual images, group these features to locate object position, and transform the features to render the pattern invariant to scale, orientation, and small deformation. The second stage takes these invariant feature patterns and clusters them into categories ofsimilar views, or aspects. This 2-D view classification is done in an unsupervised way; i.e., it is strictly data driven without any category definition by a human. Along with the learning of these aspect categories, a prototype
feature-pattern template is established for each category. The aspect categories correspond to the nodes of an aspect-graph representation of the target; they also play the role ofview-specific cells for aircraft. The third stage detects the transitions over time berween aspect categories (while the target is tracked in relative motion), learns these transitions, and accumulates evidence for possible targets. The learned transitions are like the arcs that connect the nodes in the aspectgraph concept, and are reminiscent of the STS neurons that are activated by the rotation of the heads berween views in Figure 1. The ability to accumulate evidence over time is significant, for there are often cases in which a single view of a target is not sufficient to identify the target unambiguously; moreover, this fusion of evidence leads to a notion of
Temporal view sequence Aspect graph
Ca)
2-D view processing
2-D view classification
-Feature extraction View sequence
..... ......
-Position, scale, orientation, and deformation invariance
3-D object hypotheses -Transition detection
-Pattern encoding
..... .....
-Aspect learning and recognition
.....
......
-Transition learning
~
......
Object recognition
-Evidence accumulation
Cb) FIGURE 3. Conceptual approach of ATR neural system for passive visible image sequences: Ca) temporal view sequence of images and corresponding aspect graph, and Cb) functional block diagram of system. As a target moves relative to an observer, qualitatively different views are exposed in a temporal view sequence. The views unfold in an orderly fashion that is represented in the aspect graph. Each image in the sequence is processed by three stages of networks performing feature extraction and invariant mappings, classification of feature maps into aspect categories, and 3-D object evidence accumulation from the recognition of categories and transitions. The learned categories and transitions are analogous to the nodes and arcs, respectively, of an associated aspect graph.
VOLUME 6. NUMBER 1. 1993
THE LINCOLN LABORATORY JOURNAl
81
-WAXMAN ET AL.
Neural Systems fOr Automatic Target Learning and Recognition
confidence in the recognition decision. These three processing stages can each be realized with multiple neural networks, and together the networks comprise a neural system architecture, as shown in Figure 4. Here, each module is an individual network that is annotated by the module's functional role in the system. Two processing streams are shown: the gray modules form a parvocelLular stream, and the red modules form an attentional stream. In the system, images are captured with a conventional CCD camera (which could be replaced by an infrared imaging system), and objects are segmented from the background by using a combination of motion and contrast information. Next, a shunting center-surround network enhances the edges of the segmented object, and a DiffUsion-Enhancement Bilayer (DEB) extracts and dynamically groups the feature points of high edge curvature into a position centroid, as shown in Figure 5. These networks form nonlinear dynamical systems in which individual nodes are governed by (Hodgkin-Huxley-like) cell-membrane equations that resemble the charging dynamics of coupled resistor-capacitor networks. (See Reference 13 by S. Grossberg for a review of his pioneering work on dynamical neural networks, including shunting center-surround networks. Also, see References 14 and 15 for a reformulation of the DEB in terms of coupled dynamical layers of astrocyte glial-like diffusion cells and neural-like contrast-enhancing cells, all inspired by biology and applied to the psychophysical percept oflong-range apparent motion.) The centroid determined by the DEB network is used to track and fixate the object, and serves as the origin of a log-polar transform of the extracted-feature map. This transformation is very closely approximated by the axonal connections between the lateral geniculate nucleus and the primary visual cortex VI [16J. In our system the transformation serves to convert changes in 2-D scale and 2-D orientation of the visual-feature map into a translation along new orthogonal axes. These processing steps are illustrated for an F-18 silhouette in Figures 6(a), (b), and (c). The log-polar feature map (periodic in orientation angle e) is then input to a second DEB to determine a new feature centroid in the transformed coordinates. The spatial pattern of features now represents 82
THE LINCOLN LABORATORY JOURNAL
VOLUME 6, NUMBER 1. 1993
the original view of the F-18 invariant to illumination, position, scale, and orientation. The next layer of processing indicated in Figure 4 consists of overlapping receptivefields; the processing is aligned with the centroid that was detected on the log-polar map, and serves to render the feature pattern somewhat insensitive to nonlinear spatial deformation. In the processing (Figure 7), a small array of Gaussian-weighted overlapping receptors are excited by the underlying features in the log-polar map, and the output of the array provides a much compressed code of the spatial feature pattern. (An individual receptor is activated by the feature within the receptor's field that lies closest to the field's center, and the feature's distance is coded according to a Gaussian falloff.) This compressed code is illustrated for the F-18 in Figure 6(d) for the case of a 5 x 5 array of overlapping receptors. In the figure, the sizes of the dots correspond to the receptor activation level: the larger the dot, the greater the activation. This coarse coding of spatial feature patterns simultaneously provides for enormous data reduction from the original target image (compared, for example, with a direct template-matching approach), leads to a tolerance for small deformations due to rotations in depth and inaccurate feature extraction, and yields an input vector for the classification network that forms the next system module. The later stages of vision support the learning and recognition process. In our system, learning and recognition are realized by two modules consisting of an Adaptive Resonance Theory network (cf. several papers on various ART networks in Reference 17) and an Aspect network [10, 11]. Figure 8 illustrates the ART-2 architecture for unsupervised category learning and recognition. (Note: ART-2 is one implementation of Adaptive Resonance Theory for patterns consisting of real numbers.) The ART-2 network takes an N-dimensional input vector (in our case, the overlapping receptive field pattern with dimension of order 10 to 100) and first processes it through circuitry that contrast-enhances and normalizes the input as a short-term memory (STM) pattern. ART-2 then passes this pattern through a bottom-up filter (or template) stored in long-term memory (LTM) to excite a field of STM category
-WAXMAN ET AL.
Neural Systems for Automatic Target Learning and Recognition
Input
. Object-background separation
Edge enhancement
Feature extraction and grouping
.
•
.. ·.
-.. · -
0
Position invariance
. •
0
•
0
· •
. · •
•
0
0
• •
.
0
,. I-
Orientation and scale invariance
n
-•
-.
I.
~
View learning and recognition
Object learning and recognition
c-. . · .. 0
o
. . •
t.1..
I/If!Im!ll'4II''''.'''''i'loti Camera motions
•
l!l
.
.
. .
.
. .
t1.
•
0
0
•
Grouping and attention
•
•
•
·· .
. ---
•
0
0
...nL
,. View coding and deformation invariance
0
•
Grouping and attention
.....
•• .......
.
.
..
-
Attentional shift
Attentional reset
. ·.
· •
Attentional reset
t
Recognized object
FIGURE 4. Modular system architecture for the learning and recognition of 3-0 targets from visible imagery. The system is organized into two streams of neural network modules: the gray parvoce/lular stream for invariant shape learning and recognition, and the red attentional stream. The functional role of each module is indicated along with the type of network.
VOLUME 6. NUMBER 1. 1993
THE liNCOLN lABORATORY JOURNAl
83
• WAXMAN ET AL.
Neural Systems for Automatic Target Learning and Recognition
•• • Input image Edge enhancement
Local maximum detection
Edge-enhanced image with maxima superimposed
(a)
n = 50
n = 3 (Iterations)
Diffusion
n = 125
(b)
FIGURE 5. Diffusion-Enhancement Bilayer (DEB) for feature extraction and grouping: (a) architecture diagram and (b) evolving map of high-curvature points. The first stages of processing are accomplished by center-surround networks to edge-enhance the segmented object, and a diffusion-enhancement network to isolate points of high curvature along the silhouette. These feature points are dynamically grouped into a centroid (providing a focus of attention) by another DEB, which couples a diffusion layer to a contrast-enhancing layer in a feedforward and feedback configuration. (For a detailed description of DEBs, see References 9,14, and 15.)
84
THE LINCOLN LABORATORY JOURNAL
VOLUME 6. NUMBER 1. 1993
-WAXMAN ET AL.
Neural Systems fOr Automatic Target Learning and Recognition
•••• e· •
· e · ••• (a)
(b)
(c)
(d)
FIGURE 6. Stages in the processing of a 2-D view of a model F-18 aircraft: (a) the original image, (b) the edge-enhanced silhouette with DEB features superimposed and the centroid indicated with a "+," (c) log-polar mapping of the image in part b, with the new centroid indicated with a "+," and (d) the resulting output of a 5 x 5 array of overlapping receptive fields (see Figure 7) that forms the pattern fed to the Adaptive Resonance Theory (ART-2) network. In the image in part d, larger dots represent greater activity in the corresponding receptive fields.
nodes (our view-specific cells, or aspect nodes). These category nodes compete among themselves to choose a maximally activated winner, which in turn activates top-down feedback of a learned template also stored in LTM. This feedback represents the network's expectation of a specific input pattern. A vigilance parameter p (in the interval 0 to 1) that is set in advance by the user mediates the matching of the enhanced input pattern with the top-down template. Thus, simply having a best match among already established categories is not enough; rather, the best match must satisfY the established vigilance. When the match does satisfY the vigilance criterion, the network goes into a state of resonant oscillations between layers, and the bottom-up and top-down filters adapt slightly for better representation of the recent input pattern. When the vigilance criterion has not been met, the network generates a reset signal that flips the category field, thus suppressing the recent winner and reactivating the former losers. In this way, an uncommitted category node can establish a new category and a new template can be learned. ART-2 has several important attributes that make it particularly well suited to ATR applications: it supports on-line, real-time, unsupervised, stable category learning and refinement. We have utilized ART-2 successfully in a number of applications. To present our results for the ART-2 classification of different aircraft, we introduce the concept of a viewing sphere, as illustrated in Figure 9. Note that a
Output of 3 x 3 array below
3 x 3 array of overlapping receptive fields
Point features FIGURE 7. Spatial coding of features by overlapping receptive fields. Each circular field is activated according to a Gaussian-weighted distance to the point feature that is closest to the receptor center. (Note: Lighter colors in the figure represent closer distances.) These receptors provide enormous data compression, and they code spatial relations of features robustly with respect to deformations due to foreshortening. The fields convert a binary feature map to an analog pattern that is then suited for ART-2 classification.
VOLUME 6, NUMBER 1, 1993
THE LINCOLN LABORATORY JOURNAL
85
• WAXMAN ET AL.
Neural Systems fOr Automatic Target Learning and Recognition
Gain control Category field
+
STM
••••• ....--------4 +
+
----.. +
••••• STM
Input field
Gain control
+
+
Input pattern (a)
Reset
e---.
Category field STM
•••••
location on the viewing sphere for an example aircraft corresponds to the view of that aircraft as seen from that particular direction. Using this viewing-sphere concept, Figure 10 summarizes the results of feature extraction, coding, and ART-2 classification for an F18 model aircraft. With 535 input views of the F-18 and a vigilance p of 0.93, ART-2 generates 12 categories of the aircraft. In Figure 10(a), the categories, or aspects, are shown color coded on an aspect sphere with 12 different untelated colors (i.e., a dark blue has no relation to a light blue). Note that the aspects subtend finite solid angles on the sphere (the target is oriented with its nose to the left). Because of object silhouette symmetry, only one quadrant of the sphere is shown. We can visualize example silhouettes that correspond to the 12 categories by selecting locations on the aspect sphere falling at the centers of each of the established categories, as shown in Figure 10(b). The corresponding silhouettes (numbered 1 through 12 in Figure 10[c]) represent prototype views that the system has created in an unsupervised manner. Notice the variety of silhouettes selected: some prototype views capture the wing shapes, some capture the double tail fins, some capture the dual exhausts, while others emphasize traditional top and side views. Also note the similarity between silhouettes 2 and 5, given the proximity of their corresponding centroids in Figure 10(b). Yet, although similar, silhouettes 2 and 5 do exhibit subtle differences, e.g., the differing slopes of the top portion of the visible tail fin. All of the views in Figure 10(c) were selected automatically. When the vigilance p was increased from 0.93 to 0.95, the ART-2 network generated 24 categories. In addition to the F-18, we have also investigated
FIGURE 8. ART -2 network: (a) architecture and (b) circuit
model. ART-2 takes analog input patterns and clusters them into categories by using unsupervised competitive learning. ART-2 can be trained on a dataset, then used to recognize data patterns in the field while continuing to refine its learned category representations (Le., templates) stored in its adaptive synapses. The vigilance parameter p mediates the matching ofthe enhanced input pattern stored in short-term memory (STM) with a learned template from long-term memory (LTM). (Adapted from G.A. Carpenter et al. [17], with permission. This reference also contains a detailed description of ART.)
STM
Input field
Input pattern
--
(b)
86
THE LINCOLN LABORATORY JOURNAl
VOLUME 6, NUMBER 1, 1993
• WAXMAN ET AL.
Neural Systems for Automatic Target Learning and Recognition
.....
•
_~--
FIGURE 9. Example viewing sphere for a fighter aircraft. Note that a location on the sphere corresponds to the view of the aircraft as seen from that particular direction. Silhouettes of the aircraft are shown from different viewing directions. The silhouettes were obtained by applying thresholds to imagery that was captured with a charge-coupled device (CCD) camera and frame grabber. (The jagged contours reflect the finite pixel sizes ofthe CCD imager.)
ART-2 classification for an F-16 and HK-l (Spruce Goose) model aircraft, as shown in Figure 11. Approximately 500 views of each aircraft were collected and processed with a single ART-2 module. (The next section, "Tactical Target Recognition in the SyntheticAperture Radar [SAR] Spotlight Mode," presents an alternative strategy of using one ART-2 module per target for the SAR application.) All the views together resulted in only 41 independent categories at a vigilance p of 0.93. (Note: Figure 10 investigated the categorization of a single target by using views of just that target. Thus, at the same vigilance setting of 0.93, ART-2 generated only 12 categories, in contrast to the 26 categories of Figure 11 [a].) The individual aspect spheres show the similarity in category layour between the two fighter aircraft, and the obvious differences between fighter and transport-like aircraft. The spheres also indicate how certain views of the two fighters are ambiguous, at least in terms of the features extracted by the system. The individual 3-D
targets are represented by roughly 25 categories each. Note in Figure 11 that some of the categories are common to two or more of the targets; i.e., the light yellow in Figure 11 (a) corresponds to the same category that is represented by the same light yellow in Figure l1(b). The aspect spheres in Figure 11 also illustrate the neighbor relations among categories as one rotates or explores a target in 3-D. These neighbor relations correspond to permitted transitions among categories, and are learned and exploited by our Aspect network. Much like the STS cells that code view transitions, and the hierarchical pooling of view-specific cells to form view-general object-specific cells, our Aspect networks self-organize into connections among aspect category nodes that preferentially channel activity into corresponding 3-D object nodes when successive aspects occur in a permitted sequence. The Aspect networks learn these aspect transitions incrementally during controlled training sessions, or iniVOLUME 6. NUMBER 1. 1993
THE LINCOLN LABORATORY JOURNAL
87
• WAXMAN ET AL.
Neural Systems fOr Automatic Target Learning and Recognition
3
12
/
10
5 (a)
~
--4 .
~
·4 ~
~
....--
r-----
~
6
(b)
~
.
2
I
~
(c)
~
~
.4,,1. :
~
-..
FIGURE 10. Results of feature extraction, coding, and ART-2 classification of an F-18 model aircraft alone at a vigilance p of 0.93: (a) aspect sphere showing the 12 aspects (color coded) generated by ART-2, (b) centroids of the largest regions ofthe 12 aspects, or categories, and (c) corresponding example silhouettes ofthe regions in part b. These views have been selected automatically by the system. (Note: The 12 colors used for the aspect sphere have been selected arbitrarily; i.e., a dark blue has no relation to a light blue.)
tially in the field after the aspect categorization has stabilized (i.e., after repeated exposures to the training data yield the same categorization). Then, during the imaging of a target in motion, multiple viewpoints are experienced, leading to recognition of multiple aspects by the ART-2 network, followed by evidence accumulation by the object nodes in the Aspect net88
THE LINCOLN LABORATORY JOURNAL
VOLUME 6, NUMBER 1, 1993
work. Target trajectories are realized as a set of aspect categories linked together by aspect transitions. Much more information becomes available when we consider the aspect transitions among ambiguous views. For example, even if both views of a two-aspect sequence are each ambiguous among potential targets, the additional aspect-transition information is often
-WAXMAN ET AL.
Neural Systems for Automatic Target Learning and Recognition
synaptic weights lie in the interval [0,1], and, as category transitions are experienced, the weights asymptotically approach the extreme values of (implying no allowed transition between corresponding categories) and 1 (indicating a permitted transition). These values correspond to the absence or presence of an arc in the associated aspect-graph representation. The dendritic tree with its synaptic connections resembles the symmetric state-transition matrices that are commonly used in system-modeling techniques. Extending the Aspect-network concept to multiple targets leads to the network architecture shown in Figure 13. In this design we consider all aspect categories of all targets as belonging to the same ART-2
sufficient for the preferential activation of the correct target node in the Aspect network. Figure 12 illustrates an Aspect network for a single object, along with an enlarged view of the network's adaptive axo-axo-dendritic synapse. This synapse brings together in close physical proximity projections from pairs of aspect nodes onto a branch of the dendritic tree leading to an object node. When ART-2 categories are excited in temporal succession, the aspect nodes shown charge or discharge exponentially like capacitors, and their temporal overlap of activity supports a Hebbian form of correlational learning on the connecting synapse (cf. Reference 13 for a discussion of modified Hebbian learning with gated decay). The
(a)
°
(c)
(b)
FIGURE 11. Aspect spheres for the (a) F-18, (b) F-16, and (c) HK-1 (Spruce Goose) have been generated from 535, 530, and 423 views, respectively, of each aircraft. Feature extraction, invariant mappings, and ART-2 categorization of all 1488 views generate a total of 41 aspects, or categories, at a vigilance p of 0.93. The number of categories generated for the individual aircraft is 26 forthe F-18, 24 for the F-16, and 28 for the HK-1. Note that many categories are common to more than one target; i.e., the light yellow in part a corresponds to the same category that is represented by the same light yellow in part b. Also note the resemblance of the aspect spheres for the two fighter aircraft, in contrast to the HK-1 aspect sphere.
VOLUME 6, NUMBER 1, 1993
THE LINCOLN LABORATORY JOURNAL
89
• WAXMAN ET AL.
Neural Systems for Automatic Target Learning and Recognition
·0
Object node
Aspect node activity Xj+E
To object node Yk
1 Adaptive weights
~
wt =0 wt = 1
Aspect nodes (a)
Aspect node activity Xi+E (b)
FIGURE 12. Aspect network for the single-object case: (a) network and (b) enlarged view of one synapse of the network. The aspect nodes (blue) are each coupled to corresponding categories allocated by the ART-2 network; the nodes charge and decay like capacitors. Axons (wires) emanating from each aspect node cross each other to form a transition matrix, and each crossing has an associated axo-axo-dendritic synapse (red) onto the dendritic tree (orange) ofthe object node. When two aspect nodes are simultaneously active (during view transitions), they strengthen the synapse (red) via modified Hebbian learning, and conduct activity onto the dendrite toward the object node. Object nodes thus pool activity from aspect nodes, exploiting transition information to amplify this activity, thereby accumulating evidence over time. In the enlarged view, the synapse brings together activity from aspect nodes Xi and Xj (as well as a background-noise level E) and channels it onto the dendritic tree. (Note: The box "Aspect Network Learning Dynamics" contains a description of the equations that govern the aspect nodes, object nodes, and synaptic weights. For further details of Hebbian learning and Aspect networks, see References 10, 11, and 13.)
network. The aspect categories of the ART-2 network drive a single set of aspect nodes that fan out to all the synaptic arrays of possible targets. Activity (i.e., evidence) is then channeled into the object nodes, which compete to select the target with the maximum evidence at that moment. The winning object is then able to modifY its own transition array. Sudden saccadic eye/camera motions to other locations in a scene initiate a reset ofobject-node activities to zero; smooth tracking motions do not cause such resetting. Figure 14 contains an example of aircraft recognition by the Aspect network. In the training sequence, each of the three model aircraft experiences an identical trajectory of 2000 views covering one quadrant of the viewing sphere. Then a test sequence of 50 F-16 images is generated, and evidence is accumulated for each of the three targets as well as for an unlearned other target representing a none-of-the-above category. The graphs shown in the figure illustrate the corresponding category (and transition) sequence, the evi90
THE LINCOLN LABORATORY JOURNAL
VOLUME 6, NUMBER 1, 1993
dence accumulation and decay for each possible target, and the winning object with the instantaneous maximum evidence. Note that initially the system begins selecting the "other" target until sufficient evidence accumulates to declare the F-16 the winner, and it remains so. Reference 11 contains further details of this experiment. At this point we have the basic design of a neural ATR system. The system has a number of definite strengths, bur it also suffers from a few shortcomings. For example, a difficulty exists in adding new targets once the system has stabilized, because new data may modifY the existing ART-2 category templates and lead to the need to retrain the Aspect network. A more efficient design is to assign a separate ART-2 network and (much compressed) Aspect network to each potential target, but allow the unsupervised assignment of aspect categories during the controlled exposure in a training session. By doing so, we can add new targets at a later time by simply adding new
• WAXMAN ET AL.
Neural Systems for Automatic Target Learning and Recognition
ASPECT NETWORK LEARNING DYNAMICS the Aspect netWork (Figures 12 and 13) as a means to fuse recognition events over time. The network embodies a hierarchical pooling ofview-specific aspect categories so as to exploit the additional information associated with permitted category transitions. These transitions are learned by exploring the object. The dynamics of Aspect networks is in the form of differential equations (shown below) governing the short-term memory activity of the aspect nodes ~ and object nodes J'k, and long-term memory of the adaptive axo-axodendritic synapses ~f Aspect nodes are excited by their corresponding ART-2 category nodes Ii (with rate constant K) and passively decay back to their resting WE DEVELOPED
Aspect nodes :
Object nodes :
dX, _I
dt
d;k
state (with rate constant A). Object nodes accumulate evidence for each object by summing the activity (with rate constant KYJ entering from the aspect nodes on the dendritic tree. Activity riding atOp background noise E enters via the learned synapses corresponding to permitted transitions, and activity is channeled most effectively by paired aspect nodes in a permitted sequence. The function ItA) is a threshold linear function that passes activity levels when A > O(B). Similar to the aspect nodes, the object nodes also decay passively to their resting state (with rate constant AYJ. The synaptic weights learn aspect transitions by experiencing correlated activity from two as-
= Kxf. -
KY
References 1. M. Seibert and A.M. Waxman, "learn_ ing and Recognizing 3D Objects from Multiple Views in a eural System," chap. rr.12 in Neural Networks for Perception, vol 1, ed. H. Wechsler (AcademicPress, ewYork, 1991),pp.426-
444. 2. M. Seibert and AM. Waxman, "Adaptive 3-D Object Recognition from Multiple Views," IEEE Trans. Pattern Anal
Mach. Intell 14, 107 (1992).
AX X
1
=
pect nodes, as long as the object node activity is changing (i.e., Yk ¢ 0) for the winning object Zk- The function 8.( C) is a binary threshold gate that equals unitywhen C> O(E). The weights approach asymptotes toward the fixed points of 0 and 1 because of the quadratic shunting terms that modulate the rate constant K w. For further details of Aspect networks, see References 1 and 2.
1
{4 4 1
J>I
[(Xi
E 2
+
E)~;(Xj + e)] - AYYk }
k
Synaptic weights:
d: Kw~;(I- W:){E[(X j
=
ART-2 and Aspect networks, without any modification to the existing networks. Moreover, separate ART2 networks for each target better support the ATR task given only a single view (as opposed to a sequence of views), because each target will have generated its own set oflearned templates within its ART-2 module. This design has been adopted for the next application-target recognition ftOm SAR spotlight sequences. For this application we also intro-
i
+
e)(Xj
+
e)] - AW}8 E(Yk)8 E(Zk)
duce a measure of recogmtzon confidence derived from the accumulated evidence. Tactical Target Recognition in the SyntheticAperture Radar (SAR) Spotlight Mode High-resolution radar imaging of a scene can be accomplished by flying a radar that is transmitting chirp pulses from many closely spaced look angles (Figure 15). The moving radar thus synthesizes a long aperVOLUME 6, NUMBER 1, 1993
THE LINCOLN LABORATORY JOURNAL
91
• WAXMAN ET AL.
Neural Systems fOr Automatic Target Learning and Recognition
ture, and the rerum pulses determine a reflectivity image of the scene as projected into the range and cross-range coordinates of the plane formed by the synthetic aperture and the radar line of sight. (This plane is referred to as the synthetic-aperture radar [SAR) slant plane.) The range resolution is proportional to the bandwidth of the chirp pulse; the cross-range resolution is proportional to the angle subtended by the synthetic aperture. As the radar moves along the flight path, it can be "squinted" so as to track a fIxed location on the ground. Hence, the radar beam spotlights a particular scene, and a sequence of SAR images is obtained of that scene from multiple VIews.
The reader may look ahead to Figure 26(a) to view a typical clutter scene-an overpass that crosses the New York State Thruway-obtained from the Lincoln Laboratory Advanced Detection Technology Sensor (ADTS), a millimeter-wave radar, operating in the SAR mode. (In our work, only single-channel vertical-vertical [VV] polarization imagery is used.) Note that the image is quite speckled, a consequence of the coherent imaging method. Nonetheless, at fIrst glance this scene has a rather natural appearance. To illustrate here the appearance of objects such as ground vehicles, we refer to the inverse SAR, or ISAR, images shown in Figure 16. Three tactical targets are shown at a radar depression angle (or slant-plane
Object competition layer
Synaptic arrays of learned view transitions
View transition Adaptive weights k_ Wij-O
" Wt=1
Aspect nodes Input view categories 1 234
N
~ t
Time
FIGURE 13. Aspect network for the multi-object case. Input aspect categories from a single ART -2 network (coding all aspects of all targets) excite aspect nodes that fan out to all synaptic arrays of learned view transitions, each of which conducts activity (Le., evidence) to its corresponding object node. A competition layer (created from self-excitation and collective inhibition) determines the target of maximum evidence at any moment, and allows the corresponding synaptic array to be refined. Sudden eye/camera motions can cause the object nodes to reset their evidence to zero, (For a detailed description of Aspect networks, see References 10 and 11.)
92
THE LINCOLN LABORATORY JOURNAL
VOLUME 6, NUMBER 1, 1993
• WAXMAN ET AL.
Neural Systems ftr Automatic Target Learning and Recognition
40
-
...-
30
-