Neuronal Activity in Human Anterior Cingulate Cortex Modulates with .... The output of the GLM ... neuron's spiking history and the cognitive state variable. We.
Neuronal Activity in Human Anterior Cingulate Cortex Modulates with Internal Cognitive State During Multi-Source Interference Task Samuel Sklar, Matthew Walmer*, Pierre Sacre, Catherine A. Schevon, Shraddha Srinivasan, Garrett P. Banks, Mark J. Yates, Guy M. McKhann II, Sameer A. Sheth, Sridevi V. Sarma+, Member, IEEE, Elliot H. Smith
Abstract- The dorsal anterior cingulate cortex (dACC) is thought to be essential for normal adaptation of one's behavior to difficult decisions, errors, and reinforcement. Here we examine single neurons from the human dACC in the context of a statistical model, including a cognitive state that varies with changes in cognitive interference induced by a Stroop-like task. We then include this cognitive state in point process models of single unit activity and subject reaction time. These results suggest that consideration of a latent cognitive state can explain additional variance in neural and behavioral dynamics.
T
I. INTRODUCTION
HE dACC has been associated with myriad functions essential for cognition [l]. However, debate remains in the literature regarding its cardinal functions [2]. There is consensus that the dACC is somehow involved with behavioral adaptation, as lesioning the dACC impaired OCD patients' abilities adapt behavior in response to previous trials ' outcomes [3]. These results suggest that the dACC may not be necessary for making difficult decisions in themselves, but is necessary for adjusting responses to the external world and allocating cognitive resources [4]. Here we sought to test whether single unit activity recorded from the human dACC tracks a latent cognitive state that could represent the subject's attentional or motivational levels or the extent to which the subject is monitoring her performance in order to adapt her behavior. II.
METHODS
A. Subjects Single unit recordings were examined from two epilepsy patients undergoing surgical evaluation for pharmacoresistant epilepsy. The choice of electrode location was based entirely on clinical considerations. All subjects enrolled voluntarily and provided informed consent prior to electrode implantation. The Columbia University Medical Center Institutional Review Board approved experimental protocols. Each subject had between one and three BehnkeFried style electrodes implanted orthogonally through the prefrontal cortex with the microwires ending in the anterior cingulate cortex (Figure la). *S. Sklar, M. Walmer are equal first authors. +s.v. Sanna and E. Smith are equal senior authors. S. Sklar, M. Walmer, P. Sacre, and S. V. Sanna are with the Department of Biomedical Engineering, Johns Hopkins University, Baltimore, MD, 21218 USA. C.A. Schevon and S. Srinivasan are with the Department of Neurology Columbia University Medical Center. G.P. Banks, M.J. Yates, G.M. McKhann, S.A. Sheth, and E.H. Smith are with the Department of Neurological Surgery at Columbia University Medical Center, New York, NY, 10032 USA.
U.S. Government work not protected by U.S. copyright
B. Electrophysiological Recordings Electrophysiological data were acquired using a neural signal processing system (Blackrock Microsystems, LLC, Salt Lake City, UT, USA) at a sampling rate of 30 KHz. These data were high-pass filtered at 250 Hz and thresholded on line at -5 times the root-mean-square of the filtered signal. Approximately 1.5 ms of data around each threshold crossing were retained for spike sorting. Sorting of single units was accomplished in a semi-supervised manner using the t-distributed E-M algorithm in a multidimensional space consisting of the first three principal components across all waveforms using Offline Sorter (Plexon, Dallas, TX, USA) [5]. The threshold crossing times for units that were isolated from the noise cluster were retained for further analysis. The anatomical locations of all contacts were identified through co-registration of the preoperative MRI and the post-operative CT using methods described in [5]. C. Behavioral Task
Subjects performed the behavioral task in their hospital rooms using methods previously described in [9]. Behavioral data were simultaneously acquired on the same time base as the electrophysiology data. Subjects performed the Multi-Source Interference Task (MSIT) [5]. The MSIT is a Stroop-like task in which the subject is presented with three integers ranging from 0 to 3. Two of the three integers presented are the same integer. The goal of the MSIT is to indicate the identity of the different integer on the number pad (e.g. cue: 0 2 O; correct response: button 2; Figure 1b). Conflict is introduced in this task by changing the position of the target number (e.g. 0 0 1; correct response: button 1; Simon or spatial interference) or by changing the identity of the distracting integers to potential responses (e.g. 1 2 1; correct response: button 2; Eriksen or flanker interference). Additionally both types of interference can occur (e.g. 3 1 3; correct response: button 1). These four groups of trials were presented randomly, with uniform frequency distribution.
D. Cognitive State Variable In this task, we hypothesize the "cognitive state" of each subject influences behavior and modulates neuronal activity in the cingulate cortex. In particular, we hypothesize that when subjects require more cognitive control, (i) they are more likely to react to the stimulus slowly and (ii) their cingulate neurons are modulated. Since such a cognitive state is not directly measureable, we compute it from measurable data. Specifically, we construct a cognitive state
962
E. Point Process Model of dACC Dynamics Once the cognitive state variable is derived for each subject, we formulate a point process model (PPM) to relate the spiking of each dACC neuron to factors associated with the neuron's spiking history and the cognitive state variable. We use these model parameters to analyze temporal dynamics in neuronal activity due to the cognitive state variable after the stimulus is shown. To define a PPM of spiking activity, we consider an observation interval (0, T] and discretize the process by dividing the observation interval into N bins of size Ll = :!:...
(8)
N
+ 300
Let dNt equal the number of beats in (t, t + Ll] for t = 0,1, ... , N. We make Ll small enough so that dNt = [0,1]. Then, the PPM is completely characterized by its conditional intensity function (CIF) defined as
feedback (t = r(t) + [0.3 0.8])
.. 0
response (t = r(t))
~~
•
~
onset (t = 0) 0.5 s)
'stim~lus
=·
fixation cross (t
'( IH ) _ 1. t t - lffit.-+O
1t
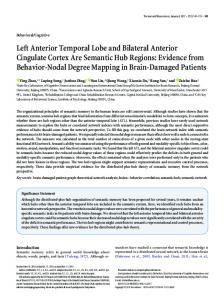
Figure 1. MSIT task and microwire recording locations. (A) Microwire recording locations in the dACC. Colors represent recording locations corresponding to each subject on each hemisphere (L and R). (B) MSIT task diagram showing an example trial structure. In each trial a fixation cross appears on the screen for 0.5 s prior to the stimulus presentation. The stimulus remains on the screen until the subject indicates her response on the button pad. Feedback is delivered between 0.3 and 0.8 s after the subject indicates her response.
Pr( spike in (t, t
+ br u(t)
(1)
L at-i-l bru(i)
(3)
which can be used to determine the parameters {a, b1 , b 2 , b 3 , b4 , bs} by inserting x(t) as a covariate into a Generalized Linear Model (GLM). The output of the GLM is y(t), defined as the log of the reaction time modeled as
+ Du(t) + d 0 + E(t)
(7) (8)
i=t 0
y(t) = log(r(t)) = x(t)
(6)
such that
t-1
+
= A(tlHr)~
(2)
and the parameter a represents the decaying influence of previous trials on the cognitive state, and {b 1 , b 2 , b 3 , b4 , bs} dictate the effects that the trial conditions have on x(t). The solution to the state space ofx(t) is x(t) = atx(O)
+ ~] I Ht))
For the current analyses, we use the GLM to define our CIF models by expressing, for each neuron, the log of its CIF in terms of the neuron's spike history and relevant covariates [14]. We express the CIF for each neuron as a function of the neuron's spiking history, .il~, in the preceding 240ms and our derived cognitive state variable, .ilx. Specifically, for trial k and time bin t:
where u(t) is an input column matrix dependent on the trial conditions u 1 is 1 if no interference and 0 o. w. u 2 is 1 if both interferences and 0 o. w . u = { u 3 is 1 if spatial interference and 0 o. w . u 4 is 1 if flanker interference and 0 o. w . u 5 is 1 if trial type changed from previous trial and 0 o. w.
(5)
Further details can be found in [10] and [11].
+ 1) = ax(t) + L{= 1 biui(t) + b5u5 (t) = ax(t)
t.
where Ht denotes the history of spikes up to but not including time t and Pr is probability . .il(t!Ht) represents a stochastic model for the arrival of the point process. It follows from (5) that the probability of a single spike in a small interval (t, t+.:1] is approximately
variable that updates for each trial t, denoted as x(t) and defined by: x(t
Pr(dN, =1 IH,)
(4)
where r(t) is the reaction time of the trial, the E(t) are independent zero mean Gaussian random inputs with variance (if, and D is a vector of the form of b, that represents the direct influence of the current input on the reaction time of a trial.
log ..:tr (ti Ht) =
Yo + LJ=1 Yjnt-sj :t-s(J-1) + LJ=1 /3jnt-40-2sj:t-40-2s(J-1)
(9)
where na :b is the number of spikes observed in the time interval [a, b) during the epoch analyzed. The {Yj} coefficients capture short-term history effects going back to 40 ms in the past in 5ms bins. The {/3j} coefficients capture long-term history effects going back to 240 ms in the past in 25 ms bins, and e captures the effect of the cognitive state. We compute maximum-likelihood (ML) estimates for all coefficients and their associated 95% confidence intervals for each neuron model using 'glmfit' in MATLAB. F. Model Fitting and Assessment
963
Half of the trials were used to fit the models, and the remaining half were used to test goodness-of-fit of the models. We used Kolmogorov-Smimov (KS) plots based on the time-rescaling theorem to assess model goodness-of-fit. The time-rescaling theorem states that any point process
with an integrable conditional intensity function may be transformed into a Poisson process with unit rate [16]. A KS plot, which plots the empirical cumulative distribution function of the transformed spike times versus the cumulative distribution function of a unit rate exponential, is used to visualize the goodness-of-fit for each model. The model is a better fit if its corresponding KS plot lies near the 45° line. We computed 95% confidence bounds for the degree of agreement using the distribution of the KS statistic [16].
III.
RESULTS
A. Behavioral Data: Reaction times
We found that subjects' reaction time (RT) varied across trials. But as Figure 2 demonstrates, at any given time the average RTs for each trial type rise and fall together. We hypothesize that this covariation is driven by a latent cognitive process. Therefore we have overlaid the cognitive state variable x(t) onto Figure 2 to demonstrate the relation between the subjects' need for cognitive control and RT. B. Behavioral Model
Table 1 shows that while the b covariates significantly predicted reaction times for both subjects 1 and 2, the d covariates were only significant in subject 2. The d covariates represent the direct influence that the trial type inputs have on the reaction times of the subject, whereas the b covariates represent the indirect influence of the inputs through their modulation of x(t). Therefore these data show that the cognitive state of subjects 1 and 2, as represented by x(t), does impact their reaction times. However as the d covariates are only significant in subject 2, we can determine that the current trial type may or may not directly impact the reaction time of the subject. Furthermore b5 is not significant for either subject so we see that while the specific trial types have significant impacts on the determination of x(t), changing the trial type from the previous trial does not. Finally, table one shows that b2 does not have a significant contribution to x(t) for subject 1. This indicates that the occurrence of a hard trial does not impact the subject's x(t), what we are considering the subjects' need for cognitive control. However this same covariate is the most significant in subject 2. Figure 3 and Table 2 show the correlation between x(t) and the observed RT, as well as the correlation between the predicted RT and the observed RT. The data show a positive correlation between x(t) and RT for both subjects. This result concurs with our conception of x(t) as a need for control or attention, which may manifest as hesitance. The data also demonstrate a correlation between the observed and predicted RTs. However this correlation is far from ideal, so there are certainly some factors that are not accounted for in the current model. We hypothesize that other cognitive states, such as confidence or learning-related engagement, may account for some of these factors.
C. Point Process Model for dACC Neurons
We examined the activity of 12 units (10 in patient 1 and 2 in patient 2). Figure 4 shows the spiking frequency (Hz) in units from both subjects during the first second after stimulus presentation in each trial. These spike counts are overlaid with the cognitive state variables, x(t), for each subject. The neurons' spiking frequencies appear to have a negative correlation with x(t) dropping markedly when x(t) nses. In subject 1 we found 10 units whose activity was predicted using the cognitive state variable (the GLM fit coefficient for the x(t) covariate was significantly non-zero, with pvalue < 0.05). Some units had increased activity as x(t) increased, while some displayed decreased activity. These units are listed in Table 3. For 6 of these units (marked in red), there was also a highly significant correlation between x(t) and spiking. The covariate coefficients for subject 1's PPM are shown in Figure 5. The dependence on short and long term spiking history are displayed in the lower two plots, and show refractoriness in the first 15 ms after a spike, and an increased likelihood to fire in the 25 to 100 ms interval. The upper right plot displays the PPM coefficient for x(t) with 2 standard deviation error bars. For this unit, Parameter a bl b2 b3
b4 bS dl d2 d3 d4 dS
Subject 1
Pvalue
Subject 2
Pvalue
1 -4.495E-01 -8.002E-02 -3.037E-01 -2.129E-01 4.432E-02 S.799E-03 S.908E-04 -2.754E-02 2.280E-02 -1.699E-03
NA
1 1.824E-01 5.180E-01 2.277E-01 3.867E-01 6.169E-02 -4.139E-02 -5.028E-02 -2.135E-02 -3.092E-02 4.689E-02
1.345E-02 8.735E-13 2.097E-03 5.995E-08 1.169E-01 6.391E-03 3.816E-OS 2.343E-02 1.206E-02 S.652E-OS
9.243E-13 1.773E-01 3.491E-06 2.502E-04 2.404E-01 S.564E-01 9.696E-01 l.114E-01 S.152E-02 8.329E-01
NA
Table 1. Model coefficients (red are significant with p