The Journal of Neuroscience, December 9, 2009 • 29(49):15595–15600 • 15595
Brief Communications
Neuronal Avalanches Imply Maximum Dynamic Range in Cortical Networks at Criticality Woodrow L. Shew,1 Hongdian Yang (
),1,2 Thomas Petermann,1 Rajarshi Roy,2 and Dietmar Plenz1
1
Section on Critical Brain Dynamics, Laboratory of Systems Neuroscience, National Institute of Mental Health, Bethesda, Maryland 20892, and 2Institute for Physical Science and Technology, University of Maryland, College Park, Maryland 20742
Spontaneous neuronal activity is a ubiquitous feature of cortex. Its spatiotemporal organization reflects past input and modulates future network output. Here we study whether a particular type of spontaneous activity is generated by a network that is optimized for input processing. Neuronal avalanches are a type of spontaneous activity observed in superficial cortical layers in vitro and in vivo with statistical properties expected from a network operating at “criticality.” Theory predicts that criticality and, therefore, neuronal avalanches are optimal for input processing, but until now, this has not been tested in experiments. Here, we use cortex slice cultures grown on planar microelectrode arrays to demonstrate that cortical networks that generate neuronal avalanches benefit from a maximized dynamic range, i.e., the ability to respond to the greatest range of stimuli. By changing the ratio of excitation and inhibition in the cultures, we derive a network tuning curve for stimulus processing as a function of distance from criticality in agreement with predictions from our simulations. Our findings suggest that in the cortex, (1) balanced excitation and inhibition establishes criticality, which maximizes the range of inputs that can be processed, and (2) spontaneous activity and input processing are unified in the context of critical phenomena.
Introduction The cortex is spontaneously active even in the absence of any obvious stimulus or motor output. Increasingly, evidence shows that such ongoing activity is intricately linked to stimulus-evoked activity. For example, orientation maps constructed from ongoing neuronal activity in the anesthetized cat match those based on visual responses (Tsodyks et al., 1999; Kenet et al., 2003). Spatiotemporal correlations of spikes in the visual cortex are similar when the awake animal is simply sitting in darkness or observing natural scenes (Fiser et al., 2004). Likewise, population responses to auditory and somatosensory stimuli fall within the repertoire of observed spontaneous events (Luczak et al., 2009). Moment to moment, ongoing activity contributes to the large variability observed in stimulus responses (Arieli et al., 1996; Azouz and Gray, 1999; Kisley and Gerstein, 1999), while being only weakly modulated by stimulus presentation (Fiser et al., 2004). On longer timescales, the organization of spontaneous activity is thought to reflect past inputs and influence future network responses (Ohl et al., 2001; Yao et al., 2007). Such interplay between spontaneous and stimulus-evoked activity raises the question whether there is a particular type of ongoing activity that maintains optimized stimulus processing in the network. Received Aug. 6, 2009; revised Sept. 28, 2009; accepted Oct. 30, 2009. This work was supported by the Intramural Research Program of the National Institute of Mental Health. R.R. acknowledges support from a Department of Defense Multidisciplinary University Research Initiative grant (ONR N000140710734) to the University of Maryland. T.P. is also grateful to the Swiss National Science Foundation (Grant PBEL2-110211) for financial support. We thank Craig Stewart for help with preparing the cultures. Correspondence should be addressed to Dr. Dietmar Plenz, Section on Critical Brain Dynamics, Laboratory of Systems Neuroscience, Porter Neuroscience Research Center, National Institute of Mental Health, Room 3A-100, 35 Convent Drive, Bethesda, MD 20892. E-mail:
[email protected]. DOI:10.1523/JNEUROSCI.3864-09.2009 Copyright © 2009 Society for Neuroscience 0270-6474/09/2915595-06$15.00/0
Here we focus on neuronal avalanches, a type of spontaneous activity observed in superficial layers of cortex in vivo and in vitro (Beggs and Plenz, 2003; Plenz and Thiagarajan, 2007; Gireesh and Plenz, 2008; Petermann et al., 2009). Neuronal avalanches consist of bursts of elevated population activity, correlated in space and time, that are distinguished by a particular statistical character: activity clusters of size s occur with probability P(s) ⬃ s ␣, i.e., a power law with exponent ␣ ⫽ ⫺1.5. Neuronal avalanches have several additional key properties: (1) they arise during development when superficial layers form in vitro and in vivo (Gireesh and Plenz, 2008), (2) they are homeostatically maintained for weeks in isolated cortex without any input (Stewart and Plenz, 2008), (3) they constitute the dominant form of ongoing cortical activity in the awake monkey (Petermann et al., 2009), and (4) their pharmacological regulation is characterized by an inverted-U profile of NMDA/dopamine D1 receptor interaction and intact fast inhibitory transmission (Beggs and Plenz, 2003; Stewart and Plenz, 2006; Gireesh and Plenz, 2008). Neuronal avalanches are similar to the dynamics of other systems poised at the boundary of order and disorder; more precisely, we refer to systems operating at criticality (Stanley, 1971; Bak and Paczuski, 1995; Jensen, 1998). Importantly, simulations predict that at criticality, neuronal networks optimize several aspects of information processing, including (1) the range of stimulus intensities that can be processed, i.e., dynamic range (Kinouchi and Copelli, 2006), and (2) the amount of information that can be transferred (Beggs and Plenz, 2003; Tanaka et al., 2009). Until now, experimental support of these predictions has been lacking. Here, we demonstrate that in vitro cortical networks have maximum dynamic range when spontaneous activity takes the form of neuronal avalanches. By systematically changing excitation and inhibition, we obtain a tuning curve for stimulus
15596 • J. Neurosci., December 9, 2009 • 29(49):15595–15600
Shew et al. • Dynamic Range Maximized during Neuronal Avalanches
processing in cortical networks, with peak performance found under balanced conditions that generate neuronal avalanche activity.
Materials and Methods Organotypic cultures on microelectrode arrays. Coronal slices from rat somatosensory cortex (350 m thick, postnatal day 0 –2; Sprague Dawley) and the midbrain (VTA; 500 m thick) were cut and cultured on a poly-Dlysine-coated 8 ⫻ 8 microelectrode array (MEA) (Multi Channel Systems; 30 m electrode diameter; 200 m interelectrode distance). In this organotypic slice coculture, the development of deep and superficial cortical layers (Go¨tz and Bolz, 1992; Plenz and Kitai, 1996) as well as neuronal avalanche activity parallels that observed in vivo (Gireesh and Plenz, 2008). In short, a sterile chamber attached to the MEA allowed for repeated recording from cultures for weeks. After plasma/ thrombin-based adhesion of the tissue to the MEA, standard culture medium was added (600 l, 50% basal medium, 25% HBSS, 25% horse serum; Sigma-Aldrich). MEAs were then affixed to a slowly rocking tray inside a custombuilt incubator (⫾65° angle, 0.005 Hz frequency, 35.5 ⫾ 0.5°C) (Stewart and Plenz, 2008). Spontaneous activity. Using a recording head stage inside the incubator (MEA1060 w/blanking circuit; ⫻1200 gain; bandwidth 1–3000 Hz; 12 bit A/D; range 0 – 4096 mV; Multi Channel Systems), local field potential (LFP; 4 kHz sampling rate; reference electrode in bath) was obtained from 1 h of continuous recordings of extracellular activity (low-pass, 100 Hz, phaseneutral). To establish a correlation between LFP and neuronal spiking activity, in n ⫽ 5 cultures, extracellular activity was recorded for 15 min at 25 kHz. In addition to extracting LFP, the extracellular signal was filtered in the frequency band 300 –3000 Hz and ⬍78 single units were identified per culture using threshold detection and PCA-based spike sorting (Offline Sorter; Plexon). Stimulus-evoked activity. Immediately following each 1 h recording of spontaneous activity, stimulus-evoked activity was measured. Stimuli were applied at 5 s intervals at one electrode located approximately at the center of the culture, in superficial cortical layers. Stimuli were current-controlled, single shocks with bipolar square waveform: 50 s with amplitude ⫺S followed by 100 s with amplitude ⫹S/2, where 6 ⬍ S ⬍ 200 A. We tested one set of stimulus amplitudes with fine resolution (S ⫽ 10 –200 A in steps of 10 A), and another with coarser resolution (S ⫽ 6, 12, 24, 50, 65, 80, 100, 150, 200 A). Results were similar for the two protocols. Each stimulus level was repeated 40 times in pseudorandomized order resulting in a total recording duration of 2000 (coarse) or 4000 (fine) s. Each stimulus-evoked response was recorded using all electrodes except for the stimulation electrode during 500 ms following stimulation. A blanking circuit
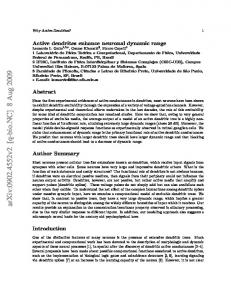
Figure 1. Measuring spontaneous and stimulus-evoked activity from cortical networks. A, Light-microscopic image of a somatosensory cortex and dopaminergic midbrain region (VTA) coronal slice cultured on a 60-channel microelectrode array. Yellow dot, Stimulation site. Black dots, Recording sites. B, Number of extracellular spikes correlates with the size of simultaneously recorded nLFP burst (R ⫽ 0.84 ⫾ 0.13; n ⫽ 1). Each point represents total number of spikes versus the corresponding spontaneous nLFP burst size. C, Example recordings of spontaneous LFP fluctuations (left) and nLFP rasters (right) for three drug conditions (top, AP5/DNQX; middle, no drug; bottom, PTX). D, Examples of LFP evoked by 70 A stimulus (left) and rasters recorded during the application of four stimuli of amplitudes 50, 40, 90, 150 A (yellow line, stimulus time) (right) for three drug conditions. For both spontaneous (C) and stimulus-evoked (D) activity AP5/DNQX (PTX) typically results in reduced (increased) amplitude LFP events with lesser (greater) spatial extent. In C and D, black dots on the LFP traces indicate nLFP events, raster point color indicates nLFP amplitude, and all calibration bars (left) represent 50 V, 100 ms.
Shew et al. • Dynamic Range Maximized during Neuronal Avalanches
J. Neurosci., December 9, 2009 • 29(49):15595–15600 • 15597
disconnected the recording amplifiers during stimulation, significantly reducing stimulus artifacts (Multi Channel Systems). Sample rate and filtering was identical to that used for spontaneous activity recordings. Pharmacology. Bath application of antagonists of fast glutamatergic or GABAergic synaptic transmission was used to change ratios of excitation to inhibition (E/I ). The normal (no-drug) followed by a drug condition was studied within 3 h to minimize nonstationarities during development. Stock solutions were prepared for the GABAA receptor antagonist picrotoxin (PTX), the NMDA receptor antagonist (2 R)-amino-5-phosphonovaleric acid (AP5), and the AMPA receptor antagonist 6,7-dinitroquinoxaline-2,3-dione (DNQX). Six microliters of these stock solutions were added to 600 l of culture medium to reach the following working concentrations (in M): 5 PTX, 20 AP5, 10 AP5 ⫹ 0.5 DNQX, and 20 AP5 ⫹ 1 DNQX. After recording, the drug medium was replaced with 300 l of drug-free conditioned medium (collected from the same culture the previous day) mixed with 300 l of fresh, unconditioned medium. Most cultures recovered to criticality within ⬃24 h. Spontaneous cluster size and response to stimulus. For each electrode, we identified negative peaks in the LFP (nLFPs) that were more negative than ⫺4 SDs of the electrode noise. We then identified a cluster of nLFPs on the array as a group of consecutive nLFPs each separated by less than a time (Beggs and Plenz, 2003). The threshold was chosen to be greater than the short timescale of interpeak intervals within a cluster, but less than the longer timescale of intercluster quiescent periods ( ⫽ 86 ⫾ 71 ms for all cultures; see also supplemental material, available at www. jneurosci.org). Results were robust for a large range in the choice of (data not shown). The size s of a cluster was quantified as the absolute sum of all nLFP amplitudes within a cluster. Similarly, the size R of an evoked response was quantified as the absolute sum of nLFPs within 500 ms following a stimulus. Definition of . For neuronal avalanches, the probability density function (PDF) of cluster size s follows a power law with slope ␣ ⫽ ⫺3/2 (Beggs and Plenz, 2003) (see Fig. 2 A). Thus, the corresponding cumulative density function (CDF) for cluster sizes, FNA(), which specifies the fraction of measured cluster sizes s ⬍ , is a ⫺1/2 power-law function, FNA() ⫽ (1 ⫺ 公l/L) ⫺1(1 ⫺ 公l/) for l ⬍ s ⬍ L. Here we define a novel nonparametric measure, , to quantify the difference between an experimental cluster size CDF, F(), and the theoretical reference CDF, FNA(),
⫽1⫹
1 m
冘 m
k⫽1
共FNA(k) ⫺ F(k)兲,
(1)
where k are m ⫽ 10 burst sizes logarithmically spaced between the minimum and maximum observed burst size. Using CDFs rather than PDFs to calculate avoids the sensitivity to binning in constructing a PDF. Compared to other nonparametric comparisons of CDFs, e.g., Kolmogorov–Smirnov and Kuiper’s test, as well as other methods, more accurately measures deviation from neuronal avalanches (see supplemental material, available at www.jneurosci.org). Dynamic range. After measuring responses to a range of stimulus amplitudes, we used the response curve, R( S), to compute dynamic range,
⌬ ⫽ 10 log10共Smax/Smin兲,
(2)
where Smax and Smin are the stimulation values leading to 90% and 10% of the range of R, respectively. Model. The model consisted of N all-to-all coupled, binary-state neurons (N ⫽ 250, 500, 1000) and the following dynamical rules: If neuron j spiked at time t (i.e., sj(t) ⫽ 1), then postsynaptic neuron i will spike at time t ⫹ 1 with probability pij. As such, the pij are N 2 numbers representing the synaptic coupling strengths between each pair of neurons. The pij are asymmetric pij ⫽ pji, positive, time-independent, uniformly distributed random numbers with mean and SD of order N ⫺1. If a set of neurons J(t) spikes at time t, then the probability that neuron i fires at time t ⫹ 1 is exactly piJ(t) ⫽ 1 ⫺ 兿j僆J(t)(1 ⫺ pij). To implement the probabilistic nature and variability of unitary synaptic efficacy, neuron i
Figure 2. Change in the ratio of excitation/inhibition moves cortical networks away from criticality. A, Left, PDFs of spontaneous cluster sizes for normal (no-drug, black), disinhibited (PTX, red), and hypoexcitable (AP5/DNQX, blue) cultures. Broken line, ⫺3/2 power law. Cluster size s is the sum of nLFP peak amplitudes within the cluster; P(s) is the probability of observing a cluster of size s. Right, Corresponding CDFs and quantification of the network state using , which measures deviation from a ⫺1/2 power law CDF (broken line). Vertical gray lines, The 10 distances summed to compute , shown for one example PTX condition (red). B, Simulated cluster size PDFs (left) and corresponding CDFs (right) for different values of the model control parameter . C, Summary statistics of average values for normal, hypoexcitable, and disinhibited conditions (*p ⬍ 0.05 from normal). D, In simulations, accurately estimates . Broken line, ⫽ . Colored dots, Examples shown in B. actually fires at time t ⫹ 1 only if piJ(t) ⬎ (t), where (t) is a random number from a uniform distribution on [0,1],
写
s i 共 t ⫹ 1 兲 ⫽ ⌰ 关 p iJ 共 t 兲 ⫺ 共 t 兲兴 ⫽ ⌰关1 ⫺ 共 1 ⫺ p ij 兲 ⫺ 共 t 兲兴 ,
(3)
j僆J 共 t 兲
where ⍜[x] is the unit step function. Like our experiments, we explore a range of network excitability by tuning the mean value of pij from 0.75/N to 1.25/N in steps of 0.05/N by scaling all pij by a constant. For such small mean pij, the model reduces to probabilistic integrate-and-fire, i.e., piJ ⬇ 冱j僆J(t)pij to order N ⫺2 accuracy. If the mean pij is exactly N ⫺1, then n spikes at time t will, on average, excite n postsynaptic spikes at time t ⫹ 1, which constitutes criticality in our model (Beggs and Plenz, 2003; Kinouchi and Copelli, 2006). When mean pij is larger than or less than N ⫺1, the system is supercritical or subcritical, respectively. We define the control parameter of the model ' N ⫺1冱i冱ipij. In the context of dynamics, reflects the average ratio of spiking descendants to spiking ancestors in consecutive time steps. At criticality, ⫽ 1; the coupling strengths are balanced such that, on average, the number of active sites neither grows nor decays with time (note that the instantaneous activity level fluctuates
15598 • J. Neurosci., December 9, 2009 • 29(49):15595–15600
Shew et al. • Dynamic Range Maximized during Neuronal Avalanches
greatly). To obtain response as a function of stimulus in the model, we simulated increasing stimulus amplitude S by increasing the number of initially activated neurons (S ⫽ 1, 2, 4, 16, 32, 64, 128 initially active neurons). Finally, we note that our model is very similar to (N ⫺ 1)-dimensional directed percolation (Buice and Cowan, 2007). Therefore, at high dimension (N ⬎ 5) and weak coupling, it is expected that the model behaves as a branching process, where is the branching parameter and the ⫺3/2 power law is predicted at criticality. To test for statistical differences between groups, a one-way ANOVA followed by a Tukey post hoc test was used.
Results Cortex–VTA cocultures from rat (n ⫽ 16), which closely parallel in vivo differentiation and maturation of cortical superficial layers (Gireesh and Plenz, 2008), were grown on 8 ⫻ 8 integrated planar microelectrode arrays (Fig. 1A). LFPs were recorded after superficial layer differentiation (⬎10 d in vitro, DIV) and analyzed to extract spatiotemporal clusters of nLFPs (n ⫽ 47 experiments). Extracellular unit activity recorded simultaneously with the LFP revealed that sizes of nLFP clusters correlated with the level of suprathreshold neuronal activity in the network (Fig. 1 B) (R ⫽ 0.84 ⫾ 0.13, mean ⫾ SD; n ⫽ 5 cultures). For each experimental condition, we first measured spontaneous activity (Fig. 1C) and quantified the deviation of the observed spontaneous network dynamics from neuronal avalanche dynamics by calculating (Fig. Figure 3. Stimulus–response curves and dynamic range ⌬. A, Experimental response R evoked by current stimulation of 2 A) (see Materials and Methods). In a sec- amplitude S for three example cultures with different values. Orange arrows, Range from Smin to Smax; length is proportional to ond step, we measured the input/output ⌬. Note that ⌬ is largest for ⬵ 1. B, Model response evoked by different numbers of initially activated sites; ⌬ is largest for dynamic range ⌬ of the cultured network ⬵ 1. Like the experiment, each point is calculated from 40 stimuli. Error bars, 1 SE. C, Experimental summary statistics for based on its response to a range of stimu- under different pharmacological conditions (*p ⬍ 0.05 from normal). D, Simulation summary statistics for comparing different lus amplitudes (Figs. 1 D, 3A). These mea- ranges of (*p ⬍ 0.05 from ⬵ 1). surements were performed under normal pected reference CDF for neuronal avalanches (Fig. 2 A, right, conditions and repeated after changing the ratio of excitation and gray lines). As summarized in Figure 2C, ⬵ 1 under normal inhibition through bath application of the antagonists PTX or conditions ( ⫽ 1.14 ⫾ 0.01, mean ⫾ SE; n ⫽ 28), ⬍ 1 when AP5/DNQX. excitation is reduced ( ⫽ 0.81 ⫾ 0.01; n ⫽ 10) and ⬎ 1 when inhibition is reduced ( ⫽ 1.51 ⫾ 0.01; n ⫽ 9; F(2,44) ⫽ 82.7; p ⬍ Quantifiying the cortical network state based on 0.05 for PTX and AP5/DNQX from normal). Figure 2 A (left) shows experimental cluster size PDFs obtained This experimental strategy was paralleled using a networkfrom three cultures under normal, unperturbed conditions and level computational model of binary, integrate-and-fire neurons, in the presence of PTX or AP5/DNQX, respectively. Under norin which changes in the excitation/inhibition ratio (E/I ) were mal conditions, cultures revealed a PDF close to ⫺3/2 power law mimicked by tuning the parameter (see Materials and Methas predicted for neuronal avalanches (Fig. 2 A, black). In the presods). For ⬍ 1, a neuron triggers activity in less than one neuron, ence of PTX, however, the PDF is bimodal, revealing a high likeon average, resulting in a hypoexcitable state. Conversely, for ⬎ lihood for small and large activity clusters, but a decreased 1, one neuron excites on average more than one neuron in the probability of medium-sized clusters (Fig. 2 A, red). In contrast, near future, resulting in a hyperexcitable condition. Accordingly, bath application of AP5/DNQX reduces large clusters resulting in for ⫽ 1, propagation of activity is balanced, as was found exmostly small clusters (Fig. 2 A, blue). These differences in PDFs perimentally for neuronal avalanches (Beggs and Plenz, 2003; are robustly assessed using the corresponding CDFs (Fig. 2 A, Stewart and Plenz, 2008). We simulated “spontaneous” activity right). Reducing excitation results in a steep early rise of the CDF, clusters by activating a single randomly chosen neuron and monwhile reducing inhibition results in a delayed rise of the CDF. itoring the ensuing until activity ceased or 500 time steps were robustly quantifies these observations using the difference between a measured CDF of cluster sizes and the theoretically exexecuted. The total number of spikes in a cluster was taken as the
Shew et al. • Dynamic Range Maximized during Neuronal Avalanches
J. Neurosci., December 9, 2009 • 29(49):15595–15600 • 15599
cluster size. One thousand clusters were simulated at each of 11 levels of . In agreement with established theory, model cluster size PDFs near criticality (i.e., ⫽ 1) fit a ⫺3/2 power law very closely (Fig. 2 B, right, black) (Harris, 1989; Zapperi et al., 1995). Just as in the experiment, we computed based on CDFs of simulated spontaneous activity for different values of (Fig. 2 B). We found that and were almost linearly related (Fig. 2 D), which supports the following interpretation: In the experiments, ⬵ 1 is close to criticality, ⬍ 1 identifies the subcritical regime, and ⬎ 1 is analog to the supercritical regime of the model. Stimulus-evoked activity and dynamic range After obtaining for a given experimental condition, we recorded the response R as a function of stimulus amplitude S (for peristimulus time histograms of response for different S, see supplemental material, available at www.jneurosci.org) Typical response curves from experiments and simulations are shown in Figure 3, A and B, respectively. We found that the shape of the response curves in the model closely matched the experimental findings. When excitatory synaptic transmission was reduced ( ⬍ 1), the system was relatively insensitive (required a larger stimulus to evoke a given response). When inhibitory synaptic transmission was reduced ( ⬎ 1), the system was hyperexcitable, with responses that saturate for relatively small stimuli. In the balanced E/I condition with ⬵ 1, the range of stimuli resulting in nonzero and nonsaturated response was largest. Maximal dynamic range at criticality, ⬵ 1 For each response curve, we quantified the range of stimuli the network can process, i.e., the dynamic range ⌬ (see Materials and Methods). We found experimentally that ⌬ ⫽ 5.0 ⫾ 0.1 (mean ⫾ SE) under normal conditions, ⌬ ⫽ 2.4 ⫾ 0.1 in the presence of PTX, and ⌬ ⫽ 3.4 ⫾ 0.3 for AP5/DNQX (Fig. 3C) (F(2,44) ⫽ 11.3; p ⬍ 0.05 PTX and AP5/DNQX from normal). Importantly, the dynamic range was largest in unperturbed networks, in which neuronal avalanches are most likely to occur. These results were robust for different network sizes and different maximal stimulus amplitudes, whether or not the response curves reached saturation for all conditions (see supplemental material, available at www.jneurosci.org). Similar overall changes in ⌬ were also found in our simulations (Fig. 3D) (F(2,195) ⫽ 820; p ⬍ 0.05). We then derived a tuning curve of ⌬ versus by combining all experimental conditions into one scatter plot (Fig. 4 A). These data demonstrate that ⌬ is maximized and its variability is largest near ⬵ 1. These findings agree well with our model including changes in ⌬ as the system is pushed away from ⬵ 1, ⬃10 dB drop (10-fold reduction in Smax/Smin) for a 30% change in (Fig. 4 B). The tuning curve demonstrates that the change in the dynamic range of a network due to a shift in E/I depends on both the original, unperturbed state and the resulting change in .
Discussion We experimentally derived a tuning curve that linked the state of a cortical network with its ability to process stimuli. When the network was closest to criticality, as indicated by neuronal avalanches, was close to 1 and dynamic range was maximized. This is the first experimental demonstration to confirm theoretical predictions on the computational advantage of operating at criticality. Dynamic range has been predicted in simulations to peak at criticality (Kinouchi and Copelli, 2006). Our simulations advance previous studies by linking the dynamic range of a network with the spontaneous activity it generates. Because the dynamic range increases with the ability of a network to map input differ-
Figure 4. Network tuning curve for dynamic range ⌬ near criticality. A, In experiments, ⌬ peaks close to ⬵ 1 and drops rapidly with distance from criticality. Paired measurements share the same symbol shape; normal (no-drug) condition was measured just before the drug condition. Circles, Unpaired measurement. B, In simulations, ⌬ is also maximum for ⬵ 1. Symbol indicates network size (circles, N ⫽ 250; squares, N ⫽ 500; triangles, N ⫽ 1000). Lines represent binned averages.
ences into distinguishable network outputs, our result is also closely related to network-mediated separation, which has been predicted to peak at criticality, at the transition from ordered to chaotic dynamics (Bertschinger and Natschlager, 2004; Legenstein and Maass, 2007). In contrast, our results show that variability of response to a given stimulus is highest at criticality. Further investigation of reliability versus variability in cortical networks is warranted. Considering the simplicity of our model with all-to-all connectivity, absence of refractory period, and approximating inhibition by reducing , the overall agreement in the ⌬– relationship between experiment and simulation is remarkable. The increase of variability in ⌬ as well as the drop in ⌬ due to deviation from ⫽ 1 was well matched between experiment and simulations. Such similarity supports the notion that universal principles, independent of system details, are found at criticality (Stanley, 1971; Bak and Paczuski, 1995; Jensen, 1998). The main quantitative difference was the lower ⌬ values for experiments compared to the model. Experimental noise, which is absent in the model, effectively adds a constant value to Smin and Smax, which systematically reduces ⌬. Further neurophysiological insight into our results can be gained from Figure 3. There it is shown that networks poorly discriminate small inputs in the hypoexcitable state, whereas they tend to saturate, failing to discriminate larger inputs in the hyperexcitable state. Both these reductions in performance result in reduced dynamic range compared to balanced networks. In line with these findings, dissociated cultures respond to inputs with a “network spike” if ⬎ 1 (Eytan and Marom, 2006) and display a
15600 • J. Neurosci., December 9, 2009 • 29(49):15595–15600
“giant component” in a hyperexcitable regime, which reduces the ability to discriminate inputs (Breskin et al., 2006). The balance of excitation and inhibition has been shown to be crucial for developing cortical circuits to accurately process sensory inputs (Hensch, 2005). Our results suggest that, functionally, the balance of excitation and inhibition is achieved when the dynamic range is maximized and cortical networks operate at criticality.
References Arieli A, Sterkin A, Grinvald A, Aertsen A (1996) Dynamics of ongoing activity: explanation of the large variability in evoked cortical responses. Science 273:1868 –1871. Azouz R, Gray CM (1999) Cellular mechanisms contributing to response variability of cortical neurons in vivo. J Neurosci 19:2209 –2223. Bak P, Paczuski M (1995) Complexity, contingency, and criticality. Proc Natl Acad Sci U S A 92:6689 – 6696. Beggs JM, Plenz D (2003) Neuronal avalanches in neocortical circuits. J Neurosci 23:11167–11177. Bertschinger N, Natschla¨ger T (2004) Real-time computation at the edge of chaos in recurrent neural networks. Neural Comput 16:1413–1436. Breskin I, Soriano J, Moses E, Tlusty T (2006) Percolation in living neural networks. Phys Rev Lett 97:188102. Buice MA, Cowan JD (2007) Field-theoretic approach to fluctuation effects in neural networks. Phys Rev E Stat Nonlin Soft Matter Phys 75:051919. Eytan D, Marom S (2006) Dynamics and effective topology underlying synchronization in networks of cortical neurons. J Neurosci 26:8465– 8476. Fiser J, Chiu C, Weliky M (2004) Small modulation of ongoing cortical dynamics by sensory input during natural vision. Nature 431:573–578. Gireesh ED, Plenz D (2008) Neuronal avalanches organize as nested thetaand beta/gamma-oscillations during development of cortical layer 2/3. Proc Natl Acad Sci U S A 105:7576 –7581. Go¨tz M, Bolz J (1992) Formation and preservation of cortical layers in slice cultures. J Neurobiol 23:783– 802. Harris TE (1989) The theory of branching processes. New York: Dover. Hensch TK (2005) Critical period plasticity in local cortical circuits. Nat Rev Neurosci 6:877– 888. Jensen HJ (1998) Self-organized criticality. Cambridge, UK: Cambridge UP. Kenet T, Bibitchkov D, Tsodyks M, Grinvald A, Arieli A (2003) Spontane-
Shew et al. • Dynamic Range Maximized during Neuronal Avalanches ously emerging cortical representations of visual attributes. Nature 425:954 –956. Kinouchi O, Copelli M (2006) Optimal dynamical range of excitable networks at criticality. Nat Phys 2:348 –351. Kisley MA, Gerstein GL (1999) Trial-to-trial variability and statedependent modulation of auditory-evoked responses in cortex. J Neurosci 19:10451–10460. Legenstein R, Maass W (2007) Edge of chaos and prediction of computational performance for neural circuit models. Neural Netw 20:323–334. Luczak A, Bartho´ P, Harris KD (2009) Spontaneous events outline the realm of possible sensory responses in neocortical populations. Neuron 62:413– 425. Ohl FW, Scheich H, Freeman WJ (2001) Change in pattern of ongoing cortical activity with auditory category learning. Nature 412:733–736. Petermann T, Thiagarajan TC, Lebedev MA, Nicolelis MA, Chialvo DR, Plenz D (2009) Spontaneous cortical activity in awake monkeys composed of neuronal avalanches. Proc Natl Acad Sci U S A 106:15921–15926. Plenz D, Kitai ST (1996) Generation of high-frequency oscillations in local circuits of rat somatosensory cortex cultures. J Neurophysiol 76:4180 – 4184. Plenz D, Thiagarajan TC (2007) The organizing principles of neuronal avalanches: cell assemblies in the cortex? Trends Neurosci 30:101–110. Stanley HE (1971) Introduction to phase transitions and critical phenomena. New York: Oxford UP. Stewart CV, Plenz D (2006) Inverted-U profile of dopamine-NMDAmediated spontaneous avalanche recurrence in superficial layers of rat prefrontal cortex. J Neurosci 26:8148 – 8159. Stewart CV, Plenz D (2008) Homeostasis of neuronal avalanches during postnatal cortex development in vitro. J Neurosci Methods 169:405– 416. Tanaka T, Kaneko T, Aoyagi T (2009) Recurrent infomax generates cell assemblies, neuronal avalanches, and simple cell-like selectivity. Neural Comput 21:1038 –1067. Tsodyks M, Kenet T, Grinvald A, Arieli A (1999) Linking spontaneous activity of single cortical neurons and the underlying functional architecture. Science 286:1943–1946. Yao H, Shi L, Han F, Gao H, Dan Y (2007) Rapid learning in cortical coding of visual scenes. Nat Neurosci 10:772–778. Zapperi S, Bægaard LK, Stanley HE (1995) Self-organized branching processes: mean-field theory for avalanches. Phys Rev Lett 75:4071– 4074.