Neuronal avalanches organize as nested thetaand beta/gamma-oscillations during development of cortical layer 2/3 Elakkat D. Gireesh and Dietmar Plenz* Laboratory of Systems Neuroscience, National Institute of Mental Health, 9000 Rockville Pike, Bethesda, MD 20892 Edited by Nancy J. Kopell, Boston University, Boston, MA, and approved March 27, 2008 (received for review January 18, 2008)
Maturation of the cerebral cortex involves the spontaneous emergence of distinct patterns of neuronal synchronization, which regulate neuronal differentiation, synapse formation, and serve as a substrate for information processing. The intrinsic activity patterns that characterize the maturation of cortical layer 2/3 are poorly understood. By using microelectrode array recordings in vivo and in vitro, we show that this development is marked by the emergence of nested - and /␥-oscillations that require NMDAand GABAA-mediated synaptic transmission. The oscillations organized as neuronal avalanches, i.e., they were synchronized across cortical sites forming diverse and millisecond-precise spatiotemporal patterns that distributed in sizes according to a power law with a slope of ⴚ1.5. The correspondence between nested oscillations and neuronal avalanches required activation of the dopamine D1 receptor. We suggest that the repetitive formation of neuronal avalanches provides an intrinsic template for the selective linking of external inputs to developing superficial layers. dopamine 兩 in vivo 兩 multielectrode array 兩 organotypic culture 兩 rat
T
he development of the cortex is marked by distinct patterns of synchronized neuronal activity that emerge spontaneously, are preserved across different species, and regulate many cellular processes (1–4). In the early developing, deep cortical layers (5), the emergent activity is characterized by spindleoscillations (⬍15 Hz) (2, 6, 7). In contrast, the patterns of neuronal synchronization for the late-developing, superficial layer 2/3 are poorly understood. For the mature layer 2/3, at least two varieties of spontaneous synchronization have been reported. Fast oscillations such as ␥-oscillations (30–100 Hz) have been described in vivo (8, 9) and in vitro (10, 11) and reflect rapid neuronal synchronization that is thought to be important for sensory processing, motor activity, and cognitive functions (for the latest reviews, see refs. 12 and 13). Although ␥-oscillations are easily recognizable in the local population activity, their transient nature in the form of coherent bursts of variable duration, their amplitude modulation, and cooccurrence with -oscillations (15–30 Hz) (14) has made it difficult to identify the organization of spatiotemporal patterns that emerges from this activity. We recently described another type of spatiotemporal dynamics in mature layer 2/3 of rat cortex in vitro (15–18), which we termed ‘‘neuronal avalanches.’’ Neuronal avalanches are characterized by a scaling property in which neuronal synchronization, as measured in the local field potential (LFP) at different cortical sites, emerges in the form of highly diverse spatiotemporal patterns that distribute in size s according to a power law P(s) ⬀ s␣ and ␣ ⫽ ⫺1.5. The relationship in pattern organization between coherent, oscillatory bursts and neuronal avalanches and how both activities emerge in the developing layer 2/3 is not clear. Here, we show in vivo and in vitro that cortical layer 2/3, at the time of their maturation, establish a dynamics characterized by nested - and /␥-oscillations. Importantly, the oscillations are coherent between cortical sites such that the resulting diverse spatiotemporal patterns follow the power law statistics described 7576 –7581 兩 PNAS 兩 May 27, 2008 兩 vol. 105 兩 no. 21
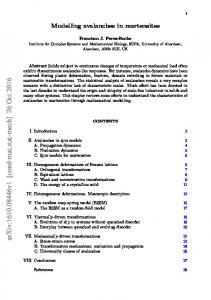
for neuronal avalanches. Our findings unify two seemingly different views of neuronal synchronization—oscillations and avalanches—and suggest that the superficial layers form a ‘‘critical state’’ (15, 19, 20) during cortical maturation that allows for the spontaneous, repetitive formation of diverse synchronized neuronal groups. Results We measured spontaneous neuronal activity in rat cortical layer 2/3 at the beginning and the end of the second week postnatal, the time of superficial layer development (8 ⫾ 1 postnatal days, P8, n ⫽ 5; P13 ⫾ 2, P13, n ⫽ 7). An 8 ⫻ 4 microelectrode array (MEA) was inserted 1 mm deep into the somatosensory cortex of urethane-anesthetized rats (Fig. 1A) to record spontaneous LFP activity (1–200 Hz; 4-kHz sampling per electrode). At P8, the LFP revealed oscillatory periods lasting ⬇200 ms that occurred at a rate of 0.86 ⫾ 0.05 s⫺1 on the MEA (Fig. 1C Left). Wavelet analysis demonstrated the presence of - (4–15 Hz), - (15–30 Hz), and ␥-oscillations (30–100 Hz) during bursts (Fig. 1E Left). At P13, bursts appeared slightly more often (1.15 ⫾ 0.1 s⫺1; P ⫽ 0.04) with significantly increased amplitude (P ⫽ 0.005) and durations (P ⫽ 0.004) (Fig. 1 G and H). Importantly, between P8 and P13, the power at corresponding peak frequencies increased 10- to 50-fold for each frequency range and the bursts now clearly revealed a temporal organization of ␥- and/or -oscillations nested into -oscillations (Fig. 1 C Right, E Right, and I), which we will refer to as ‘‘nested - and /␥-oscillations.’’ During the second week postnatal, the nested oscillations also became more synchronized between cortical sites (Fig. 2). Based on wavelet analysis, we quantified the neuronal synchronization between sites for each frequency, i.e., coherence, and found significant coherence at distinct frequency peaks at P8 and P13 (Fig. 2 A and B) (peak ⫽ 6.24 ⫾ 0.34 Hz; peak ⫽ 22.63 ⫾ 0.21 Hz; ␥peak ⫽ 37.97 ⫾ 0.07 Hz). The coherence was low early during development, however, significantly increased at P13 (, 100%, P ⬍ 0.001; , 50%, P ⬍ 0.001; ␥, 32%, P ⬍ 0.001) showing a clear distance dependence for each of the three frequency bands (Fig. 2C). The emergence of synchronized nested - and /␥-oscillations during the second week postnatal could reflect a change in cortical organization or, alternatively, a change in the sensitivity to urethane anesthesia. It is well established that layer 2/3 Author contributions: E.D.G. and D.P. designed research; E.D.G. performed research; E.D.G. analyzed data; and E.D.G. and D.P. wrote the paper. Conflict of interest statement: Provisional patent filing PCT/US2006/03 1884 ‘‘Neuronal Avalanche Assay.’’ This article is a PNAS Direct Submission. *To whom correspondence should be addressed at: Section on Critical Brain Dynamics/ Laboratory of Systems Neuroscience, Porter Neuroscience Research Center, National Institute of Mental Health, Room 3A-100, 35 Convent Drive, Bethesda, MD 20892. E-mail:
[email protected]. This article contains supporting information online at www.pnas.org/cgi/content/full/ 0800537105/DCSupplemental.
www.pnas.org兾cgi兾doi兾10.1073兾pnas.0800537105
A
in vivo
B
I
in vitro
MEA
1 II/III
PIA 32
Cortex
1mm
IV
I 60
I
II/III
V/VI
IED 200 μm
V/VI
WM
V/VI
WM
VTA
VTA
C
P8
D
P13
12 DIV
400 µm
WM
14 DIV
40 μV 200 ms
20 μV 1s
E
75
50
50
25
25
12
in vivo
*
50
0
600
time (ms)
H
in vitro
nLFP (μV)
G
0
800
in vivo
I
in vitro
*
200
0
0 8 13
P
12
DIV
18
0
80
8 13
6
P
12
DIV
18
0
*
600
time (ms)
in vivo
*
10
0
in vitro
*
1
0.1
0 6
0
600
time (ms)
Relative Power
0
2 mV 16
100
75
Duration (ms)
Frequency (Hz)
F
2 mV 8
100
4 - 15 Hz 15 - 30 Hz 30 - 100 Hz
θ
β
γ
6
12
18
DIV
Fig. 1. Nested - and /␥-oscillations emerge during maturation of cortical layer 2/3. (A) Sketch of the 8 ⫻ 4 MEA placement in somatosensory cortex in vivo. (Left) PIA, pia mater; WM, white matter; IED, interelectrode distance of 200 m. (Right) The 60-m-thick Nissl-stained section with tracks from four electrode shanks (arrows). (B) (Left) Sketch of the 8 ⫻ 8 MEA placement in the cortex–VTA coculture. (Right) Light microscopic image of the living coculture (12 DIV). IED, 200 m. (C and D) Spontaneous bursts at P8 and P13 in vivo (C) and at DIV 14 in vitro (D). Brackets, Periods in E and F. (E) Nested - and /␥-oscillations emerge during the second week postnatal in vivo. Time–frequency plot for burst periods in C at P8 (Left) and at P13 (Right) in vivo. (F) Nested - and /␥-oscillations in vitro. Time–frequency plot for burst period in D. (G and H) Burst amplitude (G) and duration (H) increase significantly during the second week postnatal. (I) -, -, and ␥-frequency power increases significantly during second week postnatal (normalized to power at P8 in vivo and DIV 6 in vitro).
develops in organotypic cortex cultures prepared from tissue taken at early postnatal age (10, 21, 22). Therefore, slices of somatosensory cortex and the ventral tegmental area (VTA), which provides dopaminergic input to the cortex that facilitates the maturation of layer 2/3 fast-spiking interneurons (23), were taken at P1–P2 and cocultured on planar 8 ⫻ 8 MEAs (Fig. 1B). Spontaneous extracellular activity in the cortex culture was recorded for up to 17 days in vitro (DIV) (Fig. 1 D and F) (n ⫽ 15 cultures). Activity before 6 DIV was low and mainly composed of sparse multiunit activity; however, oscillatory bursts in the LFP emerged at 6–8 DIV corresponding to the beginning of the second week postnatal in vivo. As found in vivo, the bursts lasted several hundreds of milliseconds and increased in amplitude and duration during the second week (Fig. 1 G and H). The frequency composition of bursts in vitro also paralleled our findings in vivo. The bursts at 6 DIV were composed of nested - and /␥-oscillations that rapidly increased in power by an order of magnitude within the first half of the second week in culture (Fig. 1 F and I). Two-dimensional current-source density analysis (see Gireesh and Plenz
Materials and Methods) [supporting information (SI) Fig. S1] demonstrated that the nested oscillations were located in the upper region of the cortical culture, which corresponds to cortical layer 2/3 (21). These similarities in our in vivo and in vitro experiments support the idea that the emergence of nested and /␥-oscillations reflects the development of layer 2/3. Nested - and /␥-Oscillations Carry the Signature of Neuronal Avalanches. The transient nature and amplitude modulation of
the coherent, nested oscillations suggest an underlying diversity in neuronal activity. We therefore recorded simultaneously multiunit activity (MU) (0.3–3 kHz) and the LFP at each electrode and calculated spike-triggered LFP averages. We consistently found in vivo and in vitro that the preferred time of neuronal spiking correlated with negative LFP deflections (nLFP) (Fig. 2D and Fig. S2) (n ⫽ 3 rats; n ⫽ 4 cultures), in line with findings in vivo during ␥-activity (9, 24–26). Correspondingly, the density of extracellular unit activity peaked clearly within ⫾2 ms of the nLFP both in vivo and in vitro (Fig. 2D Right and Fig. S2). These results suggest that characterizing the PNAS 兩 May 27, 2008 兩 vol. 105 兩 no. 21 兩 7577
NEUROSCIENCE
1
A
B 0.015 CC(τ)
20 μV 100 ms
Elec. (n)
0 -0.2
1
0 n+2 n+3
n+1
τ max
μV 30
32
n
P8 P 13
C 0.3-
0.2
in vivo Average
10 1
n+4 n+5
0
Time (s)
P8 P13
P(s) 10-3
-
10 5 2
D
E 10
Original
F10
Single
0
600
Size s (μV)
0
Average
I Original
P(s)
P(s)
II Shuffled
20 μV 500 ms
10-3
10-3
Shuffled
I
spatiotemporal organization of nLFPs might provide insight into the diverse spatiotemporal organization of synchronized neuronal groups in the network. Furthermore, if the size distribution of spatiotemporal nLFP clusters follows the power law P(s) ⬀ s␣, ␣ ⫽ ⫺1.5, the diversity would be similar to that described for neuronal avalanches (16–18). We therefore first identified nLFPs at each electrode by negative threshold crossing and combined all nLFPs on the array (Fig. 3A Top) into a raster of nLFP times with corresponding amplitudes (Fig. 3A Middle). We then binned the raster at the temporal resolution ⌬tavg, which is the average time between successive nLFPs on the array (⌬tavg ⫽ 3.70 ⫾ 0.33 ms, P8; 2.01 ⫾ 0.21 ms, P13; P ⫽ 0.01) (see Materials and Methods) (16). Finally, we concatenated nLFPs on successive time bins of width ⌬tavg into nLFP clusters until a time bin with no nLFP was encountered (Fig. 3A Bottom). The size s of an nLFP cluster, either expressed as number of nLFPs, or the absolute sum of nLFP amplitudes, was calculated and the density of cluster sizes, P(s), was further examined. At P8 in vivo, the nLFP clusters occurred at a rate of 2.4 ⫾ 0.3 s⫺1, and P(s), when plotted in log–log coordinates, followed a straight line for sizes ranging from 6 to 60 V, indicating the early presence of a power law with a slope of ␣ ⫽ ⫺1.72 ⫾ 0.05 (Fig. 3C, blue). At P13, the cluster rate had increased 10-fold (19 ⫾ 3 s⫺1; P ⫽ 0.005; P8 vs. P13) and the power law relationship became more robust with a slope of ␣ ⫽ ⫺1.54 ⫾ 0.03 over the 7578 兩 www.pnas.org兾cgi兾doi兾10.1073兾pnas.0800537105
1
G 10
0
Size s (n) 40
H 10-
Single
P(s)
1
P(s) 10 4
10-3
Size s (n) 40
1
in vitro Average
0.03 CC(τ)
Fig. 2. Coherence between cortical sites peaks at -, -, and ␥-frequencies. (A) Time course and corresponding time– coherence plot for two simultaneous bursts separated by 600 m. Note transient period of high coherence at - and ␥-frequencies at ⬇500 ms and a longer lasting coherence at -frequency. (B) Time-averaged coherence spectrum (black) from A reveals peaks in the -, -, and ␥-frequency band. (Red) Expected coherence from corresponding timeshifted traces. (C) Change in coherence during the second week and distance (d) dependence of the coherence for -, -, and ␥-frequencies (normalized to corresponding coherence from time-shift traces). (D) Summary of size and relative timing of the average nLFP peak for all electrodes with MU activity (in vivo; n ⫽ 3 experiments; colors). (Left) Average MU-triggered LFP waveform at one electrode. (Center) Average nLFP amplitude normalized to the SD of the average nLFP from randomly chosen time points within a burst. (Right) MU-activity peaks around the time of the nLFP. Average unit density functions around the time of nLFP occurrences.
10-5
10-5
II
0 -0.2
τ max 0 Time (s)
0.2
8
10-
10-5 2
Size s (μV)
600
10
Size s (μV)
10000
Fig. 3. Nested - and /␥-oscillations organize in the form of neuronal avalanches. (A) Definition of neuronal avalanches formed by the nested - and /␥-oscillations. (Top) Threshold detection (broken line) of nLFPs (filled circles) at a single electrode. (Middle) Corresponding time–amplitude raster plot of nLFPs on the MEA (color: nLFP amplitude). (Bottom) Spatiotemporal nLFP clusters occupy successive bins of width ⌬tavg (dotted rectangles). (B) Average cross-correlation function for nLFPs in vivo at P8 (red) and P13 (black; single experiments). (C) nLFP clusters from nested - and /␥-oscillations organize in the form of neuronal avalanches, i.e., distribute in sizes according to a power law with slope close to ␣ ⫽ ⫺1.5 (broken line). Average cluster size distribution in vivo plotted in log–log coordinates for P8 (red open circles; n ⫽ 5) and P13 (black; n ⫽ 7). (D) Example of two simultaneous burst periods before (black) and after (red) phase-shuffling. (E) The power law in cluster sizes is established for cluster area and cluster intensity (G) in single in vivo experiments and in the average (n ⫽ 7; F; cp. also C; all P13), but is destroyed on phase-shuffling of the LFP (open red). (H) Average cluster size distribution in vitro follows a power law with slope ␣ ⬵ ⫺1.5 (broken line; n ⫽ 15; ⱖ10 DIV). (Inset) Average nLFP cross-correlation function for single experiment.
range of 8–300 V in cluster size (Fig. 3C, black). This slope is close to the exponent of ␣ ⫽ ⫺1.5 reported previously for neuronal avalanches in mature cortex tissue (16, 18). The power law did not simply arise from widely varying, noisy neuronal activities within and across experiments, but instead indicated the presence of long-range spatiotemporal correlations that crucially depended on the precise phase relationships of the nested oscillations across sites. First, the power law was readily obtained for single experiments; thus, it did not result from averaging across widely different experimental out comes (Fig. 3 E and G). Second, phase-shuffling of the oscillations in the frequency domain destroyed the power law with a corresponding loss in large nLFP clusters (Fig. 3 D–G, open red circles). Third, Gireesh and Plenz
similar results were obtained when cluster sizes were calculated in the form of participating electrodes per cluster, which measures the spatial extend of a cluster, i.e., cluster area (Fig. 3 E and F). The correspondence between the nested oscillations and neuronal avalanches was demonstrated also in vitro in the cortex–VTA cocultures. For cultures older than 9 DIV, a power law ranging from 10 to ⬇10,000 V described the distribution of nLFP cluster size s with a corresponding slope value of ␣ ⫽ ⫺1.53 ⫾ 0.02, which, again, is close to ⫺1.5 (Fig. 3H) (n ⫽ 15 cultures) (see also Fig. S3). Finally, the lifetime distribution for neuronal avalanches arising from nested oscillations in vivo and in vitro was also in accordance with the lifetimes of neuronal avalanches in mature cortex (Fig. S4). These results established a clear correspondence between neuronal avalanches as described for the mature cortex and coherent nested /␥oscillations during the development of superficial layers.
profile of the nested oscillations to better understand their dependence on the properties of the cortical network. Blockade of fast inhibition by using the GABAA receptor antagonist picrotoxin (10 M) changed the sinusoidal-like nested oscillations into prolonged periods of ictal-like, sharp waves (Fig. 4A). Correspondingly, the relatively narrow and well defined ␥-frequency peak in the power spectrum broadened substantially with a reduction in peak frequency (P ⫽ 0.03, n ⫽ 3) and power (Fig. 4 A–D) (P ⫽ 0.02), whereas the power for the peak -frequency increased (Fig. 4D) (P ⫽ 0.008). As reported for mature cortex (18), picrotoxin also destroyed the power law in avalanche size distribution and supported a preferential increase in large avalanches (Fig. 4E). The nested oscillations also depended on glutamatergic synaptic transmission. The glutamate NMDA receptor antagonist DL-2-amino-5-phosphonopentanoic acid (AP5) (50 M) abolished ␥-oscillations by reducing the power at the peak ␥- and -frequency by 80 and 50%, respectively (Fig. 4D) (P ⫽ 0.01, P ⫽ 0.02, n ⫽ 3) without changing the peak frequencies (Fig. 4C). Correspondingly, blockade of the NMDA receptor abolished the power law (Fig. 4E). In contrast, the AMPA receptor antagonist 6,7-dinitroquinoxaline-2,3(1H,4H)-dione (DNQX) (10 M), whereas reducing the peak ␥-frequency by ⬇10 Hz, did not change the ␥-power (P ⫽ 0.01, n ⫽ 3) and maintained the power law in avalanche size with a slope ␣ near ⫺1.5 (Fig. 4 B and E) (⫺1.59 ⫾ 0.02, pre; ⫺1.66 ⫾ 0.05, drug; ⫺1.63 ⫾ 0.04, post) (P ⫽ 0.6). Blockade of fast glutamatergic and GABAergic inhibition did not induce significant changes in the -frequency range. The maturation of layer 2/3 in rat cortex involves a shift from gap junction (27, 28) to chemical synapse-mediated communication (29). In line with this transition, the gap junction blocker carbenoxolone, which reduces fast oscillations in entorhinal cortex at 0.1 mM (11), did not affect the nested oscillations at this concentration (n ⫽ 3) (Fig. S5). Finally, because our mesencephalic VTA slice might have included cholinergic subcortical tissue, we also tested for the effect of muscarinic (M1) receptors, which are reported to induce cortical - and ␥-oscillations during the first week postnatal (30). However, the cholinergic M1 receptor antagonist pirenzepine did not affect the nested oscillations in cortical layer 2/3 (10 M; n ⫽ 3) (Fig. S5). To summarize, the pharmacological profile of the nested oscillations and neuronal avalanches demonstrate that this dynamics arises from an immature excitatory–inhibitory network with a dominance of GABAA and glutamate NMDA receptormediated synaptic transmission that is independent of gapjunction coupling. Gireesh and Plenz
Fig. 4. Nested - and /␥-oscillations in vitro predominantly depend on the GABAA and glutamatergic NMDA receptor. (A) Example bursts before (Pre), during (Drug), and after drug application (Wash). Picrotoxin (PTX) (10 M) (Left) induces prolonged, ictal-like bursts, whereas DNQX (10 M) has no effect (Center). In contrast, AP5 (50 M) (Right) selectively abolishes highfrequency oscillations. (B) Time-averaged wavelet spectrum of the colorcoded traces in A. Note the shift toward -oscillations caused by PTX and the block of high-frequency oscillations by AP5. (C) Change in peak frequency within each frequency band for all three antagonists. (D) Change in peak power within each frequency band (normalized to the pre condition). (E) Disinhibition by PTX increases the number of large avalanche sizes (Left; arrow), whereas AP5 blocks most avalanches (Right; arrow; single cultures). For better visualization, each distribution was normalized to the maximum value of P and transformed by P 3 P 䡠 s⫺␣ (␣ taken from precondition). This transformation changes the power law into a horizontal distribution.
Dopamine Regulates the Correspondence Between Nested Oscillations and Avalanches. In the adult cortex, dopamine D1 receptor
stimulation regulates neuronal avalanche formation (16) and increases pyramidal cell to fast-spiking interneuron coupling (31) that facilitates the formation of ␥-oscillations (32). We therefore tested whether the neuromodulator dopamine regulates the correspondence between nested oscillations and neuronal avalanches early during development. Indeed, we found in vivo and in vitro that the dopamine D1 receptor antagonist R(⫹)-7-chloro-8-hydroxy-3-methyl-1-phenyl-2,3,4,5-tetrahydro1H-3-benzazepine hydrochloride (SCH23390) (20 M) selectively reduced the ␥-oscillation power (Fig. 5 A, D, and E) (␥: ⫺33%, P ⫽ 0.01, ⫺61%, P ⫽ 0.03; n ⫽ 5 in vivo; n ⫽ 6 in vitro). Importantly, the antagonist made the avalanche size distribution steeper (Fig. 5 B and C) (␣ ⫽ ⫺1.74 ⫾ 0.02, P ⫽ 0.003, in vivo; PNAS 兩 May 27, 2008 兩 vol. 105 兩 no. 21 兩 7579
NEUROSCIENCE
Nested - and /␥-Oscillations Require GABAA and Glutamate NMDA Receptor Activation. We then identified the pharmacological
A
B
Pre
P.s-α
in vivo 1
C
in vitro
Pre
0.03 40 μV 100 ms
1
P.s-α
SCH
SCH
0.03 1
P.s-α
Wash
Wash
Pre SCH Wash
*
*
1
0
in vivo in vitro
E 80
F3 γ–Coh. (rel.)
γ– Power (rel.)
D2
6
Size s (μV) 600
γ–Freq. (Hz)
0.03 2
Size s (μV) 6000
* *
1
0
in vivo in vitro
in vivo
in vitro
Fig. 5. Tonic dopamine D1 receptor activation organizes nested - and /␥-oscillations into neuronal avalanches. (A) In vitro example bursts before (pre), during SCH23390 (SCH) (10 M), and after (wash). (B) SCH23390 reduces the probability of large avalanches in vivo. The size distribution of avalanches before (Top), during (Middle), and after (Bottom) drug application are overplotted for each experiment (n ⫽ 5; P12–P15, color-coded). Each distribution was normalized and transformed by P 3 P 䡠 s⫺␣. A downward tilt from the horizontal precondition (upper arrow) and early cutoff in the distribution (bottom arrow) indicates a reduction in large avalanches, i.e., a steeper slope ␣ in the distribution (slope: P ⫽ 0.003; pre vs. drug). (C) Change in slope ␣ in response to 10 M SCH23390 for the in vitro networks (DIV 10 –15). As shown in B for in vivo, SCH23390 reduces the probability of larger avalanches (n ⫽ 6; ⬎DIV 10, color-coded; slope, P ⫽ 0.003; pre vs. drug). (D) The power at peak ␥-frequency is reduced by SCH23390 (⫺33%, P ⫽ 0.01 in vivo; ⫺61%, P ⫽ 0.03 in vitro). (E) The peak ␥-frequency is unaffected by SCH23390 (P ⬎ 0.2 in vivo; P ⬎ 0.1 in vitro). (F) The coherence across electrodes at peak ␥-frequency is reduced by SCH23390 (in vivo: mean, ⫺32%, P ⬍ 0.001; in vitro: mean, ⫺40%, P ⫽ 0.005).
␣ ⫽ ⫺1.60 ⫾ 0.03, P ⫽ 0.006, in vitro), indicating a relative reduction of large avalanches, and significantly reduced the coherence of ␥-oscillations for all distances on the array (Fig. 5F) (in vivo: mean ⫽ ⫺32%, P ⬍ 0.001; in vitro: mean ⫽ ⫺40%, P ⫽ 0.005). The antagonist did not change oscillatory burst amplitudes, nor burst durations in vivo or in vitro (P ⫽ 0.88, P ⫽ 0.43). Whereas a small reduction in power was also observed in the -frequency band (in vivo: ⫺17%, P ⫽ 0.03; in vitro: ⫺30%, P ⫽ 0.3), no reduction was observed in the -frequency band (in vivo: P ⫽ 0.3; in vitro: P ⫽ 0.16). In contrast, the dopamine D2 receptor antagonist sulpiride did not significantly alter the avalanche size distribution or oscillatory bursts (Fig. S6). These findings establish a developmental role for dopamine for the emergence of nested oscillations and neuronal avalanches. Discussion We demonstrated that coherent - and /␥-oscillations spontaneously emerged during the formation of superficial cortical layers and that the resulting spatiotemporal patterns of neuronal synchronization were equivalent to neuronal avalanches. Thus, the transient nature of the coherent, oscillatory bursts results in diverse spatiotemporal activity patterns that follow a precise scaling relationship given by the power law in pattern sizes with an exponent of ⫺1.5 (15). 7580 兩 www.pnas.org兾cgi兾doi兾10.1073兾pnas.0800537105
Earlier studies have shown coherent oscillations in the form of spindle bursts or delta-brushes during cortex development in vivo and in vitro (2, 6, 7). Spindle bursts occur during the first week postnatal, are located in deep cortical layers, show a low frequency range (5–25 Hz), and only weakly depend on the GABAA and NMDA receptor. In contrast, the nested - and /␥-oscillations reported in the present study emerge during the second week postnatal in superficial layers, cover a frequency range from 4 to 100 Hz, and depend on the GABAA and glutamate NMDA receptor. Correspondingly, the fast time course of the nested - and /␥-oscillations requires a mature GABAergic system (33) that develops between P10 and P15 in rat cortex (34). The differential effect of GABAA blockade on ␥- and -oscillations in the current study has also been found for kainate-induced cortical /␥-activity in vitro for later developmental stages (35). The reduction in ␥-oscillations is in line with an inhibitory interneuron microcircuit in layer 2/3 that is responsible for ␥-activity (32). The enhancement of - power could result from a change in local microcircuit dynamics (36), an ‘‘uncovering’’ of -generation from deeper layers (35), or simply reflect a frequency component arising from the ictal spikes. The sensitivity of the dynamics to the NMDA and not the AMPA receptor antagonists early during development suggests an immature glutamatergic network (4), whose temporal dynamics is mainly determined by the fast inhibition. Our results also established that this immature network requires dopamine D1 receptor activation to maintain the correspondence between nested oscillations and neuronal avalanches. The linking of the coherence of the fast /␥-oscillations to an absolute criterion, i.e., the power law exponent ␣ ⫽ ⫺1.5, might allow for a simple and direct evaluation of the amount of oscillation synchrony necessary to maintain the default network state of cortical layer 2/3. Conversely, a deviation from ␣ ⫽ ⫺1.5 could identify pathological conditions related to ␥-oscillations, NMDA receptor functioning, and/or dopamine during development, as, e.g., suggested for schizophrenia (37, 38). The neuronal avalanches capture a large variety of spatiotemporal patterns. In the temporal domain these patterns range from ‘‘instantaneous synchronization,’’ i.e., when all nLFPs are in one time bin, to ‘‘sequential synchronization’’ (39) when each nLFP occupies exactly one time bin. In the spatial domain, the patterns can include just one or all sites in the network. In contrast, coherent oscillations in a homogenous medium produce much simpler patterns, for example, stationary or traveling waves. Such waves would represent synchronized or successive activation of neurons at all sites in the network at every cycle of the oscillation: a relatively simple pattern. Our findings suggest that coherent oscillations in superficial layers coexist with complex spatiotemporal patterns whose diversity is quantified by the power law in pattern size distribution. Thus, the network dynamics produces avalanches that approximately repeat at peak /␥-oscillation frequency where spatial patterns for all sizes n ⫻ s are n⫺1.5 less likely to occur than patterns of size s (n is a constant; see also ref. 15). Although power laws in event size distributions can result from various mechanisms (40), such distributions will arise when a system is in a ‘‘critical state’’ as pioneered by complex systems research in statistical physics (19, 41). Critical state dynamics allows local events to percolate through the system: although the most likely event in the system is local, i.e., of relatively small size, large events that engage many sites cannot be ignored. Such an organization of cortical activity, which is regulated homeostatically (42), differs profoundly from disinhibited activity, where most events are either small and local or very large and engage most of the network resulting in bimodal event size distributions (18). Neuronal modeling suggests that networks in a critical state optimize information transfer and the dynamical range of input– output processing (18, 43, 44), increase speed and complexity of Gireesh and Plenz
Materials and Methods Rats were anesthetized with urethane (1.25–1.75 g/kg body weight, i.p.). The MEA (Neuronexus Technologies) was inserted in the coronal plane into the somatosensory cortex (⬇3 mm lateral, 1 mm caudal to bregma) (Fig. 1 A). The animal was hydrated frequently (Ringer’s lactate solution; 0.5–1 ml/h, i.p.) and was monitored for respiratory rate (80 –120/min), tail color, and tail pinch reflex. Anesthesia was maintained with supplemental doses of urethane (⬇0.25 g/kg). After the recordings, the brains were fixed in paraformaldehyde, sectioned, and Nissl-stained to reconstruct the electrode locations. Coronal slices from rat somatosensory cortex (350 m thick) and the VTA (500 m thick) were taken from pups (P0 –P2; Sprague–Dawley), placed on a poly-D-lysine-
1. Spitzer NC (2006) Electrical activity in early neuronal development. Nature 444:707– 712. 2. Khazipov R, Luhmann HJ (2006) Early patterns of electrical activity in the developing cerebral cortex of humans and rodents. Trends Neurosci 29:414 – 418. 3. O’Donovan MJ (1999) The origin of spontaneous activity in developing networks of the vertebrate nervous system. Curr Opin Neurobiol 9:94 –104. 4. Ben-Ari Y (2001) Developing networks play a similar melody. Trends Neurosci 24:353– 360. 5. Ignacio MP, Kimm EJ, Kageyama GH, Yu J, Robertson RT (1995) Postnatal migration of neurons and formation of laminae in rat cerebral cortex. Anat Embryol (Berlin) 191:89 –100. 6. Khazipov R, et al. (2004) Early motor activity drives spindle bursts in the developing somatosensory cortex. Nature 432:758 –761. 7. Minlebaev M, Ben Ari Y, Khazipov R (2007) Network mechanisms of spindle-burst oscillations in the neonatal rat barrel cortex in vivo. J Neurophysiol 97:692–700. 8. Murthy VN, Fetz EE (1992) Coherent 25- to 35-Hz oscillations in the sensorimotor cortex of awake behaving monkeys. Proc Natl Acad Sci USA 89:5670 –5674. 9. Chrobak JJ, Buzsaki G (1998) Gamma oscillations in the entorhinal cortex of the freely behaving rat. J Neurosci 18:388 –398. 10. Plenz D, Kitai ST (1996) Generation of high-frequency oscillations in local circuits of rat somatosensory cortex cultures. J Neurophysiol 76:4180 – 4184. 11. Cunningham MO, et al. (2004) A role for fast rhythmic bursting neurons in cortical gamma oscillations in vitro. Proc Natl Acad Sci USA 101:7152–7157. 12. Fries P, Nikolic D, Singer W (2007) The gamma cycle. Trends Neurosci 30:309 –316. 13. Jensen O, Kaiser J, Lachaux JP (2007) Human gamma-frequency oscillations associated with attention and memory. Trends Neurosci 30:317–324. 14. Steriade M (2006) Grouping of brain rhythms in corticothalamic systems. Neuroscience 137:1087–1106. 15. Plenz D, Thiagarajan TC (2007) The organizing principles of neuronal avalanches: Cell assemblies in the cortex? Trends Neurosci 30:101–110. 16. Stewart CV, Plenz D (2006) Inverted-U profile of dopamine-NMDA-mediated spontaneous avalanche recurrence in superficial layers of rat prefrontal cortex. J Neurosci 26:8148 – 8159. 17. Beggs JM, Plenz D (2004) Neuronal avalanches are diverse and precise activity patterns that are stable for many hours in cortical slice cultures. J Neurosci 24:5216 –5229. 18. Beggs JM, Plenz D (2003) Neuronal avalanches in neocortical circuits. J Neurosci 23:11167–11177. 19. Stanley HE (1971) Introduction to Phase Transitions and Critical Phenomena (Oxford Univ Press, New York). 20. Bak P (1996) How Nature Works: The Science of Self-Organized Criticality (Copernicus Books, New York). 21. Go¨tz M, Bolz J (1992) Formation and preservation of cortical layers in slice cultures. J Neurobiol 23:783– 802. 22. Plenz D, Aertsen A (1996) Neural dynamics in cortex-striatum co-cultures. I. Anatomy and electrophysiology of neuronal cell types. Neuroscience 70:861– 891. 23. Porter LL, Rizzo E, Hornung JP (1999) Dopamine affects parvalbumin expression during cortical development in vitro. J Neurosci 19:8990 –9003. 24. Gray CM, Singer W (1989) Stimulus-specific neuronal oscillations in orientation columns of cat visual cortex. Proc Natl Acad Sci USA 86:1698 –1702.
Gireesh and Plenz
coated 8 ⫻ 8 planar MEA (MultiChannelSystems), cocultured, and recorded in standard culture medium (42). Drugs were either applied topically to the cortex surface (in vivo) or bath-applied (in vitro). One hour/4 h of predrug condition were followed by 15 min/4 h of drug application, followed by up to 1 h/4 h of wash (in vivo/in vitro). SCH23390 (20 M; Sigma-Aldrich) was dissolved in PBS and sulpiride (20 M; RBI) was dissolved in DMSO and further diluted in PBS (⬇0.01% final concentration of DMSO). A Morlet-wavelet (12 suboctaves) was used for frequency and coherence analysis. From the time-averaged wavelet spectrum, the corresponding peak power and frequency was calculated within the -, -, and ␥-frequency bands. Coherence was estimated as the average coherence between the cortical sites with the largest nLFP in relation to all other active sites per nested oscillation period. For neuronal avalanche analysis (16, 18), nLFPs were identified by threshold crossing (⫺4SD at P8 ⫾ 1, ⫺3SD at P13 in vivo, and ⫺3SD in vitro) (Fig. 3) and were grouped into clusters for successive time bins of duration ⌬tavg. The slope ␣ was obtained by linear regression from the cluster size distributions. For further details, see SI Text. ACKNOWLEDGMENTS. We thank Craig Stewart for help with the preparation of the cultures and Drs. T. Petermann, T. Thiagarajan, W. Shew, Y. LeFranc, T. Bellay, H. Parthasarathy, and R. D. McKay for valuable comments during the conduct of this project. This work was supported by the Intramural Research Program of the National Institutes of Health and National Institute of Mental Health.
25. Destexhe A, Contreras D, Steriade M (1999) Spatiotemporal analysis of local field potentials and unit discharges in cat cerebral cortex during natural wake and sleep states. J Neurosci 19:4595– 4608. 26. Hasenstaub A, et al. (2005) Inhibitory postsynaptic potentials carry synchronized frequency information in active cortical networks. Neuron 47:423– 435. 27. Yuste R, Peinado A, Katz LC (1992) Neuronal domains in developing neocortex. Science 257:665– 669. 28. Kandler K, Katz LC (1998) Coordination of neuronal activity in developing visual cortex by gap junction-mediated biochemical communication. J Neurosci 18:1419 –1427. 29. Kandler K, Katz LC (1998) Relationship between dye coupling and spontaneous activity in developing ferret visual cortex. Dev Neurosci 20:59 – 64. 30. Buhl EH, Tamas G, Fisahn A (1998) Cholinergic activation and tonic excitation induce persistent gamma oscillations in mouse somatosensory cortex in vitro. J Physiol 513(Pt 1):117–126. 31. Seamans JK, Yang CR (2004) The principal features and mechanisms of dopamine modulation in the prefrontal cortex. Prog Neurobiol 74:1–58. 32. Bartos M, Vida I, Jonas P (2007) Synaptic mechanisms of synchronized gamma oscillations in inhibitory interneuron networks. Nat Rev Neurosci 8:45–56. 33. White JA, Banks MI, Pearce RA, Kopell NJ (2000) Networks of interneurons with fast and slow ␥-aminobutyric acid type A (GABAA) kinetics provide substrate for mixed ␥- rhythm. Proc Natl Acad Sci USA 97:8128 – 8133. 34. Micheva KD, Beaulieu C (1996) Quantitative aspects of synaptogenesis in the rat barrel field cortex with special reference to GABA circuitry. J Comp Neurol 373:340 –354. 35. Roopun AK, et al. (2006) A beta2-frequency (20 –30 Hz) oscillation in nonsynaptic networks of somatosensory cortex. Proc Natl Acad Sci USA 103:15646 –15650. 36. Kopell N, Ermentrout GB, Whittington MA, Traub RD (2000) ␥ rhythms and  rhythms have different synchronization properties. Proc Natl Acad Sci USA 97:1867–1872. 37. Lewis DA, Levitt P (2002) Schizophrenia as a disorder of neurodevelopment. Annu Rev Neurosci 25:409 – 432. 38. Winterer G, Weinberger DR (2004) Genes, dopamine and cortical signal-to-noise ratio in schizophrenia. Trends Neurosci 27:683– 690. 39. Abeles M (1992) Corticonics (Cambridge Univ Press, New York). 40. Newman MEJ (2005) Power laws, Pareto distributions and Zipf’s law. Contemp Physics 46:323–351. 41. Bak P, Paczuski M (1995) Complexity, contingency, and criticality. Proc Natl Acad Sci USA 92:6689 – 6696. 42. Stewart CV, Plenz D (2008) Homeostasis of neuronal avalanches during postnatal cortex development in vitro. J Neurosci Methods 169:405– 416. 43. Kinouchi O, Copelli M (2006) Optimal dynamical range of excitable networks at criticality. Nat Phys 2:348 –351. 44. Eurich CW, Herrmann JM, Ernst UA (2002) Finite-size effects of avalanche dynamics. Phys Rev E Stat Nonlin Soft Matter Phys 66:066137. 45. Herz AV, Hopfield JJ (1995) Earthquake cycles and neural reverberations: Collective oscillations in systems with pulse-coupled threshold elements. Phys Rev Lett 75:1222– 1225. 46. Legenstein R, Maass W (2007) Edge of chaos and prediction of computational performance for neural circuit models. Neural Netw 20:323–334. 47. Stern EA, Maravall M, Svoboda K (2001) Rapid development and plasticity of layer 2/3 maps in rat barrel cortex in vivo. Neuron 31:305–315.
PNAS 兩 May 27, 2008 兩 vol. 105 兩 no. 21 兩 7581
NEUROSCIENCE
neuronal pattern formation (45, 46), and allow for diverse and precise network synchronization in the absence of epilepsy (17, 18). These aspects could be of importance as the emergence of the neuronal avalanches and nested - and /␥-oscillations during the late second week postnatal coincides with the development of sensory maps in superficial layers (47). Importantly, the transient nature of the nested oscillations results in a repetitive formation of diverse avalanches within a short period. Such a repetition might efficiently link external inputs to spatially diverse, but synchronized neuronal groups in superficial layers.