NEW APPROACH FOR PLANAR PATCH SEGMENTATION USING AIRBORNE LASER DATA Changjae Kim, Ayman Habib Geomatics Engineering, University of Calgary 2500 University Drive NW, Calgary, AB, Canada T2N 1N4
[email protected],
[email protected] Paul Mrstik, Vice President Engineering Terrapoint Canada Inc. 140-1 Antares Drive, Ottawa, Canada, ON K2E 8C4 www.terrapoint.com
[email protected]
ABSTRACT Segmentation of LIDAR data has been repeatedly addressed by prior research in the photogrammetric community. The main motivations behind such research are to abstract the huge number of points in a typical LIDAR survey and to relate the LIDAR discrete points to physical objects. The key challenges for an effective and accurate segmentation of LIDAR data are: 1) defining meaningful neighborhoods among irregularly spaced points; 2) deriving useful attributes for the established neighborhoods; and 3) aggregating neighboring points with similar attributes into clusters. In this paper, we present a new LIDAR segmentation technique for planar patches which addresses the above challenges. First, an existing neighborhood definition, which is based on the physical characteristics of the surface, is adopted. The neighborhood of a given point is defined as neighboring points that belong to the same surface. Such a definition has a positive impact on the derived attributes for the defined neighborhoods. Since we are mainly focusing on the segmentation of planar patches, the derived attribute is the magnitude of the surface normal from the origin to the established plane through LIDAR footprints within a given neighborhood. An accumulator array is used to aggregate points with similar attributes into clusters. To avoid ambiguities resulting from the use of the magnitude of the surface normal as the attribute, we adopt an accumulator array that is based on attributes derived from two origins. Since accumulator arrays cluster spatially separate coplanar patches into one group even though they are physically different, the boundaries of derived clusters are used to resolve ambiguities in clustering. It should be noted that the derived boundaries do not represent the actual boundaries of the physical objects being segmented. In other words, these are the boundaries as determined by the LIDAR footprints, and their deviation from the physical boundaries depends on the average point density of the LIDAR data. Therefore, regularization of the extracted boundaries is introduced so that they are as close to the actual boundaries as possible. Experimental results from real data are introduced to highlight the major components of the proposed methodology and these results have proven its feasibility and robustness. Keywords: LIDAR, segmentation, boundary detection, ambiguity resolution.
INTRODUCTION The advent of LIDAR systems has provided the photogrammetric/remote sensing research community with the potential to satisfy the detail level and complexity requirements of various applications such as creation of Digital Building Models, large scale ortho-photo generation, city modeling, object recognition, and photorealistic 3D models. Therefore, there has been significant interest within the photogrammetric community to develop segmentation methodologies. Various approaches have been suggested since the importance of measurements from LIDAR systems was recognized. Techniques for the segmentation of LIDAR points can be roughly divided into two categories (Vosselman, 2004). In the first category, one includes the techniques that segment point clouds based on the proximity of points and the similarity of attributes locally estimated from the surface. The techniques belonging to second category aggregate points with similar attributes into clusters in a parameter space (or attribute space). ASPRS 2007 Annual Conference Tampa, Florida May 7-11, 2007
Jiang and Bunke (1996) proposed a scan line segmentation methodology which first splits each scan line into straight line segments and merges them with segments of adjacent scan lines based on a similarity criterion. Sithole and Vosselman (2003) adopted and modified this methodology while grouping points on scan lines based on proximity in 3D. The surface growing method, which is adopted for LIDAR points from region growing techniques of image processing, extends seed regions to adjacent points while considering the proximity, similarity and continuity of points (Hoover et al., 1996, and Lee and Schenk, 2001). In other words, the points which are located near the seed region and that have attributes similar to those of the seed region are categorized into the same group as the seed region. This extension of the region is executed iteratively until no more points with similar attributes exist. Compared with the scan line segmentation technique and the surface growing method built in the object space, there are techniques which segment points in the parameter space (or attribute space). The well-known Hough transform (Hough, 1962) can be extended to deal with surfaces in 3D. Each point (x, y, z) in a LIDAR dataset defines a non-vertical plane z = s x x + s y y + d in the 3D parameter space, where s x , and s y represent the slopes in the x and y directions, respectively, and d denotes the z-intercept. One LIDAR point on a planar surface defines a plane in the parameter space. Therefore, points on the same plane intersect in the parameter space at the position that corresponds to the slopes and distance of the plane. The number of planes that intersect at this position is theoretically equal to the number of points in the object space that are located on the planar surface (Vosselman and Dijkman, 2001). In implementation, the parameter space is quantized and the bin with the highest number of planes, which represents the largest amount of points on the corresponding planar surface in the object space, can be used. Another methodology performs clustering based on an attribute vector consisting of the surface texture measures, the parameters of the tangent plane defined from the points neighboring a certain point, etc. (Axelsson, 1999, Mass, 1999, and Filin, 2002). Vosselman et al. (2004) proposed this technique and Filin and Pfeifer (2006) implemented it for segmentation based on normal vectors using a slope adaptive neighborhood. The normal vector slopes in the x and y directions and d, the z-intercept, can be computed from the defined neighborhood. To reduce the dimension of the parameter space for efficiency or memory requirement purposes, a two-dimensional parameter space is first constructed to utilize the normal vector slopes. All normal vectors of points belonging to the same plane are located at the same position in the parameter space because the points have the same normal vector slope. Thus, the points on the planes make the same number of peaks as the planes in the parameter space. The points located at different peaks are separated into different clusters. However, ambiguity arises with planes that have the same slope but different z-intercepts. All points which have similar normal vector slopes are separated based on the remaining parameter d through either the same use of the one-dimensional parameter space or connectivity analysis of the points in the object space. In our view, the above segmentation techniques suffer from the following problems: 1) Surface growing based segmentation depends heavily on the selection of seed points (or seed regions); the segmentation performance might be sensitive to the choice of seed points (Besl and Jain, 1998). 2) The segmentation technique based on the Hough transform does not consider the connectivity of points. This limitation causes the segmentation results to contain many spurious surfaces which do not exist in reality (Vosselman, 2001, Filin, 2002). 3) The clustering techniques based on the attribute vector do not involve seed points; however, the efficiency issue arises. With the increase in the number of attributes that are utilized in the clustering procedure, the amount of memory required increases tremendously. In terms of the manipulation of LIDAR data, the proposed methodology considers both the similarity and the connectivity of LIDAR points and reduces the dimension of the attribute space, while circumventing the limitations of existing segmentation techniques. The following section describes the proposed technique for LIDAR point segmentation with an efficient attribute space and the resolution of ambiguity from co-planarity. This discussion is followed by an explanation of boundary regularization, which makes the results as close to the real boundary as possible. Afterwards, experimental results with real data are presented to verify the feasibility and performance of the suggested methodology. Finally, conclusions and recommendations for future work are summarized.
LIDAR POINT SEGMENTATION In general, the objective of LIDAR point segmentation techniques is to abstract the huge number of points in a typical LIDAR survey and to relate the points to physical objects. The proposed methodology begins with the definition of the neighborhood of a point. Neighboring points are identified according to the connectivity of points within the neighborhood. A set of attributes for each point are then computed using its neighboring points. Finally, clustering is implemented based on the similarity of the computed attributes of the points. In other words, points that have ASPRS 2007 Annual Conference Tampa, Florida May 7-11, 2007
homogeneous attributes are separated from the remaining points and are represented as a distinct group, while considering the connectivity of the points in the object space. This research mainly focuses on the segmentation of man-made structures, which has been identified as the most difficult problem in photogrammetric research. As man-made structures mostly consist of planar patches, they are our target for segmentation in this paper. The proposed methodology for planar patch segmentation will be explained in detail, following four main steps: 1) Neighborhood definition, 2) Attribute derivation, 3) Clustering of neighboring points with similar attributes, and 4) Boundary regularization.
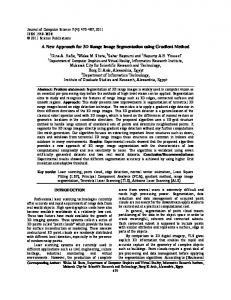
Neighborhood Definition Neighborhood definition is the starting point for planar patch segmentation. The way in which the neighborhood of a LIDAR point is defined significantly affects the set of attributes computed for the point. Three different types of neighborhood definitions will be introduced and reviewed. One way in which the neighborhood of a point can be defined is by considering its proximity to other points that are projected onto the XY plane. The use of Triangular Irregular Networks (TIN) is the well known technique based on this neighborhood definition. It has been used mainly for analyzing random 3D points. However, serious drawbacks are revealed when points are located close to one another on the XY plane but do not belong to the same physical shape. Fig. 1(a) shows an example of neighborhood definition using TIN methodology; points on the wall are falsely considered to be neighbors of points on the roof, and a similar problem occurs with the points that are scanned from the tree. Another type of neighborhood definition that can be used establishes proximity according to the Euclidian distance between points in 3D space. The spherical method is based upon this definition. The points that are located inside a sphere of a certain radius centered at the point in question are considered to be in its neighborhood; see Fig. 1(b). Even though we are considering three dimensional relationships between random points, the neighborhood definition criterion does not take into account the physical shapes of objects. This spherical definition has similar drawbacks to those of the triangulation approach because points belonging to different patches are often included in the same neighborhood. To avoid the problems that occur with the above two types of neighborhood definitions, a different definition which considers both the three-dimensional relationships between random points and the physical shapes of surfaces is introduced and employed in this research (Filin and Pfeifer, 2006). The physical shapes of the surfaces on which associated points are located are incorporated into the neighborhood definition. This means that points located on the same surface are considered to be possible neighbors, while taking into account the proximity of the points. Points on different surfaces, on the other hand, are not considered to be neighbors, even if they are spatially close. This definition increases the homogeneity among neighbors. The schematic concept of the adaptive cylinder method, which follows this definition, is illustrated in Fig. 1(c). Neighbors are determined using a cylinder whose axis direction changes according to the physical shape of the object in question. It is for this reason that this neighborhood definition is referred to as the adaptive cylindrical neighborhood definition. As shown in Fig. 1(c), points on the wall are not considered to be neighbors of the points on the roof. This neighborhood definition method will be implemented as follows. 1) Define neighborhood by spherical approach. 2) Compute a plane using the neighboring points determined in step 1. 3) Calculate distances between the plane from step 2 and associated points belonging to the neighborhood from step 1. 4) Construct a weight matrix using the inverse values of the distances from step 3. 5) Compute a plane using the weight matrix from step 4 and the neighborhood defined in step 1. 6) Repeat step 3 to 5 until the computed plane parameters do not change compared to the previous iteration. 7) Stop the iteration and determine the final neighborhood after discarding points whose distances are higher than half of the cylinder height.
ASPRS 2007 Annual Conference Tampa, Florida May 7-11, 2007
(a)
(b)
(c) Figure 1. Different neighborhood definition methods (side view): TIN (a), spherical (b), and adaptive cylinder (c).
Attribute Derivation In this research, planar patch attributes are computed based on the neighboring points identified using the adaptive cylinder method. After introducing an origin, a plane is defined for each point using its neighboring points. As illustrated in Fig. 2, a normal vector from the origin to the plane is defined and the three components ( n x , n y , n z ) of the vector for each point are derived. neighborhood a certain point in question
n = (n x , n y , n z ) computed plane origin
Figure 2. Vector defined from the origin to the computed plane for a given point, using its neighboring points. Before describing the planar patch attributes utilized in this research, various techniques that are based on the approach that uses the attribute space must be mentioned. Their computational efficiency and their ambiguity of segmentation, which leads to the grouping of separate patches as one, must also be considered. All techniques of this type use a voting scheme with an accumulator array that is constructed in the attribute space. The dimension of the accumulator array depends on the attributes utilized in the technique in question. As mentioned earlier, our target objects are planar patches, of which the majority of man-made structures consist. Only the selected points belonging to planar patches are utilized for segmentation, regardless of the methodology employed. The three components of the normal vector ( n x , n y , n z ) can be used as attributes in the voting scheme. One should note that one normal vector defines only one infinite plane uniquely; therefore, planes sharing the same normal vector but disconnected in the object space will be clustered into one group. None of the techniques that are based on segmentation in the attribute space can avoid this problem, which is known as segmentation ambiguity from co-planarity. The segmentation technique that uses the three components of the normal vector partitions points into distinct regions without any segmentation ambiguity except for that arising from co-planarity. However, the use of these attributes requires the construction of an accumulator array that has three dimensions, one for each vector component. A ASPRS 2007 Annual Conference Tampa, Florida May 7-11, 2007
voting scheme that uses a three-dimensional accumulator array is computationally expensive and complicated. To reduce the three-dimensional accumulator array to two dimensions, the slopes of the normal vector in the x and y directions are used instead of the three normal vector components as attributes for the planar patch segmentation (Elaksher and Bethel, 2002, Filin and Pfeifer, 2006). Even though this method reduces the dimension of the accumulator array, the ambiguity of segmentation is a problem. If this method is used, parallel planes that have the same normal vector slopes in the x and y directions but different offsets in the z direction will be segmented as one group. This problem can be resolved through either spatial analysis of the data or the introduction of a one-dimensional accumulator array for the offsets in the z direction, after the segmentation in the two-dimensional attribute space is completed. In this research, the magnitude of the normal vector is utilized as an attribute. As explained earlier, the normal v ector is defined from the origin and the plane. The number of origins determines the dimension of the accumulator a rray. If we have one origin for planar patch attribute computation, only a one-dimensional accumulator array is nece ssary. However, different planes with the same attribute values may exist. The tangent planes to a sphere centered o n the origin could be an example. In this case, it is difficult to separate the patches in the attribute space. Therefore, t wo origins are introduced in this research; this significantly reduces the ambiguity of segmentation, namely the poss ibility that the different planes might be clustered into one group. In addition, only a two-dimensional accumulator a rray is necessary for the voting scheme. Fig. 3 illustrates the schematic concept of the introduction of two origins. If one origin (origin 1) is located at the equal distance from the planes by chance, all of these points will be accumulat ed at the same position in the accumulator array. Therefore, it would be impossible to separate these points into diff erent groups in the attribute space. This problem can be resolved by introducing another origin (origin 2). As Fig. 3( a) shows, the magnitudes of the normal vectors from the points to the second origin will be different from one anoth er. Thus, points that have the problem of ambiguity of segmentation when associated with one origin are separated i nto three different groups after introducing the second origin; see Fig. 3(b). The advantages of the introduction of t wo origins while utilizing the magnitudes of the normal vectors of the points can be summarized as two points: 1) th e computational efficiency is increased in terms of the dimension of the utilized accumulator array, and 2) it is easy t o determine the size of quantization in the accumulator array because the magnitudes of the normal vectors are equa l to the distances between planes and origins; the normal vector slopes in the existing methods cannot accomplish this. n22
n21
origin 1
origin 2 n13
n21
origin 2
n11 = n12 = n13
n23
n12
n22
origin 1
n11
n23
(a)
(b)
Figure 3. Introduction of two origins (a), and a 2D accumulator array for the segmentation (b). The two origins should be located at positions that minimize the risk of ambiguity. Fig. 4(a) shows an example of the ambiguity that causes the attribute vectors of different planes to be located at the same position in the accumulator array. The position of plane 1 in the attribute space is (r1, r2); r1 and r2 are the magnitudes of the normal vectors to plane 1 from the two origins. Unfortunately, the other three planes share the same location in the attribute space. Although the likelihood of this ambiguity occurring in reality is very low, we cannot ignore the possibility. Therefore, this research suggests that the two origins be located such that the angle between the line connecting the two origins and the horizontal plane is 45 degrees; see Fig. 4(b). This suggestion is based on the assumption that the slopes of building roofs are less than 45 degrees because most of them are flat or only gently slanted. According to this assumption, planes 1 and 3 are almost nonexistent in reality because their slopes are greater than 45 degrees. Further processing methodology takes care of the ambiguity between planes 2 and 4 in the next section 2.3. By positioning the two origins in this manner, the possibility of ambiguity due to the locations of the origins is extremely low or almost nonexistent because the planar patches involved must be located in exactly the same position to create ambiguity in the accumulator array. ASPRS 2007 Annual Conference Tampa, Florida May 7-11, 2007
plane4 r2
plane3 origin1
r1
origin2 plane2 plane1
(a)
(b)
Figure 4. Ambiguity from two origins (side view) (a), and the positioning of two origins that minimizes the possibility of ambiguity (side view) (b).
Clustering of Neighboring Points with Similar Attributes Once the locations of two origins are determined, the attributes for all the points in the dataset are computed and registered in the accumulator array. The points belonging to different planes in the object space form different accumulated peaks in the attribute space. Fig. 5 shows an example of patch segmentation. A LIDAR dataset over a region that includes a building with two planar patches is selected; see Fig. 5(a) and 5(b). The points that belong to the patches produce two high peaks in the accumulator array through the voting scheme; see Fig. 5(c). Once the peaks are constructed from different planar patches, points with similar attributes are aggregated; the highest peak is determined and the co-planarity of neighboring points around the peak is checked. The highest peak is detected after determining the plane fitting accuracy and number of points located at the peak. Then, the cluster number is assigned to each of the points at the peak. In the next step, the cluster is extended to the neighboring points around the peak to take into consideration the inaccuracy of the computed attributes of certain points, which are generally either located around break lines or affected by noise. This procedure is implemented while checking the co-planarity between the computed plane (using the points located at the peak) and the points surrounding the peak until there are no more points which satisfy the co-planarity condition. Once this cluster growing has been completed, the aggregated points around the highest peak are recorded and removed from the accumulator array. Now, the new highest peak can be detected as the second highest peak in the entire dataset, and steps implemented for the first highest peak are repeated. This process is repeated until the number of points located at the peak is less than the number of points that have been pre-determined to make up the minimum detectable patch size in the object space. Fig. 5(d) shows the clustered points categorized into two different groups using the above technique.
ASPRS 2007 Annual Conference Tampa, Florida May 7-11, 2007
(a)
(b)
(c)
(d)
Figure 5. Aggregation of points with similar attributes: the digital image (a), the Digital Surface Models over the area of interest (b), the accumulator array (c), and the segmented patches (d). As mentioned previously, none of the segmentation techniques that are based on the attribute space can distinguish between planes that share the same attributes but are disconnected in the object space. Because of this, the separation of these planes is achieved by conducting a neighborhood analysis through boundary detection of the clustered points in the object space. The modified convex hull approach (Jarvis, 1977) is adopted to determine the shape of a set of points. Fig. 6(a) and (b) show the points extracted from the previous steps in the proposed segmentation methodology and the detected boundary of these points, respectively.
(a)
(b)
Figure 6. Boundary detection: clustered points from attribute space (a), and detected boundary (b). This boundary detection procedure is modified and extended to deal with points from different patches, which are coplanar but spatially separated in the object space. Fig. 7(a) shows an example of these types of points, before applying the boundary detection algorithm. As can be seen in the figure, there are two large sets of points and a few spurious ASPRS 2007 Annual Conference Tampa, Florida May 7-11, 2007
points. First, the boundary for the large set of points located at bottom of the figure is detected. All the points located inside the boundary are recognized and classified as one cluster. Once all these points have been recorded and removed from the entire dataset, the same procedure is conducted for the remaining points, in an iterative process; see Fig. 7(b). To summarize, the proposed segmentation technique successfully identifies the LIDAR points located on the same physical plane while considering the similarity of their attributes and spatial relationship.
(a)
(b)
Figure 7. Neighborhood analysis via boundary detection: multiple coplanar patches detected from the attribute space (a), and patches separated through boundary detection (b).
Boundary Regularization The derived boundaries do not represent the actual boundaries of the physical objects being segmented. In other words, these are the boundaries as determined by the LIDAR footprints, and their deviation from the actual physical boundaries depends on the average point density of the LIDAR data. Therefore, boundary regularization is necessary in order for the final boundaries of the planar patches to be as close to those of the real object as possible. As a first step, Douglas-Peucker algorithm is adopted to simplify the detected boundary; this is done after each line segment in the boundary for a certain patch is divided into smaller line segments, to reduce the effects of the large LIDAR point density. The simplified polylines by Douglas-Peucker method consist of the end points that contain the key characteristics of the original boundaries. The forms of the simplified boundaries are strongly dependent on these end points. Therefore, all the information provided by all the points on the original boundary must be utilized to acquire the final boundaries to be as close to those of the real object as possible. The original boundary points located between two end points are used to compute a fitted line using a least squares adjustment. Then, the acquired line is intersected with another adjacent one; this provides more accurate information for the corner points of the patches. Fig. 8 (a) and (b) show the original boundary detected using the LIDAR points and the final results of the intersection of the fitted lines, respectively.
(a)
(b)
Figure 8. Boundary regularization: a boundary detected from segmented LIDAR points (a), and the regularized boundary after applying the Douglas-Peucker algorithm and a least squares adjustment (b). ASPRS 2007 Annual Conference Tampa, Florida May 7-11, 2007
EXPERIMENTAL RESULTS To verify the performance of the methodology developed for planar patch segmentation, an experiment using real data has been conducted. The real data consists of a set of digital images and LIDAR points scanned over an area in Brazil. The brief descriptions of the systems and data specifications are as follows. Kodak 14N digital images that have 4500 by 3000 image size and 0.008 mm pixel size were provided at the average flying height of 1300m. The LIDAR dataset was captured using an OPTECH ALTM 2050 laser scanner with an average flying height of 975m and mean point density of 2.24 points/m2 (~0.67m point spacing). Fig. 9 illustrates the digital image (a) and the DSM (b) over the area of interest. The two buildings enclosed by dashed circles are focused on in this experiment.
(a)
(b)
Figure 9. Digital image (a) and LIDAR DSM (b) over the area of interest in Brazil. Once the boundaries of two building are detected through the implementation of the proposed methodology, they are projected onto the digital image to visually verify the results. The boundaries detected from the segmentation results and the improved boundaries detected using the Douglas-Peucker algorithm and a least squares adjustment are projected onto the digital image and are shown in Fig. 10 (a) and (b), respectively.
(a)
(b)
Figure 10. The boundaries detected from the segmentation results (a), and the improved boundaries after regularization . For a detailed comparison of the detected boundary results displayed in Fig. 10, closer views of them are shown in Fig. 11. Due to the random distribution of LIDAR points, boundaries detected from the segmented results are irregular ASPRS 2007 Annual Conference Tampa, Florida May 7-11, 2007
and do not represent actual building shapes, as shown in Fig. 11 (a) and (c). However, the regularization procedures implemented provide improved results which are closer to the actual building shapes, as shown in Fig. 11 (b) and (d).
(a)
(b)
(c)
(d)
Figure 11. The detected boundaries of the buildings before regularization (a) and (c), and the detected boundaries of the buildings after regularization (b) and (d).
CONCLUSIONS AND RECOMENDATIONS Various LIDAR point segmentation approaches have been suggested since the importance of LIDAR measurements was recognized. However, previously addressed techniques suffer from limitations such as sensitivity to the choice of seed points, lack of consideration of the spatial relationships among points, and inefficient performance. The newly proposed approach in this research provides mostly five benefits while circumventing the addressed limitations of the existing techniques. 1) Neighborhood definition which considers both the three-dimensional relationships between random points and the physical shapes of surfaces is introduced and employed; this definition increases the homogeneity among neighbors. 2) A voting scheme with a 2D accumulator array is introduce to aggregate points with similar attributes into clusters; the computational efficiency is increased in terms of the dimension of the utilized accumulator array. 3) The clustering procedure is implemented while checking the co-planarity between the computed plane (using the points located at the peak) and the points surrounding the peak until there are no more points which satisfy the co-planarity condition; this procedure makes the proposed technology more rigorous while taking into consideration the inaccuracy of the computed attributes of certain points, which are generally either located around break lines or affected by noise. 4) The ambiguity from the co-planarity is resolved by the boundary detection procedure. In other words, the procedure is ASPRS 2007 Annual Conference Tampa, Florida May 7-11, 2007
modified and extended to deal with points from different patches, which are coplanar but spatially separated in the object space; therefore, the resolution of the ambiguity from the co-planarity and boundary detection are implemented simultaneously. 5) The boundary regularization provides the final boundaries of planar patches as close to the real object as possible by applying the Douglas-Peucker algorithm, and the line fitting and intersection procedure. Experimental results with real data have demonstrated the reliability of the outcomes through visual verification. Conclusively, this research proposes a rigorous and efficient methodology to abstract the huge number of LIDAR points into simplified boundary and plane information. Future research will focus on analysis of the spatial relationships among segmented planar patches. This analysis will lead to more accurate detection of physical shapes through intersection of adjacent patches. Moreover, the boundaries of the planar patches must be improved using synergetic properties of LIDAR and imaging systems. Based on the accurate boundaries, Digital Building Models, which improve the quality of Digital Surface Models, will be generated. Finally, digital images and the improved Digital Surface Models will be combined to produce realistic 3D perspective views of the mapped areas.
ACKNOWLEDGEMENT We would like to thank the GEOIDE (GEOmatics for Informed DEcisions) Network of Centers of Excellence of Canada for their financial support of this research (SII#43). The authors are also indebted to the Technology Institute for Development – LACTEC – UFPR, Brazil and Terrapoint Canada for providing the LIDAR/image data and the valuable feedback.
REFERENCES Axelsson, P., 1999. Processing of laser scanner data – algorithms and applications. ISPRS Journal of Photogrammetry and Remote Sensing, 54(2-3): 138-147. Besl, P.J. and Jain, R.C. (1998). Segmentation Through Variable Order Surface Fitting. IEEE Transactions on Pattern Analysis and Machine Intelligence, 10(2):167-192 Elaksher, A. and Bethel, J., 2002. Reconstructing 3D buildings from LIDAR data, ISPRS commission III, Symposium 2002, 9-13, September, Graz, Austria. Filin, S., 2002. Surface clustering from airborne laser scanning data. In: ISPRS Commission III, Symposium 2002 September 9 - 13, 2002, Graz, Austria, pp. A–119 ff (6 pages). Filin, S., Pfeifer, N., 2006. Segmentation of airborne laser scanning data using a slope adaptive neighborhood. In: IS PRS Journal of Photogrammetry & Remote Sensing, 60, pp. 71–80. Hoover, A., Jean-Baptiste, G., Jiang, X., Flynn, P.J., Bunke, H., Goldgof, D.B., Bowyer, K., Eggert, D.W., Fitzgibb on, A., Fisher, R.B., 1996. An Experimental Comparison of Range Image Segmentation Algorithms. IEEE Transactions on Pattern Analysis and Machine Intelligence 18 (7): 673-689. Hough, P.V.C., 1962. Method and means for recognizing complex patterns. U. S. Patent 3,069,654. Jarvis, R. A., 1977. Computing the shape hull of points in the plane, Proceedings of IEEE Computer Society Confer ence Pattern Recognition and Image Process, pp.231-261 Jiang, X. and Bunke, H., Robust edge detection in range images based on scan line approximation. Technical Report IAM-96-016, University of Bern, 1996. Lee, I., Schenk, T. 2001 “Autonomous extraction of planar surfaces from airborne laserscanning data” Proc. ASPRS annual conference, St. Louis, MO, USA. Maas, H.G., 1999. The potential of height texture measures for the segmentation of airborne laserscanner data. In: P roceedings of the Fourth International Airborne Remote Sensing Conference, Ottawa, Canada. pp. 154- 161. Sithole, G., Vosselman, G., 2003. Automatic Structure Detection in a Point Cloud of an Urban Landscape. In: Proce edings 2nd GRSS/ISPRS Joint Workshop on RemoteSensing and Data Fusion over Urban Areas, URBAN 2003, Berlin, Germany, pp. 67-71. Vosselman, G., Dijkman, S. 2001: 3D building model reconstruction from point clouds and ground plans. International Archives of Photogrammetry and Remote Sensing, Vol. 34, Part 3-W4, pp. 37-43 Vosselman, G., Gorte, B.G.H., Sithole, G., Rabbani, T. (2004). Recognising structure in laser scanner point clouds. IAPRS, vol. 36, part 8/W2, pp. 33-38. ASPRS 2007 Annual Conference Tampa, Florida May 7-11, 2007