Home
Search
Collections
Journals
About
Contact us
My IOPscience
New Methodology for Determining of the Ecological Flow with Hydrometric Data
This content has been downloaded from IOPscience. Please scroll down to see the full text. 2016 IOP Conf. Ser.: Earth Environ. Sci. 44 022030 (http://iopscience.iop.org/1755-1315/44/2/022030) View the table of contents for this issue, or go to the journal homepage for more Download details: IP Address: 192.188.58.16 This content was downloaded on 15/12/2016 at 17:38 Please note that terms and conditions apply.
You may also be interested in: Optical Proximity Correction Methodology to Counteract Mask Error Effects in Sub-0.25 µm Lithography Generations Keeho Kim, John Lilygren and Sriram Madhavan Unit-sizing of hydro power plant P Maruzewski, C Rogeaux and P Laurier Strong and nonlinear effects of fragmentation on ecosystem service provision at multiple scales Matthew G E Mitchell, Elena M Bennett and Andrew Gonzalez New methodology developed for the differential scanning calorimetry analysis of polymeric matrixes incorporating phase change materials Camila Barreneche, Aran Solé, Laia Miró et al. The mean-square exponential stability and instability of stochastic nonholonomic systems Shang Mei and Guo Yong-xin Thermal fluctuations in perpendicular recording media: New methodology for estimation of activation moment H Mamiya, H Hagiya, Y Oba et al. A methodology for coupling an atomic model with a continuum model using an extendedLagrange function Guehee Kim and Yasuhiro Senda A New Method for the Analysis of Relative Permeability in PorousMedia Xu You-Sheng and Wu Feng-Min
World Multidisciplinary Earth Sciences Symposium (WMESS 2016) IOP Conf. Series: Earth and Environmental Science 44 (2016) 022030
IOP Publishing doi:10.1088/1755-1315/44/2/022030
New Methodology for Determining of the Ecological Flow with Hydrometric Data Washington Sandoval-Erazo 1, David Carrera-Villacrés 1, Marco MasabandaCaisaguano 1, Evelyn Arce 1 1
Universidad de las Fuerzas Armadas-ESPE, Departamento de Ciencias de la Tierra y la Construcción, Grupo de Investigación en Contaminación Ambiental(GICA). Av. Gral. Rumiñahui S/N, Sangolquí, Ecuador E-mail address:
[email protected]
Abstract. Although there are several methods to calculate the ecological flow, however, in Ecuador did not develop yet a technique that suits the reality of the water systems. Therefore, we proposed a new methodology to determine the ecological flow through of hydrometric data such as minimum flows, average flow and monthly peak flows in a specific basin. The values obtained with the applied methodology are unique for the studied basin and do not correspond to percentage flow. This is fundamental since engineers use a variety of methods and need to choose at its discretion the best fitting one.
1. Introduction Santa Cruz [1] defines as ecological flow like the flow regime in a body of water that keeps the functioning of the aquatic ecosystem in natural conditions, which is understood that shall be this the minimum amount of water needed to maintain the flora, fauna, environmental, and adaptability capacity by the effect climatological and hydrological extremes. According to the Mexican Standard [2] the ecological flow is the quantity, quality and variation in spending or water levels reserved to preserve environmental conditions, components, functions, processes and resilience of ecosystems being dependent of aquatic and terrestrial hydrological, geomorphological, ecological and social processes. There are several definitions of ecological flow, which consider multiple parameters such as Mexican Standard. Therefore, it seems a complex issue to establish a unique method for calculating ecological flows in the watershed. Additionally, it is necessary to apply several methods corresponding to the complexity of every basin. However, it is considered that each watershed establishes the biotic and abiotic conditions related to the availability of water resulting from water cycles set by nature, i.e., the set values of ecological flow for a basin are not necessarily applicable to another. Therefore, the ecological flow is not a constant percentage of the average flow. 2. Existing methods to calculate the ecological flow There are variety methods able to calculate the ecological flow. In this study we limited such application the hydrometric method. 2.1. Hydrometric method The hydraulic method proposed by Tennant [3] also called Montana method explains that the minimum ecological flow may obtain equal to 10% of the average flow (FA), as this value guarantee for the most Content from this work may be used under the terms of the Creative Commons Attribution 3.0 licence. Any further distribution of this work must maintain attribution to the author(s) and the title of the work, journal citation and DOI. Published under licence by IOP Publishing Ltd 1
World Multidisciplinary Earth Sciences Symposium (WMESS 2016) IOP Conf. Series: Earth and Environmental Science 44 (2016) 022030
IOP Publishing doi:10.1088/1755-1315/44/2/022030
basins analysed 60% of the hydraulic parameters of the basin of the studied area, wetted perimeter and water depth.
FE 0 .10 FA
(1)
According to Alcazar [4] the ecological flow consists of a base flow (FB) plus a conditioning flow (FC), which summed up provides the ecological flow (FE), FE = FB + FC = FM (maintenance flow). Similarly, it includes the concept of generator flow FG, which is large enough to fully occupy the section of the river preserving the conditions of flora, fauna, as well as hydraulic and morphometric in the basin. The base flow (FB) in the most studied rivers is set as 20% of the average flow, [4].
FB 0.20 FA
(2)
The conditioning flow can reach up to 56%, however, it may be usually of 10% in average.
FC 0 .10 F A
(3)
From where
FM 0 .30 FA
(4)
Standard No. 314 (2007) of the Ministry of Natural Resources of the Russian Federation explains that if information is hydrometric, sanitary flow (ecological flow) is taken as on the average flow for the period of minimum runoff, according to the following relationships: FE 1 0 .70 F50 %
(5)
FE 2 0 .80 F75 %
(6)
FE 3 0 .90 F95 %
(7)
FE1 is flow recommended to maintain conditions fulfilling the usual conditions of the river. FE2 is a flow, which ensures basic living conditions in the river. FE3 is the minimum required for survival for a period of extreme drought conditions. F50, FE1, FE1 are the corresponding percentages indicated as flow rates of the flow duration curve. Mexican Standard [2] determines the environmental objective from the ecological importance and pressure of water uses, being calculated as a percentage of the allocated volume and concession regarding the annual average availability. With the environmental objective, environmental flows are defined from 5% to 40% for perennial streams. Garcia and Paz [5] cited as Swiss method to ecological flow calculated with the following formula that does not apply to small flows.
FE 15
F95 % (ln F95 % ) 2
(8)
The principality of Asturias, also according to [5] recommends determine the flow as follows. FE 0 .25 ( F95 % 0 .075 )
(9)
Sandoval and Aguilera [6] with regard to basins in Ecuador, suggest without hydrometric data to calculate the ecological flow in relation to precipitation P (mm) and the basin area A (km2) to the following relationship: F E (1 to 2 .5)( P A 10 6 )
2
(10)
World Multidisciplinary Earth Sciences Symposium (WMESS 2016) IOP Conf. Series: Earth and Environmental Science 44 (2016) 022030
IOP Publishing doi:10.1088/1755-1315/44/2/022030
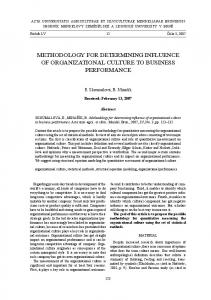
2.2. Method Proposed Runoff from a runway, together with other hydrological, geographical, geological and topographical conditions, are part of the plant and animal life as well s of the ecological corridor. Hydrometric data from a basin express the natural variation of the flow in a controlled section and these relate to the demand for water flora and fauna. The monthly average flows characterize the contributions of water ecological corridor during the time and the monthly change may ascend or descend. According Bagapova [7] and [8] the ecological flow corresponds to the minimum critical water demand in periods in which the flow is less than a certain value and that may be determined from the hydrograph average monthly flows during several yeas. In this study we propose to determine the flow through of the integral mass curve, the data to form an integral mass curve has been ordinated from major to minor. The flows F1, F2, … F12 are monthly average flows and FA is the average flow of every year. The flows were here by ordered from higher to lower. A curve has been determined and normalized with data flow obtained the series. In the same same series the variation with respect to the mean value has been calculated according to following expression.
Fi FA F i 1 ki 1 FA FA The integral mass curve in the function The differential is dy ( k i 1) dk
(k
i
(11)
1)
dy s ki 1 dk The slope is determined in graphical form taken out of the integral equation. With the known slope known is feasible to determine the value of ki. The gradient of the mass flow is given by (s)
ki s 1
Fi FA
(12)
In the last equation Fi appears the value that requires the basin to overcome the negative gradient flow of the data series, which may be called ecological flow FE.
FE FA (1 s )
Figure 1. Integral mass curve
3
(13)
World Multidisciplinary Earth Sciences Symposium (WMESS 2016) IOP Conf. Series: Earth and Environmental Science 44 (2016) 022030
IOP Publishing doi:10.1088/1755-1315/44/2/022030
The procedure described above has been applied to the Toachi Pilaton AJ basin with hydrometric information available on the website of the National Institute of Meteorology and Hydrology of Ecuador (INAMHI, [9]) (Table 1), of which data correspond to the years 1964 to 2010. The data are sorted from largest to smallest in order to develop the mass integral curve. This has been calculated for three series (Table 2). The results were plotted as shown Figure 1 where the slope of the curves in its descent stage has been determined using a typical calculations software. Table 2 lists the values calculated with the equation of the slope on the descent stage as indicated, while the slope values determine the reduction coefficients ki flow and ecological flow for each column. Table 1. Average flow, minimum flow and maximum flow [m3/s]
Month January February March April May June July August September October November December
Average flow 46.702 71.575 74.921 81.064 57.501 36.485 24.426 18.98 18.666 22.132 24.226 29.927
Minimum flow 16.483 15.118 16.728 18.593 15.439 14.831 14.059 12.809 10.507 11.197 10.394 11.294
Maximum flow 110.807 150.319 137.371 267.792 103.852 60.909 35.093 28.543 28.733 42.034 82.314 104.761
Table 2. Processing for mass curves S (ki - 1) Month
Average Flow
Minimum Flow
Maximum Flow
APR FEB MAR ENE DEC MAY NOV JUN OCT JUL SEP
0.92017055 1.69483128 2.390235 2.75226656 2.8585012 2.72272481 2.43160845 2.0101894 1.58403293 1.10827568 0.55785671
0.33241765 0.53118506 0.71239519 0.81878986 0.90218092 0.9650049 0.97250555 0.8904283 0.69978262 0.5021857 0.25514177
1.78822206 2.35332764 2.78362001 2.93733081 3.02809129 3.10938736 2.96643205 2.60061014 2.03826371 1.40364833 0.70281329
AUG
-9.992E-16
5.5511E-16
1.9984E-15
m ki
-0.5047 0.4953
-0.2346 0.7654
-0.6537 0.3463
Ecological Flow
20.91
10.68
33.26
4
World Multidisciplinary Earth Sciences Symposium (WMESS 2016) IOP Conf. Series: Earth and Environmental Science 44 (2016) 022030
IOP Publishing doi:10.1088/1755-1315/44/2/022030
With the help of the Excel functions slope is calculated in its descent stage (Figure 2).
Figure 2. Determination of descent gradient
It is necessary to compare this method with others though the flow duration curves (Figure 3).
F vs p%
Flow [m3/s]
160 140 120 100 80 60 40 20 0 0
10
20
30
40
50
60
70
80
90
100
p %
Figure 3. Flow duration curve
The annual average flow in the Toachi Pilaton AJ basin is 42.22 m3/s (Table 1) and the flow duration curve was obtained the following values: F50%= 30.99 m3/s; F75%= 18.90 m3/s y F95%= 13.29 m3/s. The ecological flows were calculated with different methodologies and are presented in Table 3. Table 3. Comparison of results with other methodologies 3
EF (m /s)
Asturias
Chile
Ecuador España
Ecological flow minimum Ecological flow average
3.34
8.44
4.22
México
Rusia
8.44
2.11
11.96
12.66
16.89
15.12
Ecological flow maximum
23.24
5
Suiza
Own 10.68
29.79
20.91
33.26
World Multidisciplinary Earth Sciences Symposium (WMESS 2016) IOP Conf. Series: Earth and Environmental Science 44 (2016) 022030
IOP Publishing doi:10.1088/1755-1315/44/2/022030
3. Results and Discussions The proposed methodology is based on hydrometric data and fits the conditions of water behaviour of the studied basin and may be compared with other existing methodologies lesser or greater complexity. The calculated flow rate with the number of monthly minimum flows should be considered as the minimum acceptable for the ecosystem of the river (dry season). The calculated data series of average flow corresponds to excellent conditions for the ecosystem while the maximum flow corresponds to optimal conditions for regeneration of the high areas of the river. The results of the calculated ecological flow with this methodology should not be necessarily transferred to other basins, as such conditions need to handed individually for each basin. 4. Conclusions The proposed methodology has been based on hydrometric data and may be used to determine the discharge of ecological flow in any basin. In either case the river flow, in dry seasons, should be less than obtained from the monthly minimum flow. References [1] Santacruz, G., 2010. Variación cronoespacial de los caudales ecológicos en la cuenca del Río Valles, México. Aqua LAC. México. Vol 2- N° 1, pp. 26-36. [2] Mexican Standard NMX-AA-159-SCFI-2012 que establece el procedimiento para la determinación del caudal ecológico en cuencas hidrológicas. México, p. 2 [3] Tennant, D., 1976. Instream Flow Regimes for Fish. Wildlife, Recreation and Related Environmental Resources. In: Fisheries, 1, pp. 6-10 [4] Alcazar, J., 2007. El método del caudal básico para la determinación de caudales de mantenimiento. Aplicación a la cuenca del Ebro. Tesis Doctoral. Universidad de Lleida, Escuela Técnica Superior de Ingeniería Agraria. Lleida, España [5] García, E. y Páz, G., 1997. Estimación de las necesidades hídricas para la conservación de la ecología fluvial de los ríos regulados. Federación Mexicana de Ingeniería Sanitaria y Ciencias Ambientales. México. pp. 1-8 [6] Sandoval, W. y Aguilera, E., 2014. Determinación de caudales en cuencas con poca información. Ciencia UNAMI. Milagro, Ecuador. Vol 7, N° 2, pp. 100-110 [7] Bagapova, A., 2010. Влияние водного фактора на экосистему пойм рек и разработка методики расчета экологических попусков. Abstract Doctoral Thesis. Institute of Investigation of Water Uses. Almaty, Kazajistán. pp. 25 [8] Fuel and Energy Ministry of the Russian Federation. 2007. Mетодические указания по составлению правил использования водных ресурсов водохранилищ гидроузлов электростанций. Guidance on drawing up rules for the use of water reservoirs of hydro power plants, Moscow, Rusia [9] INAMHI, http://www.serviciometeorologico.gob.ec/caudales-datos-historicos/, online: 05/2016
6