Event-related potentials (ERPs) are physiological responses in the EEG which
are ... Institutes of Health you can search for an overview of published studies that
...
Mind Media BV, NeXus White Paper series: ERP/EP
2009-04 V0.92 (www.mindmedia.nl)
NeXus: Event-Related potentials Evoked potentials for Psychophysiology & Neuroscience
This NeXus white paper has been created to educate and inform the reader about the Event Related Potentials (ERP) and Evoked Potential (EP) functionality offered by the NeXus Instruments with the BioTrace+ software version 2009a and later. The NeXus-10, NeXus-16 and NeXus-32 members of the NeXus family of physiological monitoring and feedback instruments are multi-modal systems that support a wide range of sensors and applications, including ERP/EP and Biofeedback/Neurofeedback functions. BioTrace+ runs on Windows (XP/Vista ™) based PC’s. The NeXus family of products has medical class IIa certification (EU) and is FDA (US) registered. Exclusive world wide distribution by Mind Media BV: #1 in Europe for multi-modal, multi-channel physiological monitoring & feedback.
The picture above shows a BioTrace+ VEP screen design on a PC with dual monitors and the wireless NeXus-10. This is a 10 channel physiological monitoring and feedback platform that includes a trigger input, for high precision event/stimulus synchronization.
Please note: since the NeXus-4 does NOT have a trigger input, it can not be used for ERP or EP applications. NeXus-10, 16 and 32 all have trigger inputs and support EP/ERP.
Page 1 of 22
Mind Media BV, NeXus White Paper series: ERP/EP
2009-04 V0.92 (www.mindmedia.nl)
~ Table of contents ~ What are Event-related Potentials? ...............................................................3 ERP Applications for research .......................................................................4 ERP: Electrode locations ...............................................................................5 ERP: EEG settings for data acquisition .........................................................6 ERP: Design of P300 experiments ................................................................6 What are Evoked Potentials? .........................................................................7 VEP: the visual evoked potential ...................................................................7 VEP Applications for research .......................................................................7 VEP: Electrode locations................................................................................8 VEP: EEG settings for data acquisition..........................................................8 Other evoked potentials: BAEP and SEP ......................................................8 NeXus: solving the problem of EEG & event synchronization .......................9 NeXus: the digital trigger input .................................................................... 10 BioTrace+ for NeXus: event presentation modes ....................................... 11 The NeXus Trigger Interface ....................................................................... 12 BioTrace+: the event presentation builder .................................................. 13 Example1: an example for a P300 experiment ........................................... 13 Example2: an example for a VEP experiment ............................................ 15 BioTrace+: the event presentation editor .................................................... 16 BioTrace+: running an ERP/EP presentation ............................................. 17 BioTrace+: ERP/EP Averaged Response Analysis .................................... 18 An example of a 21 channel ERP with NeXus-32: ..................................... 20 BioTrace+: ERP/EP Data Export ................................................................ 21 Short list of recommended literature: .......................................................... 22
Page 2 of 22
Mind Media BV, NeXus White Paper series: ERP/EP
2009-04 V0.92 (www.mindmedia.nl)
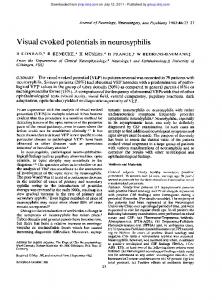
What are Event-related Potentials? Event-related potentials (ERPs) are physiological responses in the EEG which are time locked to an ‘event’ (also called stimulus) which is frequently presented (typically 50-500 times) to a human subject and which requires some form of response and/or cognitive processing. By studying ERP’s we can observe how the human brain processes information. The events or stimuli are usually presented in an audio or visual form and involve a task such as recognizing a (rare) target stimulus within many (frequent) non-target stimuli. Each time the subject recognizes an event, a specific response is required, like pressing a button. An example of this is the classical oddball paradigm: A tone (1000 Hz) is repeatedly presented (the non-target) at intervals of 1-2 seconds while at random a higher tone (for instance 2000 Hz) is presented instead. (the target) Each time the non-target is presented, the subject should press a button, but when the target is presented, the subject should refrain from pressing this button. Alternatively, the subject could also count the times the target tone is presented and skip the nontargets, rather than pressing a button. By averaging the time-locked EEG signals at each event (a tone in this case), the ERP will become visible through potentials (waveforms) that have a certain latency (time in ms from stimulus onset) and a positive or negative amplitude, expressed in microvolts pk-pk.
In the example above taken from the BioTrace+ software on a NeXus-10, we can see the negative N100 component (at around 100 ms from stimulus onset) and the positive P300 component at around 350 ms, with an amplitude of 11 µV. This signal was measured on Cz with a linked ear reference. The green curve is the averaged response of the target stimuli, (100 averages) the red curve is the averaged response of the non-target stimuli. (250)
Note: the target stimulus is also called the GO event, and the non-target event is also called the NOGO event. The target is also sometimes called the ‘frequent’ stimulus and the nontarget the ‘rare’ stimulus. For ERPs the word ‘event’ and ‘stimulus’ mean the same.
Page 3 of 22
Mind Media BV, NeXus White Paper series: ERP/EP
2009-04 V0.92 (www.mindmedia.nl)
ERP Applications for research Analysis of the amount of response errors, reaction time and in particular, the latency and amplitudes of the ERP components, can provide important information about: a) how the human brain processes information (cognition) b) variables of attention. So while evoked potentials simply reflect the processing of the physical stimulus (the exogenous potentials) the event related potentials are caused by ‘higher’ processes that are thought to involve memory, expectation (Bereitschaftspotential) and attention. They are also called endogenous potentials. Thousands of ERP studies have been published up to date, for a wide range of applications. Some examples are listed below, in no particular order. a) b) c) d) e) f) g) h) i) j) k) l)
Attention problems Substance abuse Visual emotion processing Schizophrenia Alzheimer Sleep research Recognition memory Memory and language processing PTSD Mild traumatic brain injury Learning disabilities Autism
and so on…. On the www.pubmed.gov website of the U.S. National Library of Medicine and the National Institutes of Health you can search for an overview of published studies that involve ERP or P300 experiments.
Page 4 of 22
Mind Media BV, NeXus White Paper series: ERP/EP
2009-04 V0.92 (www.mindmedia.nl)
ERP: Electrode locations The ERP is typically acquired by placing the positive electrodes on the scalp according to the 10-20 EEG system while the negative electrodes are placed on the ear-lobes or mastoids as reference. (linked ear reference). Sometimes an average ear reference is used. In principle ERP’s are obtained with uni-polar (mono-polar) placements.
The ground electrode can be placed anywhere, but typical locations are: in the neck (cervical 7), on the nasion, or a free location on the head. The ERP can typically most clearly be observed on the central positions of the head. Some examples of electrode placements: a) Single channel placement: positive electrode 1 on Cz, reference on left ear, the ground electrode on the right ear. b) Dual channel placement with EOG artifact correction: positive electrode 1 on Cz and positive electrode 2 above the left eye (VEOG). Negative electrode 1 on left ear lobe, negative electrode 2 below the left eye. Ground on the neck. (cervical 7) c) Dual channel placement: positive electrode 1 on Cz, positive electrode 2 on Fz (or Pz), reference electrodes on linked ear. Ground on the neck. d) 4 channel placement: positive electrodes 1, 2 and 3 on Fz, Cz and Pz. Linked ear reference. Electrode 4 can be used for EOC artifact rejection or Fpz or Oz. e) 19 channel placement: all EEG channels (NeXus-32) are placed using the complete 10-20 system with channels 20 and 21 on A1 and A2 for linked ear or average ear reference. f) 64 channel placement: for ERP studies that involve source localization, minimally 19 but preferably 64 channels are used with ear reference.
Page 5 of 22
Mind Media BV, NeXus White Paper series: ERP/EP
2009-04 V0.92 (www.mindmedia.nl)
ERP: EEG settings for data acquisition Because the typical ERP contains long latency components (low frequency) such as the P300, the high pass filter settings should be set quite low. We advise a 0.1 Hz setting. When using higher settings, the P300 waveform may become suppressed and difficult to locate. The low pass filter can be set to 30 Hz (typical) or higher. We do not recommend using a DC-EEG signal without high pass filters, as DC-EEG may contain electrode drift. We advise to always use silver-silver/chloride electrodes or sintered electrodes which have minimum drift. Filter setting: use 0.1 Hz to 40 Hz as the standard filter settings. FIR filters are better for offline analysis as they cause no phase distortion. The standard IIR filters however can be used for both the online and offline data acquisition. Time window: use a time window of at least 500 milliseconds, so the P300 can be observed Samplerate: use a samplerate of minimally 256 SPS up to 1024 SPS if 1 millisecond precision is required.
ERP: Design of P300 experiments There exist many guidelines for doing ERP experiments, published by different authors. Here are a few basic hints and tips that we provide for general P300 experiments: a) b) c) d)
Keep the experiment (task) simple and avoid ambiguities Focus on a specific component (like the P300) Use a fairly high ratio of NOGO events to GO events. (3:1 or more) ** Minimize artifacts like eye blinking, swallowing, EMG, movement as in every EEG measurement. e) Use a randomized design. (randomized time between events, randomized occurrence of GO and NOGO events). BioTrace+ offers this functionality. f) When only using 1 or 2 channels: place them on the central positions (Cz,Fz,Pz) g) Study some recent literature regarding ERP’s and experiment design. ***
** The more ‘rare’ the GO event (target) is, the more pronounced a component like the P300 is. However this also means that more NOGO events need to be presented and the ERP experiment will last longer. In order to get a good averaged response for the P300, we advise to get at least 100 artifact free GO (target) events. With a ratio of 3:1 this means that there would be 300 NOGO events. Some studies use ratios that are even higher. (4:1 to 6:1) *** For a short list of recommended literature, please refer to the last pages of this document.
Page 6 of 22
Mind Media BV, NeXus White Paper series: ERP/EP
2009-04 V0.92 (www.mindmedia.nl)
What are Evoked Potentials? Evoked potentials (EP’s) are physiological responses in the EEG which are time locked to an ‘stimulus’ that is repeatedly (100+ times) presented to a human subject. Contrary to ERP’s no response or cognitive processing by the subject is required. The goal is to simply analyze the way the brain handles visual, auditory or somato-sensory input. (stimuli) As of version 2009, BioTrace+ supports visual evoked potential (VEP) with checkerboard patterns on a computer monitor, for VEP research purposes.
VEP: the visual evoked potential The VEP is triggered by repeated sensory stimulation of a subject’s visual field and can be made visible by averaging the time locked EEG. The visual stimulation can take place by: a) b) c) d)
Checkerboard pattern reversal Flashing black/white image Pattern onset stimulus Photic Stimulation (light)
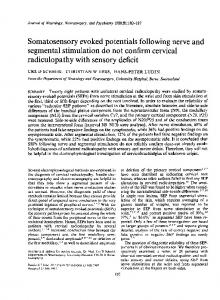
The current BioTrace+ version (2009) supports methods a & b. According to the “Visual Evoked Potentials Standard 2004” (by Vernon Odom et al), pattern reversal is the preferred technique for most clinical purposes. A sample pattern reversal VEP is shown below, with the N75, P100 and N135 components marked. (positive is UP)
Please note that the P100 peak latency is not only defined by physiological factors, but also by pattern size, pattern contrast, mean luminance, poor fixation and miosis. Please refer to the document by Vernon Odom et Al (2004) for more details.
VEP Applications for research Analysis of the averaged response of the VEP can provide information for research applications like: (in no particular order) a) b) c) d) e)
Photosensitivity and Epilepsy Cortical Visual Processing Cortical Blindness Optic Neuritis Multiple Sclerosis
Page 7 of 22
Mind Media BV, NeXus White Paper series: ERP/EP
2009-04 V0.92 (www.mindmedia.nl)
VEP: Electrode locations The VEP is typically acquired by using bi-polar placement according to the 10-20 system, when 1-4 channels are used. The simplest placement is a single channel bi-polar montage with the positive electrode on Fz and the negative electrode on Oz. The ground electrode can be placed on an earlobe, a mastoid, the forehead or a location like Cz. For 19 channel recording a referential placement can be used, so that the results can be mapped. (topographically)
VEP: EEG settings for data acquisition Filter setting: use 1 Hz to 100 Hz as the standard filter settings for offline analysis. FIR filters are recommended for offline analysis as they cause no phase distortion. The standard IIR filters can be used for the online data acquisition. (set at 1-40Hz) Time window: use a time window of at least 300 milliseconds, so the P100 is clearly visible. Samplerate: use a samplerate of 512 or 1024 samples per second.
Other evoked potentials: BAEP and SEP Other evoked potential applications like brainstem auditory evoked potentials and somatosensory evoked potentials are not supported by BioTrace+ at this time. Since they require either high samplerates above 10,000 samples/sec (BAEP) or electrical stimulators (SEP) no implementation is planned at this moment.
Page 8 of 22
Mind Media BV, NeXus White Paper series: ERP/EP
2009-04 V0.92 (www.mindmedia.nl)
NeXus: solving the problem of EEG & event synchronization In order to get high time-resolution on the averaged responses, the presented stimuli (events) must be synchronized very precisely with the EEG signals. Most ERP/EP equipment based on older technology suffers from unknown or varying latencies (delays) between the time that the stimulus is presented and the time it is recorded. This causes the following problems: a) Delay: the factual latencies of ERP/EP components are shifted in time and can be off by several milliseconds. (errors could be in the order of 5-10 ms or worse) b) Jitter: because of timing errors, the time between stimulus presentation and the recording of the event is unstable. This causes absolute shifts in ERP/EP components time as well as smoothing-out of the ERP/EP components.
Solution: the NeXus series of equipment solves this problem by measuring the exact time the actual stimulus (event) was presented and feeds it back into the digital trigger input of the NeXus through a special interface. The NeXus trigger input is monitored with the same timing and time resolution as the actual EEG and therefore the EEG and the stimuli are recorded with the same precision and timing.
This means that when the BioTrace+ Software generates (presents) a stimulus, there is no need to worry about any delays the Windows Operating System (© Microsoft) may introduce, as the hardware of the NeXus aqcuires and buffers the EEG signals and the TRIGGER input at the exact same time: in other words, within 1 data sample. This is so even if it takes some time for the data to travel from the NeXus to the PC by BlueTooth, USB or fiber optic. An example for the presentation of AUDIO stimuli is shown below:
As you can see in this picture, the audio tone is generated by the BioTrace+ software, then measured by the NeXus Trigger Interface and immediately fed back into the trigger input, while NeXus and BioTrace+ acquire the EEG signals. The same principle applies to light signals (computer images), as these can be measured with a light-sensor. NeXus-16 and NeXus-32 also have a trigger input, which is located on the front.
Page 9 of 22
Mind Media BV, NeXus White Paper series: ERP/EP
2009-04 V0.92 (www.mindmedia.nl)
NeXus: the digital trigger input The NeXus-10 and other NeXus systems with trigger inputs are able to acquire physiological signals, like the EEG, at high speed (256 to 2048 samples/sec) while simulateously acquiring events or stimuli through the trigger input. On the NeXus-16A, NeXus-16B and the NeXus-32 series, the trigger input is located on the front (see the red arrows in the pictures below) whereas on the NeXus-10 the trigger input is found at the back and coincides with the digital SpO2 (Oximetry) input. The only limitation of this is that on the NeXus-10 SpO2 can not be used during ERP/EP data acquisition.
Note: all NeXus systems with a trigger input support ERP/EP. The only difference is the number of channels and the connector used for the trigger input. The NeXus-4 does not have a trigger input and therefore does not support ERP or EP applications.
Page 10 of 22
Mind Media BV, NeXus White Paper series: ERP/EP
2009-04 V0.92 (www.mindmedia.nl)
BioTrace+ for NeXus: event presentation modes There are basically two modes of presenting stimuli (events) and recording the ERP and EP with NeXus and the BioTrace+ software: A) using the BioTrace+ built-in presentation builder and generator B) using a third party (external) event presentation software such as E-Prime (® Psychology Software Tools Inc. http://www.pstnet.com) or Presention (® Neurobehavioral Systems. http://www.neurobs.com )
Mode A: for quick and easy creation of ERP and EP experiments, we advise everyone to use the BioTrace+ built-in presentation builder and generator. For most ‘standard’ experiments involving sound or images this is the best option. BioTrace+ enables you to build your own list of stimuli (events) and use your own digital audio or images files, or the preset files of BioTrace+ to generate experiments with a few mouse clicks. Advantages: -
Quick and easy building and editing of eventlists Export and Import events lists created by others Works for several ‘standard’ ERP and VEP applications Randomization of events, timing and sequences You can use your own sound and images files Requires just one computer. Very high precision (time resolution) through the NeXus trigger interface.
Cons: -
Complicated experiments may not be possible Limited event editing options.
Mode B: when the BioTrace+ presentation builder does not suffice, or you already have created standard experiments with external stimulus presentation software, the other available option is to use that software and send the events through a serial communication cable (RS232) to the computer that is running BioTrace+. Advantages: -
Virtual unlimited freedom in creating event scripts The ability to use ‘standard’ scripts created by others Use your own sound and images files
Cons: -
Potentially time intensive programming and script creation Requires 2 computers and serial cable link Potential delays and unknown latencies by serial communication of events between the 2 computers. (the delays are unknown, but could be as large as 5-10 ms)
Note: please note that both modes (A and B) require additional external hardware. Mode A requires the NeXus Trigger Interface and Mode B requires a special RS232 connector cable that also outputs a signal to the trigger input of the NeXus.
Page 11 of 22
Mind Media BV, NeXus White Paper series: ERP/EP
2009-04 V0.92 (www.mindmedia.nl)
The NeXus Trigger Interface In order to get the high precision on the EEG and stimulus synchronization you will always need the NeXus Trigger Interface. Currently this is available in the Mark I version, which has the following inputs and outputs: a) Audio input: for a standard audio (mono) jackplugs based cable that connects to the audio output of your soundcard b) Microphone input: this connects to a mono microphone (included) which can record sounds from the environment for event synchronization c) Light-sensor input: this sensor measures the transition of dark to light on a computer screen which can be used to synchronize the presentation of images on a LCD computer screen. d) Trigger Output: this cable connects to the trigger input of your NeXus-10 or NeXus16/32. How does this interface work? When the BioTrace+ software is running and acquiring EEG (and other) signals, it is also continuously scanning the trigger input. When the software is simultaneously running a presentation (list of stimuli/events) and generates an audio event or presents an image, the Trigger Interface will measure when the audio tone is played and create an event marker in the EEG that marks this very event. After the session is over and all events (stimuli) have been presented, you will run an offline analysis in the BioTrace+ software which knows exactly WHICH events it has presented, and WHEN, because it fed them back in the trigger input. Does the Trigger Interface introduce any delay? The answer is simple: in principle it does not introduce any delays. This interface is entirely based on a hardware solution which will send a trigger to the NeXus once the AUDIO tone or LIGHT stimulus has been detected. AUDIO: For AUDIO it does depend on the audio wave files you use though. Please always use wave files that have a very short ‘attack’ so the sound is at full volume almost immediately. (within 2 ms) You also want to put the speakers close to the subject. Sound travels at about 343 meters per second and a distance of 1 meter would therefore already introduce a 3 ms delay! We do not advise to use headphones, as these may induce 50/60Hz interference onto the EEG. Putting the speakers within 30 cm of the subject’s ears (or closer) would be optimum. IMAGES: For the LIGHT stimulus, we may assume that for a LCD monitor all pixels are lit up at the same time and the eye and light sensor detect the IMAGE changes at the same time. In both cases it should be possible to reach up to 1 ms precision in event synchronization.
Please note: the NeXus Trigger Interface has been developed for research applications only and is not a medical device.
Page 12 of 22
Mind Media BV, NeXus White Paper series: ERP/EP
2009-04 V0.92 (www.mindmedia.nl)
BioTrace+: the event presentation builder The BioTrace+ event presentation builder works in several steps: 1) Step 1: choose the type of presentation and it’s type of paradigm, type of stimulus and data folder where the event files are located 2) Step 2: choose the parameters of the event timing, the randomization, type of required key presses etc… 3) Step 3: generate the list of events and edit the list of events manually if required. 4) Step 4: save the presentation file you just created.
Example1: an example for a P300 experiment In the example below, the STEP1 parameters for an ERP Oddball Paradigm are shown:
In the type of presentation, you may choose from: A) ERP presentation B) VEP presentation
In the type of paradigm you may choose from: A) B) C) D)
ERP: Single stimulus (1 GO event only) ERP: Oddball paradigm (GO and NOGO events) ERP: CNV Oddball with fixed warntone ERP: CNV Oddball with variable warntone
A) VEP: checkerboard pattern reversal B) VEP: monitor flash stimulus C) VEP: plug-in DLL photic stimulation (Optional: only available as add-on!)
In the type of Stimulus you may choose from: A) Visual stimulus B) Audio stimulus C) Plug-in DLL for external stimulation (Optional: only available as add-on!) Page 13 of 22
Mind Media BV, NeXus White Paper series: ERP/EP
2009-04 V0.92 (www.mindmedia.nl)
In the example below, an example is shown for STEP2. In this dialog box the parameters of the event timing and sequence can be set:
a)
In the time between events you enter how time there is between each next event. (here shown as minimally1000 ms and maximally 2000 ms) b) When the checkbox (Randomize time between events) is set, the computer will choose any time between MIN and MAX that you previously entered. c) Below the list of GO and NOGO event you can enter the required KEY presses for each GO or NOGO event. d) In the Amount fields, you enter how many GO and NOGO events should be generated. Here shown in the ratio 4:1 of NOGO to GO. e) The GO-NOGO randomization selects how much the computer will randomize the sequence of the events. You can manually edit this sequence in the list editor that opens after you click the “Next >>” button, which will build the list of events.
When you press “Next >>” the following box will appear. Press OK to continue:
After that the Event Presentation Editor will be displayed on the computer monitor.
Page 14 of 22
Mind Media BV, NeXus White Paper series: ERP/EP
2009-04 V0.92 (www.mindmedia.nl)
Example2: an example for a VEP experiment In the example below, the STEP1 parameters for a VEP experiment are shown:
In the example below, the STEP2 parameters for a VEP experiment are shown:
In this dialog box you can set the pattern reversal stimulus frequency, amount of stimuli, the duration and the image file you want to use. When you press “Next >>” a dialog box will appear for confirmation. Then press OK to continue and open the Event Presentation Editor which will display the generated list of stimuli.
Page 15 of 22
Mind Media BV, NeXus White Paper series: ERP/EP
2009-04 V0.92 (www.mindmedia.nl)
BioTrace+: the event presentation editor The BioTrace+ event presentation editor is where you view the entire list of events (stimuli) that BioTrace+ generated for you, using the parameters you entered. You can click on events and preview them. With the buttons “Move Up”, “Move Down” and “Remove Event” you can move single events up, down or remove them from the list. With the check box stating “Remove but keep time” you can select whether you want to create a “Gap” when you remove an event, or keep the time sequence in place. (this option is shown selected in the example below)
When you press the “Start Test” button, the event list will start to play and present you the entire list of events in preview mode. The LOAD and SAVE buttons can be used to load or save event presentation files. These are by default stored in the \BioTrace\Presentations folder. If you want to ENABLE the list of events currently in memory (loaded) and RUN the presentation at the next time you record a session, please set a check, in the checkbox shown at the left button side. If you do not set this check, you may have a presentation loaded into memory, but when you record a new EEG session, it will not be presented. Press the “OK” button to close this dialog box.
Page 16 of 22
Mind Media BV, NeXus White Paper series: ERP/EP
2009-04 V0.92 (www.mindmedia.nl)
BioTrace+: running an ERP/EP presentation Running an ERP or EP presentation, is as simple as building or loading a presentation file…
…then enable the “Run this presentation…” option in the Event Presentation Editor:
After this you load a feedback screen as usual. (for instance an EEG Master screen) and start a recording as usual. Just before starting the actual recording, the BioTrace+ software will ask you to confirm if you really want to run this presentation. Press OK to run the presentation or press CANCEL to start the session without running the presentation.
Please note: when you run a presentation that includes IMAGES, BioTrace+ will try to display these images on the secondary monitor, so you can use the primary monitor for the signal validation. If no secondary monitor and display screen is present, the primary monitor will be used instead! In that case, please load an empty screen, without virtual instruments.
Page 17 of 22
Mind Media BV, NeXus White Paper series: ERP/EP
2009-04 V0.92 (www.mindmedia.nl)
BioTrace+: ERP/EP Averaged Response Analysis When the ERP or EP presentation has finished (and the session has been stopped) you can choose the “Averaged Response Analysis” option from the main menu, or from the overview screen. (right click, under Analysis Options)
In the next Dialog Box you should select which EEG channels you want to use for the averaged response. The example below illustrates the two default channels, used on the NeXus-10.
Following this selection, you enter the ERP Analysis Dialog box.
Page 18 of 22
Mind Media BV, NeXus White Paper series: ERP/EP
2009-04 V0.92 (www.mindmedia.nl)
In the ERP Analysis dialog box you select the following options: 1) 2) 3) 4)
The single data channel you want to display. (say EEG1) The two ERP conditions you want to compare. (say NOGO and GO) The ERP conditions you want to overlap for all selected channels. The markers you want to add and display in the ERP graphs
The example below display the averaged response for the EEG1 raw data channel for 100 GO events (green graph) and 250 NOGO events. (red graph) recorded on a NeXus-10
When you press the “Compute/Refresh ERP Graphs” button, the software will recomputed the ERP graphs using the conditions you selected. When you press “Save ERP: ASCII file” the BioTrace+ software will save the ERP graphs in an ASCII format that can be imported into third party software.
Page 19 of 22
Mind Media BV, NeXus White Paper series: ERP/EP
2009-04 V0.92 (www.mindmedia.nl)
An example of a 21 channel ERP with NeXus-32: The example below display the averaged response for the EEG1 raw data channel for 100 GO events (green graph) and 400 NOGO events. (red graph) recorded on a NeXus-32.
The graphs on the right displays the all overlapped graphs (data channels) for condition 1, which are the NOGO events. Recording ERP or EP on the NeXus-32 is very similar to the NeXus-10. However the NeXus-32 will use 19 EEG channels (plus 2 for the linked ear reference) for the digital EEG, and therefore you will need to select these 19 channels before you do the ERP Analysis. An example is shown below (selection of channels 34 to 52)
Page 20 of 22
Mind Media BV, NeXus White Paper series: ERP/EP
2009-04 V0.92 (www.mindmedia.nl)
BioTrace+: ERP/EP Data Export When the ERP or EP presentation pressing the “Save ERP: ASCII file” button in the ERP Analysis dialog box, you can export the averaged response waveforms to an ASCII file. (tab separated)
The averaged EEG data is exported in a microvolts pk-pk (vertical axis) and can be imported into applications like (Microsoft ®) Excel, SPSS or Matlab. The examples shown here are from Microsoft Excel.
Note that the horizontal axis here is based on samples, with the rate being 512 samples/sec.
Page 21 of 22
Mind Media BV, NeXus White Paper series: ERP/EP
2009-04 V0.92 (www.mindmedia.nl)
Short list of recommended literature: 1) “An introduction to the event-related potentials technique”, by Stephen J.Luck. ISBN 0-262 12277-4 2)
“Event-Related Potentials, a Methods Handbook”, edited by Todd C. Handy. ISBN 0-262-08333-7
3) “Essentials of Clinical Neurophysiology “ by Karl E. Misulus. ISBN 0-7506-9887-X 4) “Visual evoked potentials standard (2004)”, by J. Vernon Odom et al. 5) “Guidelines for using human event –related potentials to study cognition: Recording standards and publication criteria.”, by T.W. Picton et al. (2000)
< END OF DOCUMENT >
For more information about NeXus, our BioTrace+ software and ERP/EP functions, please contact the Mind Media team at
[email protected]. Note: the copyright of this document remains with Mind Media BV © 2008/2009, and the contents of it may not be altered or copied. However we do permit unlimited distribution by electronics means of this document in the unaltered digital PDF format in which it is supplied. Please check the following weblink for updated versions of this document: http://www.mindmedia.nl/english/PDFGallery.php Author: Erwin Hartsuiker (Netherlands) Date: April 2009, Version V0.92
Page 22 of 22