Keywords: Noise Power Estimation, noise analysis, image restoration. Received Aug. 03, 2015; accepted for publication Aug. 26, 2015; published online Aug.
37
TechArt: Journal of Arts and Imaging Science, Vol. 2, No. 3, May 2015
Noise Power Estimation Using Wavelet Packet-Adaptive Thresholding Sinyoung Jun1, Wonseok Kang2 and Joonki Paik*,3 1 LG
electronics / Seoul, Korea University / Seoul, Korea *Corresponding Author (paikj @cau.ac.kr) 2 Chung-Ang
Abstract: We describe a method to estimate noise power using the minimum statistics approach, which was originally proposed for audio processing. The proposed minimum statistics-based method separates a noisy image into multiple frequency bands using the wavelet packet transform. By assuming that the output of the high-pass filter contains both signal detail and noise, the proposed algorithm extracts the region of pure noise from the high frequency band using an appropriate threshold. The region of pure noise, which is free from the signal detail and the DC component, is well suited for minimum statistics conditions, in which the noise power can easily be extracted. The proposed algorithm significantly reduces the computational load by using a simple, iteration-free processing architecture, and provides an estimation accuracy rate of over 96 % for strong noise at an SNR of 0 to 30 dB in the input image. Experimental results show that the proposed algorithm can accurately estimate noise power, and is particularly suitable for fast, low-cost image restoration or enhancement applications. Keywords: Noise Power Estimation, noise analysis, image restoration Received Aug. 03, 2015; accepted for publication Aug. 26, 2015; published online Aug. 28, 2015. DOI: 10.15323/techart.2015.08.2.3.37 / ISSN: 2288-9248.
1. Introduction Over the past few decades, various image restoration methods have been proposed for removing degradation factors from degraded images. However, most image restoration problems are classified as ill-posed problems. In order to solve an ill-posed problem, inverse processes or statistical approaches are mainly used. Well-known restoration methods such as the parameterized Wiener filter, constrained least-squares filter, and regularizedbased restoration filter use the priori information (i.e., noise power) of a degraded image to estimate an optimal solution. In particular, accurate estimation of the noise power affects the quality of the restored image [1], [2]. A noise power estimation method that applies a minimum statistics approach to the rests between words has been proposed in the field of speech processing [3]. In order to apply the above-mentioned method in image processing, a method to accurately estimate pure noise components from an original image is needed. The wavelet packet transform can separate the image signal into lowand high-frequency sub-bands, while simultaneously providing spatial-frequency information. Therefore, the wavelet packet transform can estimate the noise signal in the image signal. Based on this property, in this paper we propose a noise power estimation method using an adaptive threshold in the transformed wavelet domain [4][9].
Experimental results show that the proposed algorithm can accurately estimate noise power, and is particularly suitable for fast, low-cost image restoration or enhancement applications. The paper is organized as follows. After briefly reviewing the wavelet packet transform and degradation model in section 2, the proposed noise power estimation method is described in section 3. Section 4 summarizes experimental results, and section 5 concludes the paper.
2. Degradation Model and Wavelet Packet Transform In this section, we describe the wavelet packet transform and image degradation model. A. Image Degradation Model In order to perform noise power estimation from an observed image, the image degradation model is defined as g ( x, y ) h ( x, y ) f ( x , y ) ( x, y ) ,
(1)
where f ( x, y ) represents the original image, h( x, y ) the linear degradation operator, ( x, y ) the additive noise, and the convolution operator. In order to simulate the noise power estimation, we assume that additive noise represents the additive white Gaussian noise (AWGN). B. Wavelet Packet Transform
S. Jun et al.: Noise Power Estimation Using Wavelet Packet-Adaptive Thresholding A wavelet transform can separate the image into lowand high-frequency subbands corresponding to the DC and AC components, respectively, and provides the advantage of maintaining the spatial-frequency of the original image. The mathematical description of the wavelet transform is defined as [1],[5]
W ( j0 , m, n )
1 MN
1 MN
thresholding value. The block diagram of the proposed method is shown in Fig. 2.
Fig. 2. Flow chart of the proposed algorithm.
M 1 N 1
f ( x, y) x 0 y 0
j0 ,m,n ( x,
y) ,
(2)
A. Wavelet Packet Transform of the Image In order to separate the edge and noise signals from the input image, we perform a two-level wavelet packet transform, as shown in Fig. 3.
and
Wi ( j, m, n )
38
M 1 N 1
f ( x, y )
i j ,m ,n ( x ,
y ),
x 0 y 0
(3)
for i H ,V , D. where subscript j0 represents an arbitrary starting scale, W ( j0 , m, n) the approximation coefficients of f ( x, y ) at
scale j0 , Wi ( j, m, n) one of three directional wavelet coefficients (horizontal, vertical, and diagonal), and ( x, y ) and ( x, y ) the 2D scaling and wavelet functions, respectively. Fig. 3. Two-level wavelet packet transform.
As shown in Fig. 3, the wavelet packet subbands have the spatial-frequency properties of the original image, and DC components are contained in low-frequency subband a ( m, n ) . The 15 high-frequency subbands d (m, n ) contain the edge signals corresponding to high-frequency components of the original image, and more noise components exist in the high-frequency subbands.
Fig. 1. Wavelet packet tree diagram.
Fig. 1 shows the wavelet packet transformation process [4],[6],[7]. As shown in Fig. 1, the wavelet packet transform is subsequently reapplied to the wavelet transform process in the wavelet transformation for each subband. The result of the two-level wavelet packet transform is separated into one low-frequency subband, according to the DC component and 15 high-frequency subbands.
3. Noise Power Estimation using Region-based Edge Map In this section, we describe the noise power estimation method using an estimated edge map and adaptive
Fig. 4. Illustration of each region weight.
To separate the edges and noise components in the highfrequency subbands, the proposed method assigns lower weights according to the 1st – 2nd regions, 3rd – 5th regions, 6th – 9th regions, 10th – 12th regions, 13th – 14th regions, and 15th region, as shown in Fig. 4. Finally, the edge map is generated by the pre-defined threshold using the estimated weight values as te [max{d DL (m, n)} min{d DL (m, n)}] ,
(4)
39
TechArt: Journal of Arts and Imaging Science, Vol. 2, No. 3, August 2015
where represents the adjustable weighting value, and te represents the threshold value that is used to generate a binary map. MIN and MAX represent the minimum and maximum values of the respective data. C. Noise Power Estimation using Edge Map In this section, we describe the noise power estimation method using the obtained edge map. In this study, we assume that image noise is AWGN. The power spectrum of noise in the continuous time space is defined as [3] PNN ( f )
rNN (t )e j 2 ft ft 2
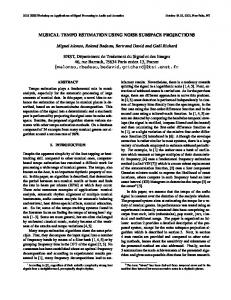
Fig. 5. Original image and the image created by the proposed algorithm (SNR = 20 dB).
(5)
4. Experimental Results
where PNN ( f ) represents the power spectrum of noise, To objectively evaluate its performance, the proposed method was tested on several 256 256 test images (Lena, Cameraman, Barbara, Boat, Goldhill, contrast-enhanced Boat). The weight value was set to a multiple of 2, and was set to 3. To evaluate the accuracy of the proposed noise power estimation method, we added AWGN of 0–30 dB and linear degradation operators with sizes of 7 7 and 11 11 . The noise power estimation results are summarized in Tables 1 and 2. Based on Tables 1 and 2, the proposed method shows accuracy rates of over 90 % and 97 % for 7 7 and 11 11 linear degradations, respectively. More specifically, the proposed method provides higher noise power estimation accuracy, because the high-frequency components only include the noise signals for the large linear degradation operator.
rNN ( t ) the autocorrelation function, and 2 the noise variance. DD
Therefore, the part of region d (m, n) without an edge map may be referred to as a noise signal; the proposed method can estimate noise power by computing DD
the variance from the part of region d (m, n) without an edge map. Fig. 5 shows the original image and the edge map created by the proposed method.
Table 1. Estimation results ( 7 7 uniform blur).
Original Noise Power
Estimated Noise Power
Accuracy (%)
Original Noise Power
Lena Image
SNR
Estimated Noise Power
Accuracy (%)
Original Noise Power
Cameraman Image
Estimated Accuracy Noise (%) Power Barbara Image
0 dB
3239.7
3235.4
99.9
4210.5
4212.4
99.9
2792.2
2800.1
99.7
5 dB
1024.5
1021.7
99.7
1331.5
1330.2
99.9
882.96
884.57
99.8
10 dB
323.96
323.1
99.7
421.04
420.04
99.8
279.21
278.11
99.6
15 dB
102.44
102.33
99.9
133.14
133.25
99.9
88.296
88.232
99.9
20 dB
32.396
32.577
99.4
42.104
42.549
98.9
24.981
28.256
98.8
25 dB
10.244
10.484
97.7
13.314
13.603
97.8
8.8296
9.1691
96.2
30 dB
3.2397
3.4633
93.1
4.2105
4.4194
95.0
2.7922
3.0753
89.9
0 dB
2133.8
2135
99.9
2707.3
2710.5
99.9
561.5
562.1654
99.9
Goldhill Image
Boat Image
Modified Boat Image
5 dB
674.78
674.79
99.9
856.12
856.14
99.9
177.56
177.5048
99.9
10 dB
213.38
213.5
99.9
270.73
270.57
99.9
56.15
56.0949
99.9
15 dB
64.478
67.527
99.9
85.613
86.197
99.3
17.756
17.8579
99.4
20 dB
21.338
21.4
99.7
27.073
27.4946
98.4
5.6151
5.704
98.4
25 dB
6.7478
6.8241
98.9
8.5613
8.8412
96.7
1.7756
1.8326
96.7
30 dB
2.1338
2.2044
96.7
2.7073
2.8853
93.4
0.5615
0.5983
93.4
S. Jun et al.: Noise Power Estimation Using Wavelet Packet-Adaptive Thresholding
40
Table 2. The result of estimation ( 11 11 uniform blur).
Original Noise Power
Estimated Noise Power
Accuracy (%)
Original Noise Power
Lena Image
SNR
Estimated Noise Power
Accuracy (%)
Original Noise Power
Cameraman Image
Estimated Accuracy Noise (%) Power Barbara Image
0 dB
3239.7
3236.4
99.9
4210.5
4212.9
99.9
2792.2
2793.7
99.9
5 dB
1024.5
1022.8
99.8
1331.5
1330.7
99.9
882.96
884.82
99.8
10 dB
323.96
323.23
99.8
421.04
419.77
99.7
279.21
278.0
99.6
15 dB
102.44
101.74
99.3
133.14
131.71
99.7
88.296
87.238
98.8
20 dB
32.396
32.114
99.1
42.104
42.341
99.4
27.981
27.011
96.7
25 dB
10.244
10.305
99.4
13.314
13.478
98.8
8.8296
8.7434
99.9
30 dB
3.2397
3.29
98.4
4.2105
4.2959
98.0
2.7922
2.854
97.8
0 dB
2133.8
2134.5
99.9
2707.3
2711.3
99.9
561.5
562.29
99.8
Goldhill Image
Boat Image
Modified Boat Image
5 dB
674.78
674.27
99.9
856.12
857.25
99.9
177.56
177.76
99.8
10 dB
213.38
212.92
99.8
270.73
270.37
99.9
56.15
56.071
99.8
15 dB
67.478
67.231
99.6
85.613
85.385
99.7
17.756
17.712
99.7
20 dB
21.338
21.062
98.7
27.073
27.158
99.7
5.6151
5.6325
99.6
25 dB
6.7478
6.5426
97.0
8.5613
8.5868
99.7
1.7756
1.7793
99.7
30 dB
2.1338
2.1212
99.4
2.7073
2.76
98.1
0.5615
0.5732
97.9
In the case in which Barbara contains more highfrequency subbands and a noise level of 30 dB, the noise power accuracy increased by approximately 8 % when the size of the linear degradation operation was changed from 7 7 to 11 11 . For the Goldhill image, the proposed method provides accuracies of 96.7 % and 99.4 % for the 7 7 and 11 11 linear degradation operators, respectively. In addition, because the proposed method was robust for the brightness, noise power was estimated for the Boat image, and its contrast enhanced the image by a small amount. Experimental results show that the proposed method can estimate noise power with only a 4 % error rate for noise levels of 0–25 dB. Fig. 6 shows the noise power estimation error of the degraded image using uniform blur. The error rate for all six test images is less than 4 %, which shows the effectiveness of the proposed method.
5. Conclusion In this paper, we proposed a noise power estimation method using a wavelet packet transform. The SNR degradation results showed an accuracy rate greater than 90 % in cases with noise levels of 0 dB – 30 dB. Estimation errors for video images with less than a 5 % change from the inside to the outside of the image were not sensitive to changes in noise. Experimental results show that the proposed algorithm can accurately estimate the noise power using a simple wavelet packet transformation. Therefore, it can be applied to parameterized Wiener filters, constrained least-squares filters, and various restoration filters.
Acknowledgement This work was supported by Institute for Information & communications Technology Promotion (IITP) grant funded by the Korea, by the MSIP (Ministry of Science, ICT and Future Planning), Korea, under the ITRC (Information Technology Research Center) support program (IITP-2015-H8501-15-1018) supervised by the IITP (Institute for Information & communications Technology Promotion), and by the Technology Innovation Program (Development of Smart Video/Audio Surveillance SoC & Core Component for Onsite Decision Security System) under Grant 10047788.
Fig. 6. Accuracy chart of estimated noise power using 11×11 uniform blur.
41
TechArt: Journal of Arts and Imaging Science, Vol. 2, No. 3, August 2015 restoration, super-resolution, and image enhancement.
References [1] R. Gonzalez and R. Woods, Digital image processing, 2nd ed., Prentice Hall, 2001. [2] M. Banham and A. Katsaggelos, "Digital image restoration," IEEE Signal Processing Magazine, vol. 14, no. 2, pp. 24-41, March 1997. [3] S. Mallat, A Wavelet Tour of Signal Processing, New York: Academic Press, 1998. [4] N. Rajpoot, R. Wilson, F. Meyer, and R. Coifman, “Adaptive wavelet packet basis selection for zerotree image coding,” IEEE Trans. Image Processing, vol. 12, no. 12, pp. 1460 – 1472, December 2003. [5] H. Yan, W. Cheng, G. He, G. Li, and S. Dong, “Multiscale Variational threshold SAR image denoising based on quad-tree complex wavelet packets transform,” IEEE Workshop on Digital Media and its Application in Museum and Heritages, pp. 57 – 62, December 2007. [6] L. Qingwu and H. Chunyuan, “Application of wavelet threshold to image de-noising,” IEEE International Conference on Innovative, Computing, Information and Control, vol. 2, pp. 693 – 696, August 2006. [7] P. Shui, Z. Zhou, and J. Li, “Image denoising algorithm via best wavelet packet base using wiener cost function,” IET Image Processing, vol. 1, no. 3, pp. 311 – 318, September 2007. [8] M. Kon, W. Jiangfeng, T. Davidson, and J. Qu, “Wavelet packet division multiplexing and wavelet packet design under timing error effects,” IEEE Trans. Signal processing, vol. 45, no. 12, pp. 2877 – 2890, December 1997. [9] R. Martin, "Noise power spectral density estimation based on optimal smoothing and minimum statistics," IEEE Trans. Speech and Audio Processing, vol. 9, no. 5, pp. 504-512, July 2001.
Biographies Sinyoung Jun was born in Busan, Korea, in 1982. He received B.S. degrees in electronic and electrical engineering from Chung-Ang University, Korea, in 2008 and an M.S. degree in image engineering from Chung-Ang University, Korea, in 2010. Currently, he is a researcher at LG electronics. Wonseok Kang was born in Jeju, Korea in 1983. He received a B.S. degree in electronic engineering from Korea Aerospace University, Korea, in 2010 and an M.S. degree in image processing from Chung-Ang University, Korea, in 2012. Currently, he is pursuing a Ph.D. degree in image processing at Chung-Ang University. His research interests include image
Joonki Paik was born in Seoul, Korea in 1960. He received a B.S. degree in control and instrumentation engineering from Seoul National University in 1984. He received M.S. and Ph.D. degrees in electrical engineering and computer science from Northwestern University in 1987 and 1990, respectively. From 1990 to 1993, he worked at Samsung Electronics, where he designed image stabilization chip sets for consumer camcorders. Since 1993, he has been on the faculty at ChungAng University, Seoul, Korea, where he is currently a professor in the Graduate School of Advanced Imaging Science, Multimedia and Film. From 1999 to 2002, he was a visiting professor in the Department of Electrical and Computer Engineering at the University of Tennessee, Knoxville. Dr. Paik was a recipient of the Chester-Sall Award from the IEEE Consumer Electronics Society, the Academic Award from the Institute of Electronic Engineers of Korea, and the Best Research Professor Award from Chung-Ang University. He has served the Consumer Electronics Society of IEEE as a member of the editorial board. Since 2005, he has been the head of the National Research Laboratory in the field of image processing and intelligent systems. In 2008, he worked as a full-time technical consultant for the System LSI Division at Samsung Electronics, where he developed various computational photographic techniques including an extended depth-of-field (EDoF) system. From 2005 to 2007, he served as Dean of the Graduate School of Advanced Imaging Science, Multimedia, and Film. From 2005 to 2007, he was Director of the Seoul Future Contents Convergence (SFCC) Cluster established by the Seoul Research and Business Development (R&BD) Program. Dr. Paik is currently serving as a member of Presidential Advisory Board for Scientific/Technical policy of the Korean government and as a technical consultant for the Korean Supreme Prosecutor’s Office for computational forensics.