IEEE TRANSACTIONS ON BIOMEDICAL ENGINEERING, VOL. 48, NO. 5, MAY 2001
501
Noise Reduction in Brain Evoked Potentials Based on Third-Order Correlations R. R. Gharieb*, Member IEEE, and Andrzej Cichocki, Member IEEE
Abstract—In this paper, we use third-order correlations (TOC) in developing a filtering technique for the recovery of brain evoked potentials (EPs). The main idea behind the presented technique is to pass the noisy signal through a finite impulse response filter whose impulse response is matched with the shape of the noise-free signal. It is shown that it is possible to estimate the filter impulse response on basis of a selected third-order correlation slice (TOCS) of the input noisy signal. This is justified by two facts. The first one is that the noise-free EPs can be modeled as a sum of damped sinusoidal signals and the selected TOCS preserve the signal structure. The second fact is that the TOCS is insensitive to both Gaussian noise and other symmetrically distributed non-Gaussian noise, (white or colored). Furthermore, the approach can be applied to either nonaveraged or averaged EP observation data. In the nonaveraged data case, the approach therefore preserves information about amplitude and latency changes. Both fixed and adaptive versions of the proposed filtering technique are described. Extensive simulation results are provided to show the validity and effectiveness of the proposed cumulant-based filtering technique in comparison with the conventional correlation-based counterpart. Index Terms—Autocorrelation function (ACF), brain evoked potentials (EPs), matched filtering, signal enhancement, third-order correlations (TOC).
I. INTRODUCTION
T
HE SENSORY brain evoked potentials (EPs) are electrical responses of the central nervous system to sensory stimuli applied in a controlled manner. The EPs have a number of clinical applications including, critical care and operating room monitoring and the diagnosis of a variety of neurological disorders [1]–[13]. The problem often encountered in the analysis of the EPs is that the signal-to-noise ratios (SNRs) is less than 0.0 dB. Ensemble averaging and weighted ensemble averaging methods have been usually used to enhance the SNR. Such methods can be thought of as lowpass filtering of noise and a large number of sweeps is usually required to obtain a suitable estimate of the EP. Adaptive filtering techniques have been extensively used for the enhancement and recovering of various biomedical signals
Manuscript received May 17, 2000; revised November 2, 2000. Asterisk indicates corresponding author. *R. R. Gharieb is with the Laboratory for Advanced Brain Signal Processing, Brain Science Institute, RIKEN, Wako-Shi, Saitama, 351-0198 Japan, on leave from Assiut University, Egypt (e-mail:
[email protected]). A. Cichocki is with the Laboratory for Advanced Brain Signal Processing, Brain Science Institute, RIKEN, Wako-Shi, Saitama, 351-0198 Japan, on leave from Warsaw University of Technology, Warsaw, Poland. Publisher Item Identifier S 0018-9294(01)03389-4.
observed in noise [26]–[30]. In the case of recovering of the EPs, the noisy EPs are taken as the primary input while, because the reference noise is in general not available, the auxiliary reference input has been taken as constructed models of the EPs. Various kinds of basis functions have been used to construct such models. One of the basis functions that have been adopted is the impulse correlated reference [1], [13]. Fourier series and Walsh sequences have been taken as sets of orthogonal basis to remove the dependence of the filter coefficients [1], [2]. The least-mean square algorithm has been commonly used, due to its simplicity, for the adaptation of the filter coefficients. These coefficients, which are the parameters of the constructed EPs models, are utilized for diagnostic purposes. The fundamental problem in these techniques is to establish how much the assumed model is close to the real EP signal. Furthermore, these techniques cannot be efficient for highly colored noise case. Wavelet transform-based techniques have been also used for extracting biomedical signals from noise. However, these techniques are still in need of applying some kind of filtering in the scale domain [26]. Recently, employing higher order statistics (or cumulants) has become an efficient approach for detection of deterministic or non-Gaussian signals in Gaussian noise. This is motivated by the fact that higher order cumulants have a natural tolerance to Gaussian noise (white or colored). In brain signal processing, higher order cumulants have been used to study quadratic nonlinearity of the electroencephalogram (EEG) signal by investigating the frequency coupling appeared in the bispectrum of the EEG signal [14], [15]. Higher order cumulants-based approaches have been also adopted for harmonic retrieval, spectral estimation and for line enhancement [18]–[23]. For line enhancement, it has been shown that diagonal fourth-order cumulant slice, in some sense, represents a matched filter that maximizes the SNR [23]. Our effort in this paper is to make use of advantages of higher order statistics (or cumulants) in developing a filtering technique suitable for the recovery of the EP buried in additive noise. We present a cumulant-based filtering technique for the recovery of the EP observed in additive noise. In the proposed technique, the impulse response of the employed finite impulse response (FIR) filter is computed using a selected slice of the third-order correlation (TOC) of the input signal. Therefore, the presented technique performs well for either Gaussian noise or any symmetrically distributed non-Gaussian noise (white or colored). Although TOC-based methods have already been used for estimating parameters of damped sinusoids in noise, filtering approach based on TOC for the extraction of the EP from noisy observations is of primarily interest. However, as evident from a literature survey, such approach has been not elaborated for the
0018–9294/01$10.00 © 2001 IEEE
502
IEEE TRANSACTIONS ON BIOMEDICAL ENGINEERING, VOL. 48, NO. 5, MAY 2001
enhancement of the EP. The rest of the paper is organized as follows. Section II is a background including the EP model and parameter estimation and filtering technique for the recovery of the EP. Section III explains the computation of the selected TOCS. Section IV presents both the TOC-based batch and adaptive filtering techniques. In Section V, exemplary simulation results are presented and finally in Section VI discussions and conclusions are drawn.
the least-squares model fitting methods. The former provides the determination of the frequency and the damping coefficients while the later, based on the estimated frequency and damping coefficients, yields the phase and amplitude parameters. In the LP approach, the transfer function of the prediction error filter (PEF) which are also the prediction coefficient in the autoregressive model
II. BACKGROUND
is computed by minimizing the output energy of the PEF. This can be interpreted as the least-squares solution of the LP equations [25]
A. Signal Model and Problem Formulation To avoid the limitations associated with modeling the brain EP as a sum of harmonically related sinusoids [2], the transient nature of the EP is more suitable to be modeled as a sum of damped sinusoids in time [24], [25] (1) where is the number of available points in the discrete-time and sequence (2) (3) and are amplitude, phase, damping coin which efficient and frequency parameters, respectively, and is the sampling time. are available In general, only noisy observations of (4) is a zero-mean additive noise statistically indepenwhere . The additive noise is assumed to be the output of dent of a stable linear time-invariant (LT) system driven by either independent and identically distributed (i.i.d.) (i.e., white) Gaussian noise or symmetrically distributed white non-Gaussian noise. The signal-to-noise ratio (SNR) is defined by (5) is the noise variance. where The objective is to extract the signal . vations
from noisy obser-
B. Extraction of the EP from the noisy observed verExtraction of the EP signal when the noise is white can be accomplished using sion two approaches. The first approach is to employ the observed so data in the identification of the parameters that the noise-free EP is given by (1). The second approach is to build up a filter that is matched with the noise-free EP signal . As we will demonstrate in this paper such filtering indeed improves the SNR. Parameter Identification: Estimation of the parameters of the noise-free EP can be achieved by combining both the linear prediction (LP) approach [25] and
(6)
(7) where efficients, the matrix by
.. .
is the vector of the prediction coand the vector are, respectively, given
.. .
.. .
(8)
(9) The singular-value decomposition (SVD) approach could be applied to (7) in order to improve the performance of the LP approach. The PEF transfer function will have zeros at if is chosen to satisfy the inequality . Then the damping coefficients and the frequencies are, respectively, given by (10) (11) After the determination of the damping coefficients and the frequencies, the amplitudes and phases can be computed from (1) using the least squares fitting. In this case, the observed signal , will be taken as an approximation to the EP . Therefore, because the estimation of the parameters is achieved using the noisy observed data, estimated values will be affected (biased) by the SNR. It is worth to mention that the number of sinusoids depends on the estimated number of frequencies. Least-squares solution of (7) implies that the coefficient vector of the PEF is computed using second-order statistics of the observed signal. The problem arises when the noise is colored. In this case, the autocorrelation function (ACF) of such noise can be modeled as a sum of damped sinusoids. Therefore, the eigen frequencies of the noise model can be interpreted as sinusoidal frequencies, which means that this approach may fail to correctly pick up the actual number of sinusoids associated . with the noise-free EP signal Filtering Technique: It is not possible to extract the from the observed signal when noise-free signal both spectra of signal and noise are overlapped. In such case, it is only possible to enhance the SNR. This enhancement can be obtained using the well-known Wiener filter. The transfer
GHARIEB AND CICHOCKI: NOISE REDUCTION IN BRAIN EPs
503
function of the Wiener filter in the frequency domain is given by [26]
for , is a positive constant, and “ ” denotes conjugation for complex valued signals. Due to the assumptions mentioned in (1) and (4) both the ACF and the TOC are given by
(12) (15) and are the spectra of both signal and where noise, respectively. However, due to the fact that the spectra of both signal and noise are separately unknown, the Wiener filter (12) cannot be implemented in direct fashion. Therefore, the problem is still how to compute the noise-free spectrum based on the observed noisy signal. An approximation of the Wiener filter can be implemented if the signal spectrum is composed of spectral lines of the signal and white noise. In such case, is taken as the the transfer function of the Wiener filter power spectrum of the noisy signal. Therefore, the filter gain at the frequency where the signal exists is proportional to the signal power while where the noise only exist the gain drops to noise power divided by . This procedure has been successfully used for the enhancement of sinusoids in white noise [31]. Although this approximation is acceptable in white noise case, the problem arises when both signal and noise are narrowband signals. In this case, the filter spectrum will be matched with both signal and noise. This implies that the filter will operate like allpass filter so that the output will be a version of the input noisy signal. In this paper, we try to relax the above-mentioned drawbacks and to build up a filter that is matched with the noise-free signal alone even if the noise is either white or colored. Therefore if both signal and noise spectra are not overlapped, the output of the filter will be a version of the noise-free signal alone. Our idea is to use TOC for the estimation of the filter spectrum from the noisy signal. Therefore this procedure can efficiently reduce the effect of additive Gaussian noise or other symmetrically distributed non-Gaussian noise.
(16) is the true ACF of the additive noise . It is where obvious from (15) and (16) that estimates of the TOC are essenwhile tially estimates of the TOC of the noise-free signal estimates of the ACF of the noisy signal are estimates of the plus estimates of the ACF of the additive noise ACF of . are Additionally, using (1), the ACF and the TOC of given by (17)
(18) or by (19) (20) where (21)
III. SECOND- AND THIRD-ORDER CORRELATIONS In this section, it is shown that the spectrum of the noise-free signal can be approximately estimated from special one-dimensional (1-D) slice of the TOC of the noisy-signal. To compute both second-order correlation (or generally the ACF) and the , we will assume two cases. First, we will asTOC slice of is of infinite length, i.e., both sume that the signal and are of infinite length and next the more practical case is of finite length is considered. in which Infinite-Data Length: In this case, the ACF and the 1-D TOC (with dc value removed) can be estimated using slice of
(22) It is apparent from (19) and (20) that both the ACF and the TOCS preserve the noise-free signal structure provided that and for all . However, unfortunately, the ACF of the noise-free signal cannot be estimated from the noisy observed signal. Finite-Data Length: In this case, the ACF and the 1-D TOC slice can be estimated using
(23) (13)
(14)
(24)
504
IEEE TRANSACTIONS ON BIOMEDICAL ENGINEERING, VOL. 48, NO. 5, MAY 2001
for
(25)
by the fact that this TOCS preserves the signal structure and is insensitive to Gaussian noise or other symmetrically distributed non-Gaussian noise. The impulse response, can be estimated as
(26)
(32)
(27)
and This implies that the impulse response is of length samples of the in order to construct it we need to estimate TOCS, using the estimator (24). The symmetry nature of the is preferred for causality validation. impulse response The output of the filter, which represents the enhanced signal, is given by
. For
, (23) and (24) can be written as
where
(28)
(33)
Again since (27) and (28) are independent of , (25) and (26) and preserve the structure of the signal provided that for all . Investigating (28), it is obvious that if
where is a factor ensuring unity Skewness gain for the filter. of the second-order correlationThe impulse response based counterpart is given by [31]
(29)
(34)
for any and . This condition holds if the noise-free signal could actually be modeled as a damped sinusoidal signal, i.e., all damping coefficients are not equal to zero. or , It is worthwhile to mention that for either is given by
The output of the ACF-based filter is given by (33) with the by . In this case, the factor is also replacement of adopted. The variance is not used for the adjustment of the filter gain because the variance is biased by the noise. Adaptive Filtering: In order to keep the advantage of adaptive filtering techniques, in being capable of online tracking slow changes of the signal, an adaptive version of the fixed one described by (32) and (33) is developed. This can be achieved by obtaining the impulse response of the filter as an estimate of the average of TOCS computed using a sliding window
(30) is approximately independent of if the maxIn this case, . imum value of the selected time shift is such that decreases with the increase of From (30), it is obvious that , therefore, we adopt the case where 0 and . IV. THIRD-ORDER CORRELATION-BASED FILTERING TECHNIQUE Batch Filtering: Instead of looking for the signal parameters, our objective is to extract an enhanced version of the EP from the noisy observed signal. This can be achieved by filtering the noisy signal using a filter whose bandpass is matched with the band of the EP signal alone. To explain our idea, let us first explain the idea of the well known matched filter [26]. In matched from the noisy obfiltering, to extract the noise-free signal , the noisy signal is passed through an FIR filter served whose impulse response is the reversed time of the noise-free signal, that is, the impulse response is given by (31) This implies that the filter impulse response is matched to the shape of the signal to be recovered (especially when the noise is not a priori is white). But unfortunately, since the signal known, an estimate of this impulse response is required. In this paper, the impulse response of an FIR filter is suggested to be proportional with an estimate of the selected TOCS of the noisy signal, described in Section III. This is motivated
(35) is the window length. Moreover, we can use a bank of where first-order infinite impulse response (IIR) lowpass filters for the implementation of (35). The TOCS can be recursively computed using (36) , where is so-called the forfor getting factor. Selecting small values for yields fast tracking capability but poor smoothing and large values mean slow convergence but better smoothing. This implies that selection of the value of is a tradeoff between fast tracking and good smoothing. The impulse response of the adaptive filter at the th iteration is then given by . (37) After convergence the impulse response of the adaptive filter represents an estimate of the TOCS of the noisy input signal in addition to the capability of forgetting most old samples and to give the most significant weights to the recent data.
GHARIEB AND CICHOCKI: NOISE REDUCTION IN BRAIN EPs
505
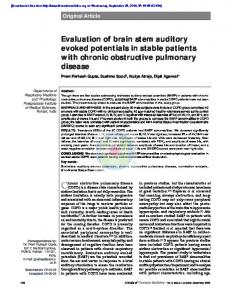
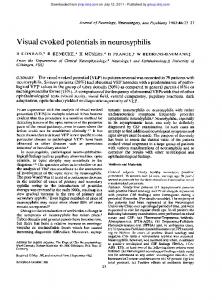
It is worth to mention that the second-order counterpart of (35) is well known and is given by (38) V. SIMULATION AND EXPERIMENTAL RESULTS To verify the validity and effectiveness of the presented TOCbased filtering technique, the following simulations for synthetically modeled EPs have been conducted. Results of the presented technique are compared with those of the ACF-based associated counterpart. In all examples, the time constant with the TOC-based approach is taken equal to zero. Noise-Free Case: Example 1: In this simple example, we want to show the operation of the TOC on a simple time series that is modeled as a damped sinusoid. The time-series is generated using (39) whereas Fig. 1(b) Fig. 1(a) shows the time function of shows both the normalized ACF and the TOCS for 256. It is obvious that both the ACF and the TOCS preserve identical damped sinusoidal functions over the positive timeshift. As it is expected, attenuation of the TOCS is stronger than that of the ACF. Noisy Case: In all the following simulation examples, the noisy EP signal is generated according to (40) is the noise-free EP and both and are where additive noise (all three components are assumed to be completely unknown). We have taken three typical signal models for the EP. The first is shown in Fig. 2(a), the second is shown in Fig. 4(a) and the third is shown in Fig. 5(a). The duration of these EP signal models is 250 ms and they are sampled at is 1500. The noise rate of 6 kHz, i.e., the sequence length is colored Gaussian or uniformly distributed noise generated by passing white Gaussian or uniformly distributed noise through Butterworth IIR bandpass filter of order six and cutoff is modeled as a white frequencies [0.05, 0.075). The noise Gaussian noise. This implies that the noise spectrum is a flat superimposed by a narrowband from normalized frequency 0.05 to 0.075. In all batch examples, we adjust the power of the EP is adjusted to achieve to unity and the power of the noise 3.0 dB for fixed filtering examples and 3.0 dB for adaptive filtering examples. Hereafter, SNR implies the power ratio of to the colored noise . Batch Filtering: Example 2: In this example, the noise-free EP signal shown in Fig. 2(a) is used. In order to fairly evaluate both the ACFand the presented TOC-based filtering approaches, we compute the enhanced signal as the average of 20 independent (20 Monte Carlo runs) filter outputs. We use the comparisons between power spectra of the ensemble average and the outputs of both the ACF- and the TOC-based approaches for the performance evaluation. For the computation of the power spectrum, 2048-fast Fourier transform is used. Fig. 2(b) shows the normalized powers spectrum of the noise-free EP signal.
(a)
(b) Fig. 1. Example 1: (a), a simple noise-free time series, and (b), the autocorrelation-function, dashed-line; and the TOC function, solid-line.
Fig. 2(c) and (d) shows, respectively, the time function and the normalized power spectrum of the additive noise when is colored Gaussian with SNR 5.0 dB. Fig. 2(e) and (f) shows, respectively, the noisy EP and its normalized is colored power spectrum for exemplary realization when 5.0 dB. It is obvious that the level Gaussian with SNR of the white noise is about 20.0 dB while the level of the colored noise is about 0.0 dB. Simulations results of this example are shown in Fig. 3(a)–(g) for the Gaussian noise case. The filter order associated with the ACF- and the TOC-based 32. Investigating the power spectrum approaches was of the output of the ACF-based filter shown in Fig. 3(d) and that of the TOC-based filter shown in Fig. 3(f) confirms the strong influence of the colored noise on the ACF-based filter. It is apparent that the ensemble averaging approach provides about 20.0 dB reduction for both the white and colored noises. However, both the ACF- and the TOC-based filters provide about 40.0 dB reduction for the white noise. The TOC-based filter provides 35.0 dB reduction for the colored noise while the ACF-based one provides only 20.0 dB. Therefore, for the colored Gaussian noise case, in comparison with the ensemble averaging approach as a standard one, the ACF- and the TOC-based approaches provide 0.0 dB and 15.0 dB improvement, respectively. Summary of these improvements are shown 32 and 64. in Table I for different SNRs and for It is obvious that when the SNR is 10.0 dB the ensemble averaging approach is better than the ACF-based approach while the TOC-based one is better than the ensemble averaging approach. Increasing the filter order of the TOC-based approach does not achieve essential improvement when the SNR is less than or equal to 5.0 dB. It is also apparent that the TOC-based approach outperforms the correlation-based one by more than 10.0 dB. Example 3: In this example, the noise-free EP signal model given in Fig. 4(a) is used. The order of both the ACF- and TOC-based filters is taken 28. Fig. 4(b) shows the noisy EP
506
IEEE TRANSACTIONS ON BIOMEDICAL ENGINEERING, VOL. 48, NO. 5, MAY 2001
(a)
(b)
(c)
(d)
(e)
(f)
Fig. 2. Example 2 for colored Gaussian noise: (a), the noise-free EP signal model; (b), the power spectrum of the noise-free EP signal; (c), the additive noise; (d) the power spectrum of the additive noise; (e), the noisy EP signal and (f), the power spectrum of the noisy EP.
signal when the noise is colored Gaussian with SNR 5.0 dB. Fig. 4(c) and (d) shows, respectively, the ensemble average and its power spectrum. Fig. 4(e) and (f) shows, respectively, the output and its spectrum of the ACF-based approach. Fig. 4(g) and (h) shows, respectively, the output and the spectrum of the TOC-based approach. It is obvious that the presented filtering approach performs very well and outperforms both the ACFbased and the ensemble averaging approaches. It is also apparent that both the ensemble averaging and the ACF-based approaches provide the same noise reduction for the colored noise. For the white noise, both the TOC- and the ACF-based approaches provide about 20.0-dB noise reduction more than the ensemble averaging approach. From Fig. 4(i), it is apparent that the ACF-based filter spectrum reflects not only the EP signal but also the colored Gaussian noise. Table II shows the correlation coefficient between the noise-free EP and the estimated one using both the ACF- and TOC-based approaches for different SNRs and filter orders. It is obvious that the proposed TOC-based filter provides better correlation coefficient values than the ACF-based one. Especially, we should use the TOCbased approach when the SNR is less 5.0 dB. Example 4: In this example, the third EP signal model is used. Fig. 5(a) shows the noise-free EP while Fig. 5(b) shows the noisy EB signal when the noise is colored uniformly disdB. The filter order of both the tributed with SNR
ACF- and the TOC-based approaches is 32. Fig. 5(c) shows the ensemble average. Fig. 5(d) and (e) shows, respectively, the outputs of both the ACF-based approach and the TOC-based approach. It is obvious that the TOC-based approach outperforms both the ensemble averaging and the ACF-based approaches. Also Fig. 5(f), which shows the spectra of both filters, confirms the efficient performance of the TOC-based approach. Adaptive Filtering: Example 5: In this example, we apply both the TOC- and the ACF-based adaptive filtering approaches to the noisy observed of the quasi-periodic EP given in Fig. 6(a). The sampling rate is also 6 kHz. For the generation of the noisy version shown in Fig. 6(b), the SNR is taken 0.0 dB. We have examined filter orders of 32 and 64. The forgetting factor is taken 0.9995. We have started from zero initial settings. Results of this example are depicted in Fig. 6 for the Gaussian noise case. Comparing the outputs of the outputs of both adaptive filters shows that the TOC-based adaptive filter outperforms the ACF32 and 64. This is also confirmed based one for both by the spectra of both filters given in Fig. 6(g) and (h) computed 1250 ms). The after the end of the adaptation process (i.e., same performance of both approaches has been obtained for the uniformly distributed noise case and its illustrations have been omitted to prevent number of figures from being too much. It is worthwhile to mention that both approaches provide different
GHARIEB AND CICHOCKI: NOISE REDUCTION IN BRAIN EPs
507
(a)
(b)
(c)
(d)
(e)
(f)
Fig. 3. Example 2 for colored Gaussian noise (continued): (a), the ensemble average; (b), the power spectrum of the ensemble average; (c), the output of the ACF-based filter; (d), the power spectrum of the output of the ACF-based filter; (e), the output of the TOC-based filter; (f), the power spectrum of the output of the TOC-based filter; (g), the power spectrum of the ACF-based (dashed-line) and the TOC-based (solid) filters. TABLE I THE SNR IMPROVEMENT (dB) OF BOTH THE TOC- AND THE ACF-BASED FILTERING APPROACHES IN COMPARISON WITH THE ENSEMBLE AVERAGING APPROACH
amplitude gain and the unity skewness gain adjustment can be applied online. Experimental Results: We have applied the proposed TOCand the ACF-based filtering approaches to real world data
obtained from a subject to exhibit somatosensory EPs (SEPs) waveform. Fig. 7(a) shows the noisy observed SEP for a single of trial. The sampling frequency is 5.32 kHz. The order the batch filters of both approaches has been adjusted to 48.
508
IEEE TRANSACTIONS ON BIOMEDICAL ENGINEERING, VOL. 48, NO. 5, MAY 2001
Fig. 4. Example 3 for colored Gaussian noise: (a), the noise-free EP signal, (b), the noisy EP signal; (c), the ensemble average; (d), the power spectrum of the ensemble average; (e), the output of the ACF-based filter; (f), the power spectrum of the output of the ACF-based filter; (g), the output of the TOC-based filter; (h), the power spectrum of the TOC-based filters and (i), the power spectrum of the ACF-based (dashed-line) and the TOC-based (solid) filters.
Fig. 7(b) and (c) shows, respectively, the outputs of both the ACF- and the TOC-based filtering approaches, respectively.
It is obvious that both approaches provide the same shape for the SEP. However the TOC-based filtering approach provides
GHARIEB AND CICHOCKI: NOISE REDUCTION IN BRAIN EPs
509
TABLE II THE CORRELATION COEFFICIENT OF BOTH THE TOC- AND THE ACF-BASED FILTERING APPROACHES
Fig. 5. Example 4 for colored uniformly distributed noise: (a), the noise-free EP signal, (b), the noisy EP signal; (c), the ensemble average; (d), the output of the ACF-based filter; (e), the output of the TOC-based filter; (f), the power spectrum of the ACF-based (dashed-line) and the TOC-based (solid) filters.
better SNR enhancement than the ACF-based approach. Results of another single trial are shown in Fig. 8. These results confirm that in addition to the proposed TOC-based
filtering approach recovers the same shape as the conventional ACF-based filtering approach, it provides usually better SNR enhancement.
510
IEEE TRANSACTIONS ON BIOMEDICAL ENGINEERING, VOL. 48, NO. 5, MAY 2001
Fig. 6. Example 5 (adaptive approach) for colored Gaussian noise: (a), the noise-free EP signal; (b), the noisy EP signal; (c), the output of the ACF-based adaptive filter for P 32; (d), the output of the ACF-based adaptive filter for P 64; (e), the output of the TOC-based adaptive filter for P 32; (f), the output of the TOC-based adaptive filter for P 64; (g), the power spectrum of the ACF-based (dashed-line) and the TOC-based (solid) adaptive filters for P 32 and (h), the power spectrum of the ACF-based (dashed-line) and the TOC-based (solid) adaptive filters for P 64.
=
=
=
VI. CONCLUSION In this paper, we have used higher order statistics, specifically the TOCs in formulating fixed and adaptive filtering techniques to reduce noise corrupting the brain EP. Employing TOCs makes the presented technique be capable of reducing symmetrically distributed noise (white or colored). Moreover, the TOC-based filtering approach can be applied to either averaged or nonaveraged EP observation data. In the nonaveraged data case, the approach enables us to investigate the latency and amplitude changes. Simulation results have shown that the presented technique performs well in handling white noise and colored
=
=
=
noise whose spectrum is not overlapped with the signal spectrum. In the signal-noise spectrum overlapped case, filtering is not the appropriate technique for noise reduction. However in this case, the spectrum of the presented filtering technique provides an estimate of the noise-free EP spectrum. It can be mentioned that the presented technique is highly efficient in detection problem. This is because the output will be completely zero when the input is only symmetrically distributed noise. The presented TOC-based filtering approach can be extended to the fourth-order cumulants. Such extension will be beneficial if the EP signal has either weak or identically zero TOCs.
GHARIEB AND CICHOCKI: NOISE REDUCTION IN BRAIN EPs
Fig. 7. Results of the first trial for a real world SEP example; (a), the noisy observed SEP signal; (b), the output of the ACF-based filter; and (c), the output of the TOC-based filter; the order of both filters P 48.
=
REFERENCES [1] C. A. Vaz and N. V. Thakor, “Adaptive Fourier estimation of time-varying evoked potentials,” IEEE Trans. Biomed. Eng., vol. 36, pp. 448–455, Apr. 1989. [2] N. V. Thakor et al., “Orthogonal (Fourier and Walsh) models of time varying evoked potentials in neurological injury,” IEEE Trans. Biomed. Eng., vol. 40, pp. 213–212, Mar. 1993. [3] P. G. Madhavan, “Minimal repletion of evoked potentials by modified adaptive line enhancement,” IEEE Trans. Biomed. Eng., vol. 39, pp. 760–764, July 1992. [4] R. J. Sclabassi and R. K. Harper, “Laboratory computers in neurophysiology,” Proc. IEEE, vol. 61, pp. 1602–1614, Nov. 1973. [5] C. E. Davila and M. S. Mobin, “Weighted averaging of evoked potentials,” IEEE Trans. Biomed. Eng., vol. 39, pp. 338–347, Apr. 1992. [6] B. Upshaw, M. Rangoussi, and T. Sinkjaer, “Detection of human nerve signals using higher order statistics,” presented at the 8th IEEE Signal Processing Workshop, Corfu, Greece, June 24–26, 1996. [7] E. B. Moody, E. Micheli-Taznakou, and S. Chokroverty, “An adaptive approach to spectral analysis of pattern-reversal visual evoked potential,” IEEE Trans. Biomed. Eng., vol. 36, pp. 439–447, Apr. 1989. [8] M. H. Jacobs, S. S. Rao, and G. V. Jose, “Parametric modeling of somatosensory evoked potentials,” IEEE Trans. Biomed. Eng., vol. 36, pp. 392–403, Mar. 1989. [9] D. Liberati, S. DiCorrado, and S. Mandelli, “Topographic mapping of single sweep evoked potential in the brain,” IEEE Trans. Biomed. Eng., vol. 39, pp. 943–951, Sept. 1992.
511
Fig. 8. Results of the second trial for the real world SEP example; (a), the noisy observed SEP signal; (b), the output of the ACF-based filter; and (c), the output of the TOC-based filter; the order of both filters P 48.
=
[10] M. Nakmura, H. Shibasaki, S. Nishida, and R. Neshige, “A method for real-time processing to study recovery functions of evoked potentials,” IEEE Trans. Biomed. Eng., vol. 37, pp. 738–740, July 1990. [11] C. E. Davila, R. Srebro, and I. A. Ghaleb, “Optimal detection of visual evoked potential,” IEEE Trans. Biomed. Eng., vol. 45, pp. 800–803, June 1998. [12] T. F. Collura, “Real-time filtering for the estimation of steady state visual evoked potentials,” IEEE Trans. Biomed. Eng., vol. 37, pp. 650–652, June 1990. [13] P. Laguna et al., “Adaptive filter for event-related bioelectrical signals using an impulse correlated reference input: Comparison with signal averaging techniques,” IEEE Trans. Biomed. Eng., vol. 39, pp. 1032–1044, Oct. 1992. [14] T. Ning and J. D. Bronzino, “Bispectral analysis of the rat EEG during various vigilance states,” IEEE Trans. Biomed. Eng., vol. 36, pp. 497–499, Apr. 1989. [15] J. Mthuswamy, D. L. Sherman, and N. Thakor, “Higher order spectral analysis of burst patterns in EEG,” IEEE Trans. Biomed. Eng., vol. 46, pp. 92–99, Jan. 1999. [16] M. J. Hinich, “Detecting transient signal by bispectral analysis,” IEEE Trans. Acoust. Speech Signal Processing, vol. 38, pp. 1277–1283, July 1990. [17] B. M. Sadler, G. Giannakis, and K. Lii, “Estimation and detection in non Gaussian noise using higher order statistics,” IEEE Trans. Signal Processing, vol. 42, pp. 2729–2740, July 1994.
512
[18] C. L. Nikias and A. P. Petropulu, Higher Order Spectral Analysis: A Nonlinear Signal Processing Framework. Englewood Cliffs, NJ: Prentice-Hall, 1993. [19] J. M. M. Anderson, G. B. Giannakis, and A. Swami, “Harmonic retrieval using higher order statistics: A deterministic formulation,” IEEE Trans. Signal Processing, vol. 43, pp. 1880–1889 , 1994. [20] R. R. Gharieb, “New results on employing cumulants for retrieving sinusoids in colored non-Gaussian noise,” IEEE Trans. Signal Processing, vol. 48, pp. 2164–2168, July 2000. , “Higher order statistics-based IIR notch filtering scheme for en[21] hancing sinusoids in colored noise,” Inst. Elect. Eng. Proc.-Vis., Image. Signal Processing, vol. 147, pp. 115–121, Apr. 2000. [22] R. R. Gharieb, Y. Horita, and T. Murai, “Retrieving sinusoids in colored Raleigh noise by a cumulant-based FBLP approach,” in Proc. ICASSP’2000, Istanbul, Turkey, June 2000, pp. 741–744. [23] H. M. Ibrahim, R. R. Gharieb, and M. M. Hassan, “A higher order statistics-based adaptive algorithm for line enhancement,” IEEE Trans. Signal Processing, vol. 47, pp. 527–531, Feb. 1999. [24] T. Demiralp, A. Ademoglu, Y. Istefanopulos, and H. O. Gulcur, “Analysis of event-related potential (ERP) by damped sinusoids,” Biol. Cybern., vol. 78, pp. 487–493, 1998. [25] R. Kumaresan and D. Tufts, “Estimating the parameters of exponentially damped sinusoids and pole-zero modeling in noise,” IEEE Trans. Acoust. Speech Signal Processing, vol. ASSP-30, pp. 833–840, Dec. 1982. [26] S. V. Vaseghi, Advanced Signal Processing and Digital Noise Reduction. New York: Wiley & Teubner, 1996. [27] A. Cichocki, J. Karhunen, W. Kasprzak, and R. Vigario, “Neural networks for blind separation with unknown number of sources,” Neurocomputing, vol. 24, pp. 55–93, 1999. [28] A. Cichocki, S. A. Vorobyov, and T. Rutkowski, “Nonlinear interference cancellation using neural networks,” in Proc. 1999 Int. Symp. Nonlinear Theory and its Applications, Nov. 28–Dec. 2, 1999, pp. 1005–1008. [29] O. Jahn, A. Cichocki, A. Ioannides, and S. Amari, “Identification and elimination of artifacts from MEG signals using efficient independent components analysis,” in Recent Advances in Biomagentism. Sendai, Japan: Tohoku Univ. Press, 1999, pp. 224–227. [30] A. Cichocki and S. Vorobyov, “Application of ICA for automatic noise and interference cancellation in multisensory biomedical signals,” in Proc. 2nd Int. Workshop ICA and BSS, ICA-2000, Helsinki, Finland, June 19–22, 2000, pp. 63–68.
IEEE TRANSACTIONS ON BIOMEDICAL ENGINEERING, VOL. 48, NO. 5, MAY 2001
[31] N. Ahmed and S. Vijayendra, “An algorithm for line enhancement,” Proc. IEEE, vol. 70, pp. 1459–1460, 1982.
R. R. Gharieb (M’00) received the B.Sc, M.Sc., and Ph.D degrees all in electrical engineering from Assiut University, Assiut, Egypt, in 1985, 1993 and 1997 respectively. From 1988 to 1997, he was at the Faculty of Engineering, Assiut University working as an Assistant Lecture. Since 1997, he has been a Lecturer. From July 1999 to January 2000, he was a Post Doctoral Fellow with the Faculty of Engineering, Toyama University, Toyama, Japan. Since January 2000, he has been a Scientist with Laboratory for Advanced Brain Signal Processing, RIKEN Brain Science Institute, Wako-Shi, Saitama, Japan. His research interests include adaptive filters, statistical signal processing, and higher order statistics.
Andrzej Cichocki (M’96) received the M.Sc. (with honors), Ph.D., and Habilitate Doctorate (Dr.Sc.) degrees, all in electrical engineering, from Warsaw University of Technology, Warsaw, Poland, in 1972, 1975, and 1982, respectively. Since 1972, he has been with the Institute of Theory of Electrical Engineering and Electrical Measurements at the Warsaw University of Technology, where he became a full Professor in 1991. He is the co-author of two books and more than 150 scientific papers. He spent a few years at University Erlangen, Erlangen, Germany, as Alexander Humboldt Research Fellow and Guest Professor. He is currently working in Brain Science Institute RIKEN, Wako-Shi, Saitama, Japan, as a Head of Laboratory for Advanced Brain Signal Processing. More details about his research can be found at: http://www.bsp.brain.riken.go.jp