Accordingly, the scale parameter of a scale- space representation corresponds to the âtimeâ parameter of its generating PDE, and so the parameter t will be.
Non-linear Scale-Selection for Image Compression Improvement Obtained by Perceptual Distortion Criteria Iván Kopilovic University of Veszprém, Department of Image Processing and Neurocomputing, H-8200 Veszprém, Egyetem u. 10., Hungary
Tamás Szirányi University of Veszprém, Department of Image Processing and Neurocomputing and Analogical and Neural Computing Laboratory, Comp. & Automation Inst., Hungarian Academy of Sciences, H-1111 Budapest, Kende u. 13-17., Hungary
Abstract The effect of linear and non-linear diffusions prior to Joint Photographic Experts Group’s (JPEG) standard baseline compression is analysed and compared. We shall show that anisotropic diffusion acts as an adaptive filtering that extracts and preserves the important visual information, and it will be shown how it can be used as a preprocessing method for compression artefact reduction. The selection of the appropriate preprocessing parameters at a specified bit rate greatly reduces the compression artefacts. The selection criteria were determined using a perceptual error metric based on a model of the human visual system.
1. Introduction Application of the non-linear scale-space theory to non-recoverable, low bit rate image compression will be presented. The method discussed was first proposed in [18] as an improvement on the JPEG baseline coding standard [13]. Compression enhancement methods range from simple preliminary smoothing to more sophisticated methods involving quantizer design [4] or postprocessing [10,15]. Smoothing entails the loss of edge information, at postprocessing the data is already corrupted. Other methods call for change in the compression standard. In contrast to these methods, we have introduced a preprocessing step [18] performed before coding that will reduce the artefacts while avoiding the loss of information on “important” edges, and which involves no changes in the standard coding and decoding scheme. It is based on
adaptive filtering achieved by non-linear diffusion processing. A unified framework for a number of nonlinear diffusion equations is the non-linear scale-space theory. Within this context we shall consider the most important diffusion equations found in literature. Throughout this work, a perceptual error metric [9] was used as a quality criterion. Using this metric, we shall establish a selection rule for the parameters of the preprocessing to achieve the best compression quality for a given bit rate.
2. Scale-space and adaptive filtering Perceptually adaptive filtering will mean suppression of noise and enhancement of edge information. In many applications, small details and textured regions do not influence the overall content of the image, and therefore they are considered to be noise at a given resolution. This assumption is reasonable, since at low bit rates textured regions facilitate the appearance of compression artefacts. An adaptive filter should remove the noise completely in uniform regions and perform directional filtering along the edges (shape enhancement), but it should exclude filtering across the edges. A unified mathematical framework for these operators is the non-linear scale-space theory [7,11,14]. It represents the extraction of information as a series of operations. We can model this as a family (T(t))t≥0 of operators acting on images. Each operator corresponds to a level of abstraction or the compactness of information representation. The greater the parameter t is, the more details will be omitted. The level of abstraction is called the scale of the representation, and the family (T(t))t≥0 is called a scale-
space representation. Some natural assumptions can be made on these operators. These are simple properties that an information extraction operation is expected to verify: translation invariance, non-creation of details, recursive structure, local (differential) nature. The fundamental result of the theory is that the certain class of scale-space representations verifying the above assumptions is generated by (non-linear) diffusion-like partial differential equations (PDEs), and conversely, a wide class of PDEs generates a scale-space representation [7,6,11]. Accordingly, the scale parameter of a scalespace representation corresponds to the “time” parameter of its generating PDE, and so the parameter t will be termed the “diffusion parameter” or the “scale” interchangeably. The most important PDEs in this respect that are found in the literature are listed in Table 1. Parameter t is expressed in degrees of visual angle, but we shall express it in a dimension free form t (t 0 ) = p 2 t 0 , where t0 is the diffusion parameter and p is the pixels/degree value for a specific display setting. Parameter t obtained this way will be called the relative diffusion. For PMC-AD and NLI-AD the term Gs ∗ f (Table 1) was computed with linear diffusion, and therefore we shall call it the pre-diffusion [2] term with parameter s.
3. The perceptual error metric The perceptual error metric found in [9] was used in the experiments to compare and evaluate the compression results, which is motivated by the well known fact that pixel-by-pixel based distortion measures fail to give correct assessment. The error metric accounts for several mechanisms of the human visual system. These are
basically the contrast sensitivity and the frequency/orientation pattern masking. For further reference on these phenomena and their application see [9] or [12] where some basic methods are reviewed. The input of the algorithm is the viewing parameters (Table 3) and the two images to be compared. The reference image serves as a background for the error image. Original and the error image are decomposed into orientation and spatial frequency bands with Gabor-like filters, a model for the response of the cell in the visual cortex [5]. For each band the effect of masking and contrast sensitivity is computed to weigh the error coefficients. The error obtained will be called perceptually masked error, and we shall denote it by E. It can be expressed in a logarithmic form called the masked peak signal to noise ratio and is computed as MPSNR ( f , g ) = 20 log10 (1 / E ( f , g ) ) , where f and g are two images [9]. We shall also use a subjective image quality assessment scale shown in Table 2. It can be obtained with the formula −1 Q( f , g ) = 5(1 + 159.5E ( f , g ) ) [9]. We use the distortion measurement algorithm with parameter settings contained in Table 3.
5. The preprocessing algorithm Most of the compression methods result in unrealistic, sometimes annoying artefacts at low bit rates. JPEG has a characteristic blocking-artefact (Figures 1,2,3 and 6). PDEs of Table 1 were tested as perceptually adaptive filters for compression artefact reduction in [8]. The adequate perceptually adaptive filter fell out to be the PMC-AD, since it suppresses noise while performing shape enhancement. It preserves edge information and gives the best results in terms of perceptual error metric.
Table 1 Diffusion equations used in image processing. The general form of the equations is ∂ 1 u (t , x) = F (u (t ,⋅))( x) , where t>0,
(
)
x∈R2. The Gaussian kernel with parameter s is denoted by Gs ( x) = ( 4πs ) −1 exp ( 4 s) −1 � x, x� , x in R2.
Linear Diffusion (LD)
F ( f ) = div(grad f )
Perona – Malik – Catté Anisotropic Diffusion (PMCAD) Non-linear Isotropic Diffusion (NLID)
F ( f ) = div g � ( grad(G s ∗ f ) ) grad f
Pure Anisotropic Diffusion (P-AD)
(
g = exp� �� − K −1 id R �
�
4 2
�
�
)
, K>0.
F ( f ) = g � ( grad(G s ∗ f ) ) div(grad f ) , g is the same as above.
F( f ) = � D2 f
grad ⊥ f grad ⊥ f , � , grad f grad f
grad ⊥ f = (−∂ 2 f , ∂ 1 f )
Isotropic, linear, non-adaptive, equivalent to low-pass Gaussian filtering, TF (t ) f = u f (t ,⋅) = Gt ∗ f . See [11]. Anisotropic, non-linear, edge-adaptive. Diffusion is anisotropically inhibited at edges by function g, depending on their strenght (magnitude of the gradient). The role of Gs is to reduce noise sensitivity. Enhances the shape of objects, maintains the edgeinformation and supresses noise. See [14] and [2]. Non-linear, isotropic, edge-adaptive. Diffusion is inhibited isotropically by g and therefore the shape enhancement is poor. The role of Gs is the same as for PMC-AD. Simple implementation. Proposed in [17]. Non-linear, anisotropic, edge-adaptive. Diffusion is purely anisotropic, diffusion takes place only in the direction of edges and not across them. Useful for shape enhancement. Low noise supression. See [7]. (D2f denotes the second derivative of f.).
Table 2 The subjective image quality assessment scale [3]. The corresponding masked error values are given. Q Impairment
Grade
5 4 3 2 1
Excellent Good Fair Poor Bad
Imperceptible Perceptible,not annoying Slightly Annoying Annoying Very Annoying
MPSNR (dB) ∞ 56 47.5 40.5 32
Masked Error(E) 0 1.5⋅10-3 4.3⋅10-3 9.4⋅10-3 2.5⋅10-2
Table 3 Viewing configurations used for image distortion measurements. Viewing distance (m) Pixels/inch Pixels/degree Pixel size (deg)
Computer Display (CD) 0.5 72 24.74 0.04042
HDTV 1.8 48 60.32 0.01658
Accordingly, we shall use AD instead of PMC-AD and (T(t))t≥0 will denote the scale-space representation corresponding to it. Now, we shall determine the adequate parameterisation of the AD preprocessing. We set two criteria for a good performing image quality enhancement. As first, it should not affect the original information content of the image. As second, it
should eliminate the formation of compression artefacts. These two constraints are contradictory and a compromise must be obtained. Let us keep in mind the following process: Image
AD
u0
→
Diffused image T(t)u0
Compression at bit rate c, Reconstruction →
Reconstructed image Cc(T(t)u0)
Motivated by the above ideas, we introduce two characteristic features of a compression algorithm relative to a fixed adaptive filter (T(t))t≥0, the perceptual scale and the scale capacity. Perceptual scale of the compression at bit rate c is t p (c) = sup{t ≥ 0 | E[C c (T (t )u o ), u o ] < E[C c (u o ), u o ] + ε 0 (c)} where c is the bit rate, Cc is the compression/reconstruction operator at bit rate c, u0 is the image, and ε0(c) is a specified error tolerance. This refers to the maximal scale, i.e. the maximal loss of details, which remains imperceptible at the given bit rate. If the noise is removed adaptively with AD, the formation of artefacts is avoided, but certain information is lost as well. Perceptual scale is the scale at which AD begins to corrupt those details that belong to the essential visual content of the image, and the difference becomes “visible” for the perceptual distortion measuring algorithm. The error tolerance was 1%.
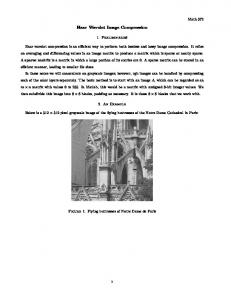
(a) JPEG 0.3 bits/pixel MPSNRCD = 48.56 dB MPSNRHDTV = 52.57 dB
(b) AD preprocessed JPEG 0.3 bits/pixel MPSNRCD = 48.53 dB MPSNRHDTV = 52.93 dB
(c) JPEG 0.2 bits/pixel MPSNRCD = 45.5 dB MPSNRHDTV = 48.13 dB
(d) AD preprocessed JPEG 0.2 bits/pixel MPSNRCD = 47.18 dB MPSNRHDTV = 50.96 dB
Figure 1 Compression results for test image Barbara and the corresponding edge maps. Diffusion parameter was chosen according to the scale selection curve. Edge maps were generated with Sobel’s method. If h is the size of the image in the paper then images should be observed from a distance of d=6.75h for the HDTV case and from d=2.768h for the computer display.
formation of artefacts is not significant any more. This scale is the scale capacity of the compression algorithm. For error level we have chosen the masked error equivalent for grade 4 of the CCIR scale (E=1.5⋅10-3) of Table 3. According to these observations, we conclude that a reasonable scale-selection range for a bit rate c is t κ (c) ≤ t (c) ≤ t p (c) . It remains to determine the values t κ (c) and t p (c) for all bit rates c. (a) Original
To determine this functional dependency, numerical experiments were performed. Three standard test images were considered: Barbara (Figure 1), Lena (Figure 2) and Golden hill (Figure 3). Each of the images were compressed to three different bit rates after diffusion with variable scale parameter, and the compression error was measured in terms of perceptually masked error (E). AD was run with fixed values of K and pre-diffusion parameter (K=0.3, s=1.5).
(b) JPEG MPSNRCD = 53.51 dB MPSNRHDTV = 56.94 dB
(c) JPEG with AD preprocessing MPSNRCD = 53.95 dB MPSNRHDTV = 57.42 dB
Figure 2 Detail of Lena, its JPEG compressed versions and the result of AD preprocessing. Bit-rate is 0.25 bits/pixel. Diffusion parameter was chosen according to the scale selection curve. Edge maps were obtained with Sobel’s method. If h is the size of the image in the paper then images should be observed from a distance of d=11.14h for the HDTV case and from d=4.56h for the computer display case. MPSNR values are indicated (CD = computer display).
Scale capacity of the compression at bit rate c is defined as tκ (c) = inf{t ≥ 0 | E[Cc (T (t )uo ), T (t )uo ] < ε 1} , where Cc is the compression/reconstruction operator at bit rate c, u0 is the original image and ε1 is a specified error level. Scale capacity is thus the smallest scale at which the compression algorithm operates below a specified error level on the preprocessed image. For images processed with smaller scale than tκ (c) , compression will give rise to undesirable error. At a fixed compression rate, there is a scale above which the
(a) Original
(b) JPEG (c) JPEG with AD MPSNRCD=53.51dB MPSNRCD=53.95dB MPSNRHDTV=56.94dB MPSNRHDTV=57.42dB
Figure 3 Detail of Goldhill, its JPEG compressed versions and the result of AD preprocessing. Bit-rate is 0.25 bits/pixel. Diffusion parameter was chosen according to the scale selection curve. Edge maps were obtained with Sobel’s method. If h is the size of the image on the paper then images should be observed from a distance of d=10h for the HDTV case and from d=24h for the computer display case. MPSNR values are indicated (CD = computer display).
Error measurements were performed for two viewing conditions: HDTV and computer display (CD) (Table 3). Results for image Lena for the HDTV case is shown in Figure 4, column 1. Edge-maps of images were compared too (Figure 4, column 2).
Masked error
Masked error for edge-maps 75
75
70 MPSNR (dB)
MPSNR (dB)
70 65 60 55
65 60 55 50
50
45
45 0
0.5
1
1.5
2
2.5
3
3.5
4
4.5
5
0 0.5
1 1.5
Relative diffusion (t)
AD processed image v. original……………E[T(t)u0,u0] JPEG of AD processed image v. original….E[JPEG(T(t)u0),u0] LD processed image v. original……………E[S(t)u0,u0]
2 2.5
3 3.5
4 4.5
5
Relative diffusion (t)
JPEG of LD processed image v. original…E[JPEG(S(t)u0),u0] JPEG of AD processed image v. AD processed image………………………E[JPEG(T(t)u0), T(t)u0]
Figure 4 Perceptually masked errors (in terms of MPSNR) for test image Lena, and its edge-maps as a function of scale with HDTV configuration, at different bit rates. Evidently, linear diffusion (denoted by triangles) is outperformed by AD (denoted by squares). Results for edge-maps show that LD corrupts, while AD tends to preserve edges. Strong edges are very important constituents of the visual content of an image. The parameters of PMC-AD were the following: K=0.1, n=4, s=0.35. The compression bit-rate is 0.32 bits/pixel.
6. Conclusion We have shown that a scale-space representation generated by an anisotropic diffusion can be used to enhance JPEG compression and prevent the formation of artefacts. Using perceptual distortion measurement
algorithm that simulates a human observers assessment, a scale-selection strategy was presented for different bit rates of compression. It was shown that AD is a better means of pre-processing than ordinary smoothing (LD) both with respect to perceptual error metric and edge-adaptivity. The preprocessing method requires no change in the standard decoding algorithm and provides image quality enhancement for low bit rate lossy image compression, which is sometimes an essential issue, if there are transmission or storage constraints. Similar result were obtained for wavelet coding [8]. 10 9
Computer display
8
Relative diffusion
These results show clearly, that AD outperforms LD (smoothing) both in terms of perceptual error and edgeadaptivity. By averaging results for the three images, overall tendency of the error was obtained, which was used to determine functions tp and tκ for computer display and HDTV configuration, and the scale-selection ranges lying between these two curves. Putting together the curves obtained for HDTV and computer display configuration, we were able to select a scale-selection function with values falling into both scale-selection ranges, in this way we obtained a scale-selection rule valid through a wider range of viewing conditions. In Figure 5 scale-selection ranges are shown, with their intersection (general scaleselection range) and the scale-selection function. Snapshots of compression results for test images together with the edge-maps are shown through Figures 1, 2, 3 and 6. Note that the edge-maps of AD pre-processed images are “cleaner” and contain less noise. The difference between LD and AD is, that in the latter case image information is filtered inadaptively, while in the former case it is performed in an adaptive way. We have thus established a scale-selection rule for AD preprocessing, and in one hand, we have seen that AD gives significantly better results than a simple smoothing in the preprocessing step.
HDTV
7 6
Scale-selection range
5
Scale-selection curve
4 3 2 1 0 0.1
0.15
0.2
0.25
0.3
0.35
0.4
0.45
0.5
Bit rate (bit/pixel)
Figure 5 Scale-selection ranges for computer display and HDTV configuration, and the general scaleselection range with the scale-selection function. The scale-selection function is of the form t (c ) = ac exp(bc) , where c is the bit-rate, a = 0.0102 and b = 0.062.
[2]
Acknowledgements Special thanks are due to Stefan Winkler and Christian Lambrecht and the Signal Processing Laboratory (LTS) of EPFL (Lausanne) for the HVS-based distortion measuring software [9] supported for us for testing. This work was supported by the Hungarian Research Fund (OTKA) and by the Swiss Research Fund (No. 7UNPJ048236).
[3]
[4]
[5]
[6] [7]
(a) Original
[8]
[9]
[10]
(b) JPEG MPSNRCD = 44.31 dB MPSNRHDTV = 47.29 dB
[11] [12]
[13] [14]
[15] (c) JPEG with AD preprocessing MPSNRCD = 44.56 dB MPSNRHDTV = 47.55 dB
Figure 6 Detail of Bridge, its JPEG compressed versions and the result of AD preprocessing. Bit-rate is 0.25 bits/pixel. Diffusion parameter was chosen according to the scale selection curve. Edge maps were obtained with Sobel’s method. If h is the size of the image on the paper then images should be observed from a distance of d=6.43h for HDTV and from d=15.7h for computer display.
[16]
[17]
[18]
References [1]
Al-Shaykh, O. K., Mersereau, R. M.: Lossy Compression of Noisy Images, IEEE Trans. on Image Proc.,Vol.7., No.12., 1998, pp. 1641-1652
[19]
Catté, F., Coll, T., Lions, P. L. and Morel, J. M.:Image selective smoothing and edge detection by nonlinear diffusion, SIAM J. Numerical Anal., 1992, Vol. 29, pp.182193 CCIR, ”Method for the Subjective Assessment of the Quality of Television Pictures”,13th Plenary Assembly, Recommendation 500,Vol.11,pp.65-68,1974 Crouse, M., Ramchandran, K.: Joint Thresholding and Quantizer Selection for Transform Image Coding: EntropyConstrained Analysis and Application to Baseline JPEG, IEEE Trans. on Image Proc.,Vol.6., No.2., 1997, pp. 285297 Daugman, J. G.: Two-dimensional Spectral Analysis of the Cortical Receptive Field Profiles, Vision Research, Vol. 24, 1980, pp. 891-910 Florack, L.: Image Structure, Kluwer Academic Publishers, 1997 Guichard, F., Morel, J., Partial Differential Equations and Image Iterative Filtering, State of the Art in Numerical Analysis, Oxford University Press, 1997. Kopilovic, I., Szirányi, T.: Image structure preserving of lossy compression in the sense of perceptual distortion when using anisotropic diffusion preprocessing, FSPIPA’99, IAPR, Budapest, Hungary, 6-7 Sept. 1999. Lambrecht, C. J. B., Verscheure, O.: Perceptual Quality Measure Using a Spatio - Temporal Model of the Human Visual System, Proceedings of SPIE,V.2668,pp.450461,San Jose, CA, 1996. Lee,Y.,L., Kim, H., C., Park, H., W.: Blocking Effect Reduction of JPEG Images by Signal Adaptive Filtering, IEEE Transactions on Image Processing, Vol.7, No.2, 1998, pp.229-234 Lindeberg, T., Haar Romeny, B. M.: Linear scale-space III, Geometry - Driven Diff. In Computer Vision, Kluwer Academic Publishers , 1992, pp.1-72 Malo, J., Pons, A. M., Artigas, J. M.: Subjective image fidelity metric based on bit allocation of the human visual system in the DCT domain, Image and Vision Computing, 1997, pp. 535-548 Pennebaker, W. B., Mitchell, J. L. : JPEG Still Image Data Compression Standard, Van Nostrand Reinhold, 1993 Perona, P., Shiota, T., Malik, J.: Anisotropic Diffusion, Geometry - Driven Diff. In Computer Vision, Kluwer Academic Publishers , 1992, pp.73-92 Prost, R., Baskurt, A.: JPEG Dequatisation Array for Regulatized Decompression, IEEE Trans. on Image Proc.,Vol.6., No.6., 1997, pp. 883-888 Rosenholtz, R., Watson, A. B.: Perceptual adaptive JPEG coding, Proc. IEEE Int.Conf. on Image Processing, Vol. 1, 1996, pp. 901-904 Roska, T., Szirányi, T.: Classes of Analogic CNN Algorithms and Their Practical Use in Complex Processing, Proc. IEEE Non-linear Signal and Image Proc. June,1995, pp.767-770 Szirányi, T., Kopilovic, I., Tóth, B. P.: Anisotropic Diffusion as a Preprocessing Step for Efficient Image Compression, Proceedings of the 14th ICPR, Brisbane, IAPR, Australia, August 16-20, 1998, pp. 1565-1567 JPEG Group's CJPEG, v 6a, JPEG Group's DJPEG, v 6a, Copyright (C) 1996, Thomas G. Lane