MEMS TOC Proceedings of IMECE2002 ASME International Mechanical Engineering Congress & Exposition November 17-22, 2002, New Orleans, Louisiana
IMECE2002-33261 NONLINEAR BEHAVIOR OF A PARAMETRIC RESONANCE-BASED MASS SENSOR Wenhua Zhang, Rajashree Baskaran and Kimberly L. Turner University of California at Santa Barbara, Department of Mechanical and Environmental Engineering Email:
[email protected] Department of Mechanical and Environmental Engineering, EII 2355 University of California at Santa Barbara, CA 93106-5070
Fax: (805) 893-8651, Phone: (805) 893-7849 ABSTRACT The ability to detect mass change of the order of femtograms (10e-15g) opens up implementations of various precise chemical and biological sensors. Micro-scale oscillator based mass sensors are promising due to their small mass and high sensitivity. Many such sensors detect mass change by measuring the shift of natural frequency. We have reported previous work introducing the idea of using parametric resonance to detect mass change. This method utilizes stability behavior with mass variation as the detection criterion and high sensitivity is expected. This paper presents theoretical and experimental research on nonlinearity effects on the dynamic behavior of a MEMS oscillator, which is the prototype of such a mass sensor. A Duffing equation and a nonlinear Mathieu equation are used to model the behavior of nonlinear harmonic resonance and parametric resonance. Experimental results agree with the theoretical analysis very well. Some bulk equivalent parameters, such as Q factor, cubic stiffness and linear electrostatic stiffness can be estimated by studying the nonlinear behavior. The estimation of the parameters is important for design of the optimal mass sensor. The potential effects of nonlinearity on mass sensor application are discussed. INTRODUCTION In a mass-spring dynamic system, a small mass change can cause the shift of natural frequency. By measuring this frequency shift, the small mass change can be quantified. Micro-scale oscillators are promising due to their small mass and high sensitivity. In such implementations of the mass sensors, the higher the natural frequency the smaller the mass change we can resolve, and natural frequencies up to several hundreds kHz can be easily achieved in micro-cantilever oscillators [1, 2]. The sensitivity is also directly proportional to the smallest frequency shift detectable and hence a high Q is required [3]. The nonlinear behavior of micro-oscillator provides a novel way to detect mass change. In a harmonic oscillator with
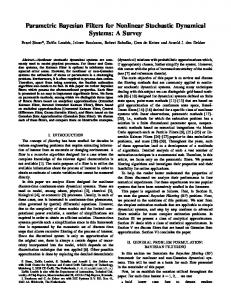
time-modulated stiffness, parametric resonance can be excited [4]. The boundary between resonance region and nonresonance region is well defined. A sharp transition from nonresonance region to resonance region exists at the boundary and this transition is very sharp [5]. Since the boundary depends on system parameters, including mass, mass change is quantified by measuring the shift of the boundary [6, 7]. Because the transition can be very sharp (0.001Hz in a torsional oscillator) [5], high sensitivity is expected. In this paper, we present the theoretical and experimental study of nonlinear behavior of such a system. Nonlinearity effects on harmonic resonance and parametric resonance of a mass sensor are discussed. Some important parameters, including structural and electrostatic, are found by studying the nonlinear behavior. The effects of nonlinearity on mass sensing are discussed too. DEVICE The device is a MEMS oscillator, fabricated using bulkmicro machining technique SCREAM [8]. It was designed by S. G. Adams for the independent tuning of linear and cubic stiffness terms [9]. A Scanning Electron Micrograph of the oscillator is shown in Fig. 1. The area of the device is about 500×400 µm2. It has two sets of parallel interdigitated comb finger banks on either end of the backbone and two sets of noninterdigitated comb fingers on each side. The crab-leg beams provide elastic restoring force for the oscillator. The beams, backbone and the fingers are ~2 µm wide and ~12 µm deep. The backbone is 515 µm long and 20 µm wide. Each of the four crab-leg beams is 200 µm on the long side and 20 µm on the short side. Both the interdigitated and the non-interdigitated comb fingers may be used to drive the oscillator. Figure 1 also shows the configuration of these two kinds of fingers. To actuate the oscillator, a time varying electrical signal is applied on the interdigitated or non-interdigitated comb fingers. Since electrostatic force generated by interdigitated comb
1
Copyright © 2002 by ASME
fingers is independent of the displacement of the oscillator, harmonic resonance can be actuated around natural frequency. If electrical signal is applied on the non-interdigitated comb fingers, parametric resonance can be excited because of the displacement dependence of the electrostatic force [4].
d 2x dx (3) + c + Fr ( x) = Fe (t , x) 2 dt dt where m and c are mass and viscous damping coefficient. m
Duffing Equation: When an electrical signal is applied between the device and the interdigitated fingers, electrostatic force generated is independent of displacement. (4) Fe = FA cos(ω t ) Equation (3) can be written as (after normalization): d 2x dx (5) +α + β x + δ 3 x 3 = f cos(τ ) dτ 2 dτ where α = c , β = k1 , δ 3 = k3 , f = FA mω 2 mω mω 2 mω 2 This is a Duffing equation. It shows the nonlinearity effects on the response of harmonic resonance. Considerable work has been done on Duffing equation, including applications to MEMS devices [9, 12-14].
FIG. 1 A Scanning Electron Micrograph of the oscillator. Note the crab-leg beam springs (S), the two sets of interdigitated comb finger banks (C) on both ends of backbone (B) and non-interdigitated comb fingers (N) on each side of backbone (B). (a) and (b) shows the schematic configuration of interdigitated and non-interdigitated comb fingers respectively. THEORY We use two commercial software packages, Ansys [10] and Coulomb [11], to simulate restoring force of the springs and electrostatic force of non-interdigitated comb fingers respectively. The restoring force and electrostatic force versus displacement are calculated and fitted with polynomial equations. Nonlinearity effect (cubic term in polynomial equation) cannot be neglected in both cases at large displacement [9]. The equation of restoring force and electrostatic force are given by: (1) Fr ( x ) = k1 x + k 3 x 3 3 2 (2) Fe ( x ) = − (r1 x + r3 x )V where Fr is restoring force and Fe is electrostatic force. We define k1 as the linear stiffness, which is normal stiffness in a linear system, and k3 as the cubic stiffness. r1 is linear electrostatic stiffness and r3 is cubic electrostatic stiffness. Table 1 shows the results of k1, k3, r1, and r3. Table 1 Numerical simulation results of k1, k3, r1, and r3 k1 (µN/µm)
k3 (µN/µm3)
r1 (µN/µm/V2)
r3 (µN/µm-3V-2)
7.61
4.4e-2
-3.65e-4
-1.6e-5
Put Fr and Fe into the genetic equation of a single DOF forced vibration system, as follows:
Parametric Resonance: To actuate parametric resonance, electrical signal is applied between the device and the noninterdigitated fingers. A square root sinusoidal voltage signal 1 ( V = VA (1 + cos(ω t )) 2 ) is applied to avoid coupling between parametric resonance and harmonic resonance [5]. The normalized equation of motion when such a forcing is applied is: d 2x dx (6) +α + ( β + 2δ cos 2τ ) x + (δ 3 + δ 3' cos 2τ ) x 3 = 0 2 dτ dτ 2 4k + 4r V 2 2r V 2 1 A), where α = 2c , β = 4(k1 + rV δ = 1 A2 , δ 3 = 3 23 A , 2 mω mω mω mω 2 r V 4 δ 3' = 3 2A mω This is a nonlinear Mathieu equation. We use a ‘two variable expansion’ perturbation method to analyze this equation [7, 14]. The results are schematically shown in Fig. 2. Parametric resonance has a well-defined boundary, β=1±δ. The presence of damping changes this boundary curve. The new curve will be β = 1± δ 1− µ 2 , where µ = α . δ According to the characteristics of the solutions, the β-δ plane can be divided into three areas, I, II and III. In area I, only one trivial solution exists. It is a stable solution and is represented as a solid line. In area II, one trivial solution and one non-trivial solution exist, shown as the solid line and dashed line respectively. The non-trivial solution is stable, while the trivial solution is unstable. In area III, two non-trivial solutions, and one trivial solution exist. The bigger of the nontrivial and the trivial solution are stable, while the other nontrivial solution is unstable. The following equation shows the relationship between the amplitude and β. 4 (7) R2 = − ( β ± 1) 3γ 3eff
γ3eff is the Effective Nonlinearity Parameter of the system, a sum of contributions from cubic mechanical stiffness and cubic electrostatic stiffness [7]. 2
Copyright © 2002 by ASME
1 4 (8) (2k3 + r3VA2 (2 ± ) 2 rV 3 1 A In the voltage range we are working on, γ3eff is negative.
γ 3eff =
FIG. 2 Schematic characteristics of the first order parametric resonance. β = 1± δ 1− µ 2 is the boundary curve when damping effect is considered. This figure also shows how each solution grows with increasing β, where S represents stable solution (non resonant) and U represents unstable solution (resonant- type). EXPERIMENTS We use a multi-dimensional MEMS motion characterization suite to characterize the dynamic response of the device [15]. Testing is carried on in a vacuum chamber, where pressure can be pumped to 5 mTorr. The motion characteristics of the device (velocity and displacement) are measured using a laser Doppler Vibrometer with built in controllers and sensor heads (Polytec, OFV-3001, and OFV511). The electrical signal is provided by a voltage source (HP3245A). The displacement and velocity signals from the Vibrometer are analyzed with a HP Spectrum Analyzer (HP89470A) and Tektronics Oscilloscope (TDS 420 A). To measure the in plane movement, a 450 mirror reflects the laser to the moving part and collects the laser signal [15]. All the data is taken at 7 mTorr. Results Q Factor and Natural Frequency: To measure Q factor and natural frequency, an Ac voltage signal (VA=20 V) is applied on the interdigitated comb fingers. Since the electrostatic force is independent of displacement and the applied voltage and hence the displacement of the oscillator is relatively low, nonlinearity effects are avoided. At 7mTorr, the natural resonance frequency is 26.48 kHz and Quality factor is 640. The maximum amplitude of motion at this voltage is less than 0.1µm. Duffing Response: A much higher AC voltage signal (VA=60 V) is applied on the same comb finger to measure nonlinearity effects on harmonic resonance. By sweeping the driving frequency up and down, we record the frequency response in both cases, as shown in Fig. 3. It is a typical Duffing curve as described by Eq. (5). By fitting the curve with the theoretical solution, cubic stiffness can be found (k3=0.030 µN/µm3),
which is very close to the numerical simulation results using ANSYS (k3=0.044µN/µm3)
FIG. 3 The oscillator’s frequency response curve when excited with the interdigitated comb fingers with a high voltage (VA = 60 V). This isolates the effect of mechanical cubic nonlinearity with that of the electrostatic nonlinearity since the latter arises only when driven by non-interdigitated comb drives. The experimental data is represented by squares and the smooth line is the fit using solution to a Duffing equation. Parametric Resonance: To actuate parametric resonance, a voltage is applied between the device and the non-interdigitated comb fingers. A square root sinusoidal voltage signal is used to avoid coupling between parametric resonance and harmonic resonance[5]. The first order parametric resonance is observed around two times the natural frequency. At VA=20 V, the frequency responses are shown in Fig. 4, when the driving frequency is swept up and down. We also use different step size to see the effects on the dynamic response of the oscillator. When sweeping the frequency up, parametric resonance exists between 52.3 kHz and 53.7 kHz. When sweeping down, parametric resonance exists between 52.3 kHz and 52.7 kHz. According to the characteristics of the responses, the VA-f plane of the first order parametric resonance can be divided into three areas, which correspond to the three areas in Fig. 2. A small response exists in area I and a large response exists in area II, while two responses exist in area III (one is small and one is large). The experimental results of frequency responses agree very well with the theoretical results, as shown in Fig. 2. Frequencies at point Q and P are in the left and right boundary respectively. The small response in area I corresponds to the trivial solution and the large response in area II corresponds to the nontrivial solution. In area III, one large response and one small response exist, which correspond to the nontrivial and trivial solutions. Note that the unstable solution is not observed experimentally. This is expected since an unstable parametric response corresponds to an exponentially decaying solution.
3
Copyright © 2002 by ASME
Parametric resonance provides an alternate and highly sensitive method of detecting mass change using an oscillator. High sensitivity is expected because of the sharp transition of the response at the boundary of parametric resonance. The effect of the cubic mechanical stiffness and electrostatic stiffness changes the dynamic behavior of the oscillator response when excited parametrically in parts of the parameter (Frequency-Amplitude of input voltage) space. This changes the regions of operation of the mass sensor, but does not alter the sensitivity. The detailed modeling and analysis also serves as a tool for design of the mass sensor. The sharp transition, which facilitates the high mass change detection, can also be used to estimate the system parameters with good degree of accuracy in the reference oscillator.
FIG. 4 Experimental data of frequency-amplitude curves as the driving frequency is swept quasi-statically near first order parametric resonance (twice the natural frequency) at VA=20 V. The figure can be divided into three areas, I, II and III (Refer Fig. 2 for the distinction). Note there are two experimental responses in area III, corresponding to the two stable solutions. The points R and S are in region III where the response jumps from the large amplitude stable response to the trivial solution. Boundary Mapping: As shown in Fig. 4, parametric resonance has well defined boundaries in each side. By sweeping the electrical signal in different voltages, the boundaries can be mapped. Figure 5 shows the boundaries of the first order parametric resonance of the oscillator at 7 mTorr in room temperature. The theoretical results ( β = 1± δ 1− µ 2 in VA-f format) are also shown in this figure, which agree very well with the experimental results. By fitting experimental results with theoretical results, linear electrostatic stiffness and Q factor can be found. Here, Q=671 and r1=-3.67e-4 µN/V2/µm. Both results agree very well with the results from other methods (Q=640 in the low voltage testing and r1=-3.65e-4 µN/V2/µm from numerical simulation result). Conclusion We present theoretical analysis and experimental testing on the nonlinear behavior of a mass sensor. Understanding the effect of non-linearity is essential for the sensor design since it effects the underlying dynamics significantly and is always present in ‘real’ systems. Nonlinearity effects on harmonic resonance are described using Duffing equation. Experimental results show a typical Duffing frequency response and match the theoretical results very well. A nonlinear Mathieu equation is used to analyze nonlinear effects on parametric resonance. The results agree with the experimental results. The boundary of the first order parametric resonance is mapped as well and it fits the theoretical results. From the analysis of nonlinear behavior, some important parameters can be found, including Q factor, cubic stiffness, and linear electrostatic stiffness, which are very close to the value found from other methods.
FIG. 5 Mapping of the first order parametric resonance transition curve in VA-f plane (Driving voltage amplitudeDriving Frequency) at 7 mTorr. The squares represent experimental data. The equation of the curve fit is in VA-f format of β = 1± δ 1− µ 2 .
ACKNOWLEDGMENTS The authors would like to thank S. G. Adams for the device fabrication. This work is supported by NSF CAREER award #0093994. REFERENCES [1] Lang, H. P., Berger, R., Battiston, F., Ramseyer, J. P., Meyer, E., Andreoli, C., Brugger, J., Vettiger, P., Despont, M., Mezzacasa, T., Scandella, L., Guentherodt, H. J., Gerber, C. and Gimzewski, J. K., 1998, "A chemical sensor based on a micromechanical cantilever array for the identification of gases and vapors," Scanning Tunneling Microscopy/Spectroscopy and Related Techniques (STM'97), Hamburg, Germany, pp. S61-64. [2] Davis, Z. J., Abadal, G., Kuhn, O., Hansen, O., Grey, F. and Boisen, A., 2000, "Fabrication and characterization of nanoresonating devices for mass detection," J. Vac. Sci. Technol. B, Microelectron. Nanometer Struct., 18, pp. 612-616. [3] Vu Thien, B., Garcia, N. and Levanyuk, A. L., 1994, "A mechanical nanosensor in the gigahertz range: where mechanics meets electronics," Surf. Sci., 301, pp. L224-228.
4
Copyright © 2002 by ASME
[4] Turner, K. L., Miller, S. A., Hartwell, P. G., Macdonald, N. C., Strogartz, S. H. and Adams, S. G., 1998, "Five parametric resonances in a microelectromechanical system," Nature, 396, pp. 149-152. [5] Turner, K. L., Hartwell, P. G., Bertsch, F. M. and Macdonald, N. C., 1998, "Parametric resonance in a microelectromechanical torsional oscillator," ASME International Mechanical Engineering Congress and Exposition Proceedings of Microelectromechanical Systems (MEMS), Anaheim, CA, USA, pp. 335-340. [6] Turner, K. L. and Zhang, W., 2001, "Design and analysis of a dynamic MEM chemical sensor," Proceedings of the 2001 American Control Conference, Arlington, VA, USA, pp. 12141218. [7] Zhang, W., Baskaran, R. and Turner, K. L., 2002, "Effect of cubic nonlinearity on auto-parametrically amplified resonant MEMS mass sensor," Sensors and Actuators A (Physical), Accepted. [8] Macdonald, N. C., 1996, "SCREAM microelectromechanical systems," Microelectron. Eng., 32, pp. 49-73. [9] Adams, S. G., Bertsch, F. M., Shaw, K. A. and Macdonald, N. C., 1998, "Independent tuning of linear and nonlinear stiffness coefficients [actuators]," J. Microelectromech. Syst., 7, pp. 172-180. [10] Ansys, "Release 5.7,". [11] Coulomb, 2000, "Three-Dimensional Electrostatic Field Solver, Version 5.1,". [12] Evoy, S., Carr, D. W., Sekaric, L., Olkhovets, A., Parpia, J. M. and Craighead, H. G., 1999, "Nanofabrication and electrostatic operation of single-crystal silicon paddle oscillators," J. Appl. Phys., 86, pp. 6072-6077. [13] Aikele, M., Bauer, K., Ficker, W., Neubauer, F., Prechtel, U., Schalk, J. and Seidel, H., 2001, "Resonant accelerometer with self-test," Proceedings of EUROSENSORS. 14th European Conference, Copenhagen, Denmark, pp. 161-167. [14] Rand, R. H., 2000, Lecture Notes on Nonlinear Vibrations, version 34a, Available online at http://www.tam.cornell.edu/randdocs/. [15] Turner, K. L., 1999, "Multi-dimensional MEMS motion characterization using laser vibrometry," Transducers'99 The 10th International conference on solid-state Sensors and Actuators, Digest of Technical Papers, Sendai, Japan, pp. 11441147.
5
Copyright © 2002 by ASME