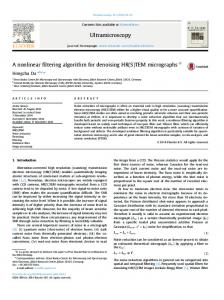
This paper introduces a new smoothing algorithm for time series processing to be
... images. The algorithm is based on a nonlinear exponential smoothing.
HAIT Journal of Science and Engineering B, Volume 2, Issue x, pp. xxx-xxx C 2005 Holon Academic Institute of Technology Copyright °
Nonlinear exponential smoothing (NLES) algorithm for noise filtering and edge preservation Roman E. Goot1 , Uri Mahlab2,3 , and Reuven Cohen4,∗ 1
Center for Industrial and Applied Mathematics Holon Academic Institute of Technology, 52 Golomb St., Holon 58102, Israel 2 Department of Electrical Engineering Holon Academic Institute of Technology, 52 Golomb St., Holon 58102, Israel 3 Optical Technology and Networking Group, Optical Networks Division, ECI Telecom, 30 Ha-sivim St., Petach Tikva 49517, Israel 4 Embedded Software Group, Optical Networks Division, ECI Telecom, 30 Ha-sivim St., Petach Tikva 49517, Israel ∗ Corresponding author:
[email protected] Received 27 September 2004, revised 16 May 2005, accepted 22 May 2005 Abstract This paper introduces a new smoothing algorithm for time series processing to be implemented in various applications, including, among others, array processing and wireless communication. This new approach has also been tested for noise filtering and edge preserving in images. The algorithm is based on a nonlinear exponential smoothing (NLES) method that shows a significant improvement in the mean squared error and in the step function response, in comparison to other exponential smoothing methods. The interference-elimination results of the proposed algorithm for an input signal containing a noisy image were equivalent to those of moving average filter [1] and Wiener adaptive filter [2]; however, due to its simplicity, efficiency and reduced memory resources needed, the algorithm becomes extremely attractive.
2
1
Introduction
A general problem related to filtration and prediction of signal and time series, modeled as a random process, consists of a deterministic process added to a random signal (or sequence) with independent samples. If the statistical properties of the process are perfectly known, the optimal processing algorithm always can be constructed. However, optimal algorithms impose very often too rigid hardware and memory constrains, which forces us to reformulate an optimality into a conditional optimality. Another aspects, including only partial knowledge of the required statistical characteristics, as well as the high uncertainty for the probabilistic model to fit the problem we deal, lead us to use sub-optimal methods which do not guarantee optimality but show good results for a wide variety of situations. One of the frequently used methods is the exponential smoothing (ES) approach. The ES, as a method for filtration and prediction of time series, was proposed in the late 50s and the early 60s [3,4]. Due to its simplicity, it was used intensively for more then 20 years [5,6]. The progress in the field of digital signal processing together with simplicity and effectiveness of the ES stimulated its further using in several applications yielding better results in comparison to other sophisticated methods up to the present time [7,8].
2
Nonlinear exponential smoothing (NLES)
The procedure of ES is defined by the following recursive relation: Sn = α xn + (1 − α) Sn−1 ; 0 ≤ α ≤ 1,
(1)
where {xn } is the sequence data (samples) to be processed, Sn is the processed result for the n-th step, and α is the smoothing coefficient. Repeated use of Eq. (1) leads to the equation Sn = α
n X i=1
β n−i xi + β n S0 ,
β =1−α
(2)
where the processing result is a weighted sum of all samples with exponentially decreasing weights. This procedure is suitable for time series with slowly varying trends. It has only one parameter α that must meet the two contradictory requirements: on the one hand, it must be small enough α = (0.2 ÷ 0.3) for smoothing of the interference component of the model, and on the other hand, it should be large enough to track possible fast variations in the input signal α = (0.7 ÷ 0.9). 3
To resolve the contradiction, we define ∆n = xn − Sn−1 , and by substituting in Eq. (1) we get Sn = α∆n + Sn−1 .
(3)
For prediction scenario, the value ∆n is interpreted as the prediction error at the n-th step, and Sn is the correction of the value Sn−1 by using the revealed error ∆n . In order to fulfill simultaneously the two above contradictory conditions for α, we will define α to be α = α(|∆|), where the new α is a non-decreasing function of |∆n |. Thus substituting α in Eq. (3) with α(|∆|) leads to Sn = α(|∆n |)∆n + Sn−1 .
(4)
Eq. (4) describes the NLES method.
Figure 1: An example of the behavior of α as a function of |∆n|. Eq. (4) is a generalization of the classical ES procedure of Eq. (3). Fig. 1 demonstrates an example of function α(|∆|). As long as |∆| is small, α(|∆|) reaches its lower limit, while as |∆| increases, α(|∆|) also increases up to its upper limit. The motivation for partitioning ∆n into 3 regions can be explained by the fact that values of ∆n below ∆0 are caused by noise and thus smoothing is needed, therefore we choose ∆0 =0.2 and α0 =0.2.
4
Values above ∆1 are generally contributed by the signal and thus ∆1 =0.8 and α1 =0.8, which dramatically decreases the smoothing affect. For the values between 0.2 and 0.8 the smoothing should be adaptive.
3
Experimental results
To demonstrate the performance of the proposed NLES algorithm, we conducted several tests and compared the results with several well-known simple algorithms. In the first test we investigated the response of the NLES algorithm to unit step function compared to classical ES and adaptive ES (AES) [9]. The AES is described by the following equations: Sn− = (αn − ∆α) · ∆n + Sn−1 Sn = αn · ∆n + Sn−1 Sn+ = (αn + ∆α) · ∆n + Sn−1
(5)
where Sn is the basic result of the processes, while the values Sn− and Sn+ are used to calculate ∆n according to Eq. (3) + ∆n+1 = xn+1 − Sn+ ∆ = xn+1 − Sn (6) n+1 − ∆− = x − S n+1 n n+1 and αn is given by complex computations αn + ∆α , if |∆+ n | = min αn+1 = , if |∆n | = min αn αn − ∆α , if |∆− n | = min
(7)
In this case, αn is changed adaptively according to the changes in input signal and provides better tracking results for fast transients in the input signal; however, at the same time it requires more complex computation. In this test, a unit step function corrupted with additive independent uniformly distributed random noise within the range [-0.5, 0.5] was chosen as the input series. This function emphasizes the contradictory requirements for the coefficient α, which has to be simultaneously small to filter the noise and large to track the input signal. Fig. 2 shows the results of comparison between the ESs and the proposed NLES. Fig. 2 (a) represents the corrupted input step function with a uniformly distributed random noise, (b) represents the NLES results for α(|∆|), as shown in Fig. 1, where α0 =0.3,
5
∆0 =0.3, α1 =0.8, and ∆1 =0.8. Curve (c) introduces the AES algorithm results, where ∆α was selected to be 0.01. The classical SES result introduced by Eq. (1) is denoted by curve (d).
Figure 2: Comparative results for a unit step function corrupted by additive noise. (b), (c) and (d) are the results of NLES,AES and SES, respectively. In the second trial, we implemented the NLES algorithm to image processing, for image smoothing and noise reduction purposes. The filtered images were spanned row-by-row into a one-dimensional series vector and then NLES was implemented to smooth the corrupted image. In the next step, the smoothed picture was rearranged, column-by-column, into a second onedimensional sequence, and the NLES algorithm was implemented again for better results.
6
In this procedure we used two NLES iterations: (1)
(1)
Sn = α(1) (|∆n |)∆+ n Sn−1 (2) (2) (2) Sn = α (|∆n |)∆+ n Sn−1
(8)
where the first equation smoothes the original image row-by-row, and the second equation smoothes the results of the first iteration column-by-column. α(1) (|∆n |) and α(2) (|∆n |) are the coefficient α function according to Fig. 1.
Figure 3: Comparison of MSE results, with (a)-(f) being the results for SES, AES, NLES, Moving Average, Wiener and Median, respectively. We corrupted the original image in Fig. 4a with variable Gaussian noise variance to demonstrate the smoothing performances. The MSE criterion of Eq. (9) was chosen to test the NLES performance in comparison to SES, AES, Moving Average, Wiener and Median algorithms.
7
Figure 4: Subjective visual comparison (a) Original image. (b) Image corrupted with a Gaussian noise (0.04 variance). (c) SES with α =0.2. (d) AES with ∆α=0.01. (e) NLES with α0 =0.3, ∆0 =0.3, α1 =0.8, and ∆1 =0.8. (f) Moving Average filter. (g) Wiener filter. (h) Median filter.
8
In the MSE term M SE =
N M X X 1 (y(i, j) − s(i, j))2 M ×N
(9)
i=1 i=j
The predicted filtered output y(i, j) and the original image input s(i, j) were denoted as two-dimensional matrices of M xN pixels, and Fig. 3 introduces the MSE comparison results. Fig. 4 introduces a subjective visual comparison. Fig. 4a is the original image and Fig. 4b is the same original image corrupted by a random Gaussian noise with a 0.04 variance. Fig. 4c-4h represent the output results of SES, AES, NLES, Moving Average, Wiener and Median, respectively. In the SES algorithm a clear blurred distortion appears, due to the poor edge response, while in AES the edge line contained outliers, which cause image deformation. The NLES in Fig. 4e shows a sharp line and low noise image results.
4
Conclusion
We demonstrated the superiority of the NLES algorithm over the SES and AES algorithms. The processed image resulting from the NLES algorithm was equivalent in comparison to the Wiener and Moving average filters (MSE and visual), however, we improved the computational efficiency in the meaning of MAC (Multiply and Accumulator) operations, reducing it approximately by a factor of 6 compared to the moving average, and approximately by a factor of 13 compared to the Wiener algorithm. Above all, the reduction of required memory capacity together with simplicity of NLES turn this method to be alternative for vast signal processing applications.
References [1] A.K. Jain, Fundamentals of Digital Image Processing (Prentice Hall, Englewood Cliffs, NJ, 1989). [2] J.S. Lim, Two-Dimensional Signal and Image Processing (Prentice Hall, Englewood Cliffs, NJ, 1990). [3] R.G. Brown and R.F. Meyer, Oper. Res. 9, 673 (1961). [4] R.G. Brown, Statistical Forecasting and Prediction of Discrete Time Series (Prentice Hall, Englewood Cliffs, NJ, 1962). 9
[5] Yu.P. Lukashin, Adaptive Method for Short-Time Forecasting (Statistika, Moscow, 1979), in Russian. [6] A. Feuer, Bell Syst. Techn. J. 62, 2561 (1983). [7] R.J. Hyndman, A.B. Koehler, R.D. Snyder, and S. Grose, Int. J. Forecast. 18, 439 (2002). [8] A.L. Sweet, AIIE Trans. 13, 243 (1981). [9] W.M Chow, J. Industrial Engineering 16, 314 (1965).
10