Benedict J. Schulte, Joseph Buongiorno, and Kenneth Skog2. Abstract-Nonlinear programming models of uneven-aged loblolly pine (Pinus taeda L.) ...
NONLINEAR PROGRAMMING MODELS TO OPTIMIZE UNEVEN-AGED LOBLOLLY PINE MANAGEMENT’ Benedict J. Schulte, Joseph Buongiorno, and Kenneth Skog2 Abstract-Nonlinear programming models of uneven-aged loblolly pine (Pinus taeda L.) management were developed to identify sustainable management regimes which optimize: 1) soil expectation value (SEV), 2) tree diversity, or 3) annual sawtimber yields. The models use the equations of SouthPro, a site- and density-dependent, multi-species matrix growth and yield model that recognizes three species groups (loblolly pine and other softwoods, soft hardwoods, and hard hardwoods) and 13 2-inch diameter-at-breast-height size classes. The regimes for optimal diversity almost obtain their theoretical maximum Shannon diversity indices, but have low SEV's. The optimal economic and production regimes each involve a guiding maximum diameter for softwoods and complete hardwood control, with the optimal maximum diameter a function of site productivity. Constrained optimizations in which SEV is maximized subject to increasing constraints on diversity show the tradeoffs between economic return and diversity objectives.
INTRODUCTION Although interest in uneven-aged management has grown considerably in recent years, information to guide it toward specific objectives is frequently lacking as our scientific knowledge of, and experience with, uneven-aged silviculture remain far behind that of even-aged. In this country, the longest continuous research on uneven-aged forest management comes from studies of loblolly (Pinus taeda L.)-shortleaf pine (P. echinata Mill.) stands in the west Gulf coastal plain of southern Arkansas, particularly at the Crossett Experimental Forest, where research was initiated in 1937 (e.g., Baker and others 1996, Reynolds and others 1984). Over the years, several researchers have proposed unevenaged management regimes for loblolly-shortleaf pine (Baker and others 1996, Farrar 1996, Farrar and others 1984, Hotvedt and others 1989, Reynolds 1959, Williston 1978). The effects of these and other regimes on timber production, economic returns, and structural and species-group diversity are examined by Schulte and Buongiorno (1998). Because these regimes were based either on the personal experiences of the researchers who proposed them or on simulation studies, rather than mathematical optimization, other regimes are likely to prove better suited for specific objectives. The purpose of this paper is to develop mathematical programming models to identify management regimes that maximize tree diversity, economic returns, or annual sawtimber production in uneven-aged loblolly pine and loblolly pine-mixed hardwood stands. METHODS Growth and Yield Model A number of growth and yield models exist for uneven-aged stands of loblolly-shortleaf pine (Baker and Shelton 1998; Murphy and Farrar 1982, 1983, 1988), loblolly pine (Murphy and Shelton 1994, 1996), and loblolly pine-mixed hardwoods (Farrar and others 1989, Lin and others 1998). The model used in this study is the density- and site- dependent, multispecies matrix model of Lin and others (1998, Schulte and others 1998). It was chosen because: 1) its reproduction and mortality equations make it possible to identify sustainable,
1
steady-state management regimes, 2) it can simulate management over the widest range of site productivity, 3) it recognizes the greatest number of species groups and size categories, and 4) its calibration data set covered the largest geographic area, making its results more broadly applicable. The data set used to calibrate the model contains 991 mixed-aged, naturally regenerated, loblolly pine remeasurement plots of the Southern Forest Inventory and Analysis data base. In the model, trees are categorized into thirteen two-inch diameter-at-breast height (d.b.h.) size classes, ranging from two to twenty-six inches, and three species groups: loblolly pine and other softwoods, soft hardwoods, and hard hardwoods. In matrix notation, the general form of the model is:
(1)
where the matrix Gt contains the growth and mortality parameters for year t, the vector yt = [y ijt ] contains the number of live trees per acre of species group I (I = 1, 2, 3) and size class j (j = 1, ..., 13) at the beginning of year t, the vector ht = [h ijt] contains the number of trees cut from each species-size category at the start of year t, and the vector It contains the ingrowth parameters for year t. Sawtimber and pulpwood cubic-foot volumes are estimated using equations (Lin and others 1998) based on the stem volume tables of Clark and Souter (1994). Pulpwood is potentially available from poletimber trees (hardwoods 5 to less than 11 inches d.b.h. or softwoods 5 to less than 9 inches d.b.h.) and from the tops of sawtimber trees (hardwoods 11 inches d.b.h. and larger or softwoods 9 inches d.b.h. and larger). Tree volumes, the ingrowth vector, It, and the growth matrix, Gt, all vary as a function of site productivity and residual stand basal area.
Paper presented at the Tenth Biennial Southern Silvicultural Research Conference, Shreveport, LA. February 16-18, 1999
2
Research Assistant and Professor, Department of Forest Ecology and Management, Madison, WI 53706-1598; and Supervisory Research Forester, USDA Forest Service, Forest Products Laboratory, One Gifford Pinchot Drive, Madison, WI 53705-2398, respectively.
381
Optimization Models Maximizing soil expectation value—While obtaining economic returns certainly is not the only reason forest landowners in the South own their land (Lentz and others 1989), it is an important consideration, in part because it makes other pursuits possible, such as wildlife conservation, recreation, aesthetics, and hunting. In addition, knowing the maximum economic return that can be expected from a particular site provides a valuable baseline for judging the economic performance of alternative management strategies. A stand’s soil expectation value, the present value of all future harvests, net of all costs, including the opportunity cost of the growing stock, is the preferred criterion for measuring economic performance. The model for maximizing SEV is:
(table 1, Timber Mart-South 1997). For sawtimber, a premium for larger trees is assumed whereby the stumpage price of each sawtimber diameter class is three percent greater than that of the next smaller class, while the average price across diameter classes is the 1996 southeastern average. Pulpwood cubic-foot volumes are converted to cords assuming 72 cubic feet per cord for softwoods and 79 cubic feet for hardwoods. Koch’s conversion table (Koch 1972) is used to convert cubic-foot sawlog volumes to board-foot measures (Scribner log rule for softwoods and Doyle log rule for hardwoods). Harvesting costs not already reflected in the stumpage prices, F, such as administration and hardwood control, are assumed to total $80.00 per acre, while the real rate of interest, r, is set at 4 percent, the value used by the USDA Forest Service. Equations (3) are the growth equations. There is one equation for each year of the cutting cycle. Equation (4) is the steady-state constraint, which ensures sustainability by requiring the stand to return to the same pre-harvest distribution each cutting cycle. Equation (5) guarantees that the number of trees harvested from the stand does not exceed the number of trees present; whereas equations (4) and (5) together ensure that the number of trees in, and harvested from, each species-size category is nonnegative.
subject to: (3)
Maximizing tree diversity—Forest landowners are also increasingly interested in managing for biological diversity. Because the distribution of trees by species and size largely determines a stand’s structure and, thus, the ecological niches available to other organisms, tree diversity is a key component of a stand’s overall diversity (Wilson 1974, Rice and others 1984). One of the most widely used and accepted diversity indices is Shannon’s index. The model for maximizing Shannon’s index of tree diversity, H, is: (7)
where C is the number of years in the cutting cycle, the vector h = [hij] contains the number of live trees harvested per acre each cutting cycle from of species I and size j, and vectors = [Sij ] contains the stumpage values of a standing live tree in each species-size category.
subject to: (3), (4), (5) and (6) where bij is the residual basal area of trees of species I and size j, b is the residual basal area of all trees, and e is a small, positive constant (0.001) used to avoid division by zero and natural logarithm of zero errors. As defined here, Shannon’s index reaches its maximum value of 3.66 when the residual basal area is distributed evenly among each of the thirty-nine species-size categories. By defining Shannon’s index in terms of the
The stumpage values of individual trees are obtained by multiplying their pulpwood (cords) and sawtimber (boardfeet) volumes by the corresponding stumpage prices. The pulpwood stumpage prices used in this analysis are the 1996 average prices for the Southeastern United States
Table 1—Stumpage prices used to calculate soil expectation values Sawtimber by d.b.h. class (in.) Species group
Pulpwood $/cord
Softwoods Soft hardwoods Hard hardwoods a
382
23.73 13.73 13.73
10
12
14
16
18
20
22
24
26+
Avg.
- - - - - - - - - - - - - - - - - - - - - - - - - - $/Mbf a - - - - - - - - - - - - - - - - - - - - - - - - - 210 — —
216 112 178
223 115 183
229 118 189
236 122 195
243 126 200
251 129 207
Sawtimber prices are Scribner log rule for loblolly pine and other softwoods and Doyle log rule for hardwoods.
258 133 213
266 137 219
237 124 198
distribution of basal area rather than individual trees, greater weight is given to larger diameter trees. Maximizing annual sawtimber yields—Another common concern of southern forest landowners is knowing the average annual volume of loblolly pine sawtimber that can be produced sustainably from a given stand. The model for maximizing the sustainable annual loblolly pine sawtimber yield, Vs, is: (8)
subject to: (3), (4) (5) and (6) where, vis is the board-foot volume of a loblolly pine of saw-timber size class js. Competing objectives—While it is certainly possible to manage a stand for multiple objectives, it is generally not possible to maximize a stand’s performance in terms of more than one objective at a time. When two or more objectives are less than completely complementary, mathematical programming models can help quantify tradeoffs between competing objectives. To illustrate, we add a constraint to the model for maximizing SEV that requires tree diversity to be at least a given percentage of its maximum sustainable value, H' : (2)
subject to: (3), (4), (5), (6) and (9)
completely controlled at each harvest and the loblolly pines and other softwoods are cut back to a guiding maximum diameter of 13 inches d.b.h. on low sites and 11 inches on medium and high sites. The regimes give SEVs of $989, $1,065, and $1,207 per acre, while producing 357, 346, and 395 b.f./acre/year of loblolly pine and other softwood sawtimber, respectively. Although more trees are harvested from medium sites than high sites, high sites have a greater SEV because trees of a given diameter are taller and have larger volumes on the better sites (Lin and others 1998). Similarly, whereas low sites produce a greater annual volume of sawtimber than medium sites, medium sites have the greater SEV because their longer cutting cycle reduces the frequency at which harvesting costs are incurred. The small diameters of softwoods and the absence of hardwoods in the residual stands result in relatively low Shannon indices of tree diversity of 1.67, 1.50, and 1.50 for low, medium and high sites, respectively. Tree Diversity The steady-state management regimes that maximize Shannon’s index of tree diversity are in Table 3. The nearly even distribution of basal area across all species-size categories results in Shannon indices of tree diversity very near the theoretical maximum. For each site, the optimal cutting cycle is one year, but few trees are cut with each harvest. Thus, the average annual loblolly pine sawtimber yields are a mere 57, 65, and 74 b.f./acre/year for low, medium, and high sites, respectively. Due to their short cutting cycles, low yields, and large investments in growing stock, these regimes have very low SEVs of $-2,726, $-2,735, and $-2,756 per acre, respectively. However, these values could be raised to $-870, $-886, and $-896 per acre, respectively, while leaving tree diversity essentially unchanged at 3.66, by adopting instead the regimes which maximize Shannon’s index of tree diversity for a 10-year cutting cycle.
All the optimization problems examined in this study have non-concave response surfaces. These non-concave response surfaces, which result from 1) the recursive nature of the growth equations (Eq. (3)) when the cutting cycle exceeds one year, 2) the nonlinearity of the growth model (Lin and others 1998) and 3) the use of Shannon’s index to quantify tree diversity, necessitate the use of nonlinear programming techniques. The problems were coded in the GAMS programming language and solved with the GAMSMINOS solver for cutting cycles of 1 to 20 years to determine which is optimal and for each of three site productivity categories: low (loblolly pine site index of 60 to 79 feet, age 50). medium (80 to 94 feet) and high (95 to 109 feet). Because nonlinear programming techniques were used, it is not possible to know whether the optimal solutions identified by the solver are global optima or local optima.
Sawtimber Production Table 4 shows the optimal management regimes for producing loblolly pine and other softwood sawtimber. Again, the optimal cutting cycle for each site is 1 year. As was the case for the SEV-maximizing regimes, the optimal sawtimber regimes each involve complete hardwood control at each harvest and a guiding maximum diameter for loblolly pine and other softwoods: 19 inches d.b.h. on low sites and 17 inches on medium and high sites. These regimes produce 426, 472, and 520 b.f./acre/year of loblolly pine and other softwood sawtimber on low, medium, and high sites, respectively. By leaving more large diameter softwoods in the residual stand than the SEV-maximizing regimes, Shannon’s index of tree diversity improves to 1.99 on low sites and 1.90 on medium and high sites. In contrast, the SEVs are only $-1,590, $-1,088, and $-1,071 per acre, respectively, due to the short cutting cycles. If the regimes which maximize annual softwood saw-timber yields for a 10year cutting cycle were adopted instead, the SEVs would improve to $445, $431, and $425; whereas the softwood sawtimber production would decline by only 1.7, 1.9, and 2.3 percent, respectively.
RESULTS AND DISCUSSION Soil Expectation Value Table 2 gives the steady-state management regimes that maximize SEV on low, medium, and high productivity sites. The optimal cutting cycles are 11, 15, and 13 years, respectively. In all three cases, the hardwoods are
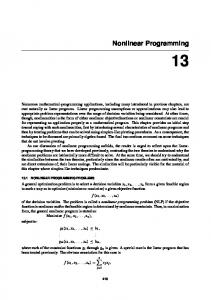
Competing Objectives Figure 1 shows the effect of increasingly restrictive tree diversity constraints on the maximum sustainable SEVs of different sites. SEVs remain at their maximum levels until tree diversity is constrained to be at least 42 percent of its sustainable maximum for low sites or 46 percent for medium
where Z is an integer from zero to 99. Then, the opportunity costs of improving tree diversity are determined by solving the model for increasing levels of Z.
383
Table 2—Steady-state management regimes that maximize soil expectation value, by site Diameter-at-breast height (inch) Sitea
Time
Specie; group
2
4
6
8
10
12
14
16
18
20
22
24
26+
- - - - - - - - - - - - - - - - - - - - - - - - - - - - - - -Trees per acre - - - - - - - - - - - - - - - - - - - - - - - - - - - - - - - Low
a b c
1.6 — —
0.3 — —
— — —
— — —
— — —
25.8 35.2 21.4 19.3 — — — — — — — — — — — — — — $989/ac, sawtimber = 357 bf/ac/yr, H = 1.67
— — —
— — —
— — —
— — —
— — —
1.3 — —
.3 — —
— — —
— — —
— — —
— — —
— — —
— — —
— — —
— — —
.9 — —
.2 — —
— — —
— — —
— — —
— — —
— — —
— — —
— — —
— — —
SW SH HH
124.1 67.5 90.4
57.4 6.5 11.4
Post harvest
SW SH HH Cycle c
124.1 — — = 11 yr,
57.4 — — SEV =
SW SH HH
132.8 88.4 80.1
63.3 14.8 14.7
Postharvest
SW SH HH Cycle c
132.8 — — = 15 yr,
63.3 — — SEV =
Preharvest
SW SH HH
136.2 77.7 63.0
64.6 13.3 10.8
Postharvest
SW SH HH Cycle c
136.2 — — = 13 yr,
— 40.1 29.6 — — 64.6 24.6 — — — — — — — — — — — — — — SEV = $1,207/ac, sawtimber = 395 bf/ac/yr, H = 1.50
Medium Preharvest
High
5.5 — —
Preharvest
35.2 .6 1.4
39.2 2.3 2.7
25.8 — .1
28.9 .3 .5
21.4 — —
24.0 .0 .1
28.9 39.2 24.0 — — — — — — $1,065/ac, sawtimber = 40.1 2.0 1.8
29.6 .3 .3
24.6 — —
19.3 — —
17.5 — —
12.7 — —
9.8 — —
4.1 — —
— — — — — — — — — 346 bf/ac/yr, H = 1.50 17.0 — —
8.7 — —
3.2 — —
Loblolly pine site index: Low = 60-79, Medium = 80-94, High = 95-109 feet. SW = pines and other softwoods, SH = soft hardwoods, HH = hard hardwoods. Cycle = cutting cycle, SEV = soil expectation value, Sawtimber = annual loblolly pine sawtimber yield, and H = Shannon’s index of tree diversity.
and high sites. After that, they drop at increasingly rapid rates as tree diversity requirements increase. For example, requiring tree diversity to be at least 65 percent of its maximum reduces the maximum SEVs by 12, 11, and 10 percent for low, medium and high sites, respectively: whereas requiring it to be at least 85 percent of its maximum reduces the maximum SEVs by 43, 39, and 38 percent, respectively.
Figure 1—Maximum soil expectation value, by site, under increasingly restrictive tree diversity constraints, expressed as a percentage of the maximum sustainable diversity.
384
Being able to quantify the tradeoffs between competing objectives greatly facilitates the identification of acceptable compromises. One potential compromise might be to adopt the management regime which maximizes SEV while requiring tree diversity to be at least 75 percent of its sustainable maximum. In this case, the maximum SEVs on low, medium, and high productivity sites would be $752, $846, and $960 per acre, or 76, 79, and 79 percent of their unconstrained sustainable maxima, respectively.
Table 3—Steady-state management regimes that maximize the Shannon index of tree diversity, by site Diameter-at-breast height (inch) Sitea
Time
Species group b 2
4
6
8
10
12
14
16
18
20
22
24
26+
- - - - - - - - - - - - - - - - - - - - - - - - - - - - - - Trees per acre - - - - - - - - - - - - - - - - - - - - - - - - - - - - - Low
PreHarvest
SW SH HH
89.7 94.8 96.4
PostHarvest
SW SH HH Cycle c
89.7 90.0 90.0 = 1 yr,
SW SH HH
89.3 94.2 93.0
Postharvest
SW SH HH Cycle c
89.3 89.9 89.9 = 1 yr,
Preharvest
SW SH HH
89.1 93.6 91.7
Postharvest
SW SH HH Cycle c
89.1 89.7 89.7 = 1 yr,
Medium Preharvest
High
a b c
23.9 23.2 23.5
10.3 10.2 10.2
5.8 5.7 5.7
3.7 3.7 3.7
22.5 10.0 5.6 3.6 22.5 10.0 5.6 3.6 22.5 10.0 5.6 3.6 SEV = $-2,726/ac, sawtimber = 23.9 23.6 23.5
10.3 10.2 10.2
5.8 5.7 5.7
3.7 3.7 3.7
22.5 10.0 5.6 3.6 22.5 10.0 5.6 3.6 22.5 10.0 5.6 3.6 SEV = $-2,735/ac, sawtimber = 23.9 23.8 23.5
10.3 10.3 10.2
5.8 5.7 5.7
3.7 3.7 3.7
2.6 2.5 2.5
1.9 1.9 1.9
2.5 1.8 2.5 1.8 2.5 1.8 57 bf/ac/yr, H = 2.6 2.5 2.5
1.9 1.9 1.9
2.5 1.8 2.5 1.8 2.5 1.8 65 bf/ac/yr, H = 2.6 2.5 2.5
1.9 1.9 1.9
22.4 10.0 5.6 3.6 2.5 1.8 22.4 10.0 5.6 3.6 2.5 1.8 22.4 10.0 5.6 3.6 2.5 1.8 SEV = $-2,756/ac, sawtimber = 74 bf/ac/yr, H =
1.4 1.4 1.4
1.1 1.1 1.1
0.9 1.0 .9
0.8 .8 .7
0.6 .6 .6
0.5 .5 .5
1.4 1.4 1.4 3.66
1.1 1.1 1.1
.9 1.0 .9
.7 .8 .7
.6 .6 .6
.5 .5 .5
1.4 1.4 1.4
1.1 1.1 1.1
.9 .9 .9
.8 .8 .7
.6 .6 .6
.5 .5 .5
1.4 1.4 1.4 3.66
1.1 1.1 1.1
.9 .9 .9
.7 .8 .7
.6 .6 .6
.5 .5 .5
1.4 1.4 1.4
1.1 1.1 1.1
.9 .9 .9
.8 .8 .7
.6 .6 .6
.5 .5 .5
1.4 1.4 1.4 3.66
1.1 1.1 1.1
.9 .9 .9
.7 .8 .7
.6 .6 .6
.5 .5 .5
Loblolly pine site index: Low = 60-79, Medium = 80-94, High = 95-109 feet. SW = pines and other softwoods, SH = soft hardwoods, HH = hard hardwoods. Cycle = cutting cycle, SEV = soil expectation value, Sawtimber = annual loblolly pine sawtimber yield, and H = Shannon’s index of tree diversity.
385
Table 4—Steady-state management regimes that maximize annual loblolly pine sawtimber production, by site Diameter-at-breast height (inch) Sitea
Time
Species group b 2
4
6
8
10
12
14
16
18
20
22
24
26+
- - - - - - - - - - - - - - - - - - - - - - - - - - - - - Trees per acre - - - - - - - - - - - - - - - - - - - - - - - - - - - - - Low
11.8 — —
1.1 — —
— — —
— — —
— — —
SW 89.1 38.5 23.0 16.6 13.6 12.2 11.6 11.6 — — — — — — SH — — — — — — — — HH — — Cycle c = 1 yr, SEV = $-1,590/ac, sawtimber = 426 bf/ac/yr, H = 1.99
11.8 — —
— — —
— — —
— — —
— — —
SW SH HH
104.7 6.4 6.5
14.1 — —
1.4 — —
— — —
— — —
— — —
— — —
Postharvest
SW SH HH Cycle c
104.7 46.2 27.9 20.3 16.7 15.0 14.2 14.1 — — — — — — — — — — — — — — — — = 1 yr, SEV = $-1,088/ac, sawtimber = 472 bf/ac/yr, H = 1.90
— — —
— — —
— — —
— — —
— — —
Preharvest
SW SH HH
104.4 6.4 5.5
1.4 — —
— — —
— — —
— — —
— — —
Postharvest
SW SH HH Cycle c
104.4 46.1 27.9 20.3 16.7 15.0 14.2 14.0 — — — — — — — — — — — — — — — — = 1 yr, SEV = $-1,071/ac, sawtimber = 520 bf/ac/yr, H = 1.90
— — —
— — —
— — —
— — —
— — —
PreHarvest
SW SH HH
PostHarvest
Medium Preharvest
High
a b c
89.1 6.0 9.3
38.5 — —
46.2 — —
46.1 — —
23.0 — —
27.9 — —
27.9 — —
16.6 — —
20.3 — —
20.3 — —
13.6 — —
16.7 — —
16.7 — —
12.2 — —
15.0 — —
15.0 — —
11.6 — —
14.2 — —
14.2 — —
11.6 — —
14.0 — —
Loblolly pine site index: Low = 60-79, Medium = 80-94, High = 95-109 feet. SW = pines and other softwoods, SH = soft hardwoods, HH = hard hardwoods. Cycle = cutting cycle, SEV = soil expectation value, Sawtimber = annual loblolly pine sawtimber yield, and H = Shannon’s index of tree diversity.
CONCLUSIONS Deciding how best to manage forestlands to meet specific objectives requires a clear understanding of what is possible on different sites. The nonlinear programming models presented here help define these limits for uneven-aged loblolly pine stands by identifying sustainable steady-state management regimes that maximize either the soil expectation value, Shannon’s index of tree diversity, or the average annual saw-timber production on low, medium and high productivity sites. As illustrated above, mathematical programming models can also be used to quantify tradeoffs between competing objectives and thus help identify potential compromise management regimes. Nevertheless, because tree growth, reproduction, and mortality are highly stochastic processes, our ability to model them accurately is limited. Therefore, the optimal regimes presented in this paper should be interpreted as tentative recommendations and not as proven strategies to be adopted unquestioningly.
386
ACKNOWLEDGMENTS This work was supported in part by the Wood Utilization for Ecosystem Management Project, U.S. Department of Agriculture, Forest Service, Forest Products Laboratory, and by the School of Natural Resources, University of Wisconsin, Madison. REFERENCES
387
Proceedings of the Tenth Biennial Southern Silvicultural Research Conference Edited by James D. Haywood
Shreveport, Louisiana February 16-18, 1999
Hosted by Stephen F. Austin State University, Arthur Temple College of Forestry USDA Forest Service, Southern Research Station
Sponsored by Stephen F. Austin State University, Arthur Temple College of Forestry Historically Black Colleges and Universities Program National Association of Consulting Foresters of America National Association of Professional Forestry Schools and Colleges National Hardwood Lumber Association Society of American Foresters Southern Group of State Foresters Southern Industrial Forest Research Council USDA Forest Service, Southern Research Station
Published by USDA Forest Service Southern Research Station Asheville, North Carolina November 1999