Int. J. Nav. Archit. Ocean Eng. (2015) 7:227~243 http://dx.doi.org/10.1515/ijnaoe-2015-0016 pISSN: 2092-6782, eISSN: 2092-6790
ⓒ SNAK, 2015
Nonlinear soil parameter effects on dynamic embedment of offshore pipeline on soft clay Su Young Yu1,2, Han Suk Choi1, Seung Keon Lee3, Kyu-Sik Park4 and Do Kyun Kim5 1
Graduate School of Engineering Mastership, Pohang University of Science and Technology, Pohang, Korea 2 Deepwater Technology Mission Oriented Research, Universiti Teknologi PETRONAS, Bandar Seri Iskandar, Perak, Malaysia 3 Department of Naval Architecture and Ocean Engineering, Pusan National University, Busan, Korea 4 Steel Business Division, POSCO, Seoul, Republic of Korea 5 Civil Engineering Department, Universiti Teknologi PETRONAS, Bandar Seri Iskandar, Perak, Malaysia
ABSTRACT: In this paper, the effects of nonlinear soft clay on dynamic embedment of offshore pipeline were investigated. Seabed embedment by pipe-soil interactions has impacts on the structural boundary conditions for various subsea structures such as pipeline, riser, pile, and many other systems. A number of studies have been performed to estimate real soil behavior, but their estimation of seabed embedment has not been fully identified and there are still many uncertainties. In this regards, comparison of embedment between field survey and existing empirical models has been performed to identify uncertainties and investigate the effect of nonlinear soil parameter on dynamic embedment. From the comparison, it is found that the dynamic embedment with installation effects based on nonlinear soil model have an influence on seabed embedment. Therefore, the pipe embedment under dynamic condition by nonlinear parameters of soil models was investigated by Dynamic Embedment Factor (DEF) concept, which is defined as the ratio of the dynamic and static embedment of pipeline, in order to overcome the gap between field embedment and currently used empirical and numerical formula. Although DEF through various researches is suggested, its range is too wide and it does not consider dynamic laying effect. It is difficult to find critical parameters that are affecting to the embedment result. Therefore, the study on dynamic embedment factor by soft clay parameters of nonlinear soil model was conducted and the sensitivity analyses about parameters of nonlinear soil model were performed as well. The tendency on dynamic embedment factor was found by conducting numerical analyses using OrcaFlex software. It is found that DEF was influenced by shear strength gradient than other factors. The obtained results will be useful to understand the pipe embedment on soft clay seabed for applying offshore pipeline designs such as on-bottom stability and free span analyses. KEY WORDS: Dynamic embedment; Offshore pipeline; Dynamic lay effect; Soft clay; Nonlinear soil model; Dynamic embedment factor.
INTRODUCTION Offshore development including multi-variables is becoming more important than before. This is true especially for deepwater and ultra-deepwater developments, as these developments are proceeding actively due to the high demand of energy and Corresponding author: Han Suk Choi, e-mail:
[email protected] This is an Open-Access article distributed under the terms of the Creative Commons Attribution Non-Commercial License (http://creativecommons.org/licenses/by-nc/3.0) which permits unrestricted non-commercial use, distribution, and reproduction in any medium, provided the original work is properly cited.
Unauthenticated Download Date | 3/28/15 2:45 PM
228
Int. J. Nav. Archit. Ocean Eng. (2015) 7:227~243
resource. With regard to offshore and deepwater environmental condition, developers are facing various types of difficulties such as high wind, different geotechnical condition, high pressure of seawater, high temperature and high corrosive substance of production fluids, and many others Yu et al. (2014). Modeling technique, which can be defined as a method to generate the real field condition from the input data through reliable idealizing process, should be established in order to analyze and construct robust structure, in general. However, in case of deepwater development, various factors related to geotechnical survey for the deepwater development have not been fully applied. For example, empirical formulas obtained from their experience and know-how are normally applied to the design of offshore pipeline/flowline and they give pipe embedment results based only on the consideration for the difference between pipe submerged weight and reaction from seabed with static equilibrium state. In other words, seabed conditions, i.e. configuretion, properties and others can be changed depending on its well location, pipe laying condition and other. Furthermore, it should be considered differently for reliable modeling of subsea pipe structures. Therefore, geotechnical survey data is becoming basic input for subsea structural design such as pile and pipeline/flowline resting on subsea. As offshore development is going to deepwater, typical seabed soil in deepwater is known as very soft or silty clays (Dunlap et al., 1990), but the distribution of clayey soil is significant regardless of water depth in offshore field. These clayey soils are carefully considered due to unknown behavior compared to other soil types such as sand and rocks. The movement of a pipe on soft clay seabed leads to excessive deformation or the failure of ground, as well as considerable penetration by high compressibility. Therefore, a number of research on clayey soil model to calculate more accurate and realistic embedment and resistance force have been carried out. The studies on embedment for catenary riser or offshore pipeline under buckling have been performed through full scale test of Joint Industry Projects (JIP) such as Steel Risers in Deepwater Environments (STRIDE, Bridge et al., 2003) and SAFEBUCK JIP (2010). Experiments that apply cyclic load to soil have been carried out to derive real soil behavior (Andersen et al., 1998; Cheuk and White, 2011) and empirical formulas and soil parameters have been suggested based on these studies. The research on numerical analyses considering simulation of heaved configuration or nonlinearity of soft clay like softening by remoulded soils under dynamic condition have been performed (Merifield et al., 2009; Randolph and Quiggin, 2009) and the consideration of dynamic laying effects is getting more significant for offshore pipeline/riser engineering due to the importance of pipe movement at touchdown zone (TDZ) (Cheuk and White, 2011; Westgate et al., 2010a; Yu et al., 2013; Park et al., 2015a; 2015b). So far, more studies on pipe-soil interaction have been conducted on Steel Catenary Riser (SCR) (Bridge et al., 2003; Bridge et al., 2004) and fatigue analyses of SCR with these effects have been researched (Elosta et al., 2013). Although the embedment effects for offshore pipeline resting on seabed or under installation and downtime condition are very important, this research on pipeline is relatively fewer. In this study, S-lay type which has a complex behavior under installation was adopted for the pipe embedment considering dynamic effects for offshore pipeline engineering. The pipeline laying analysis was performed with nonlinear hysteretic soil model for vertical pipe and soil interaction. The pipe embedment results by dynamic laying effects were reviewed via the comparison of results between guideline methods used in offshore pipeline engineering and numerical analysis in time domain. Critical parameters in nonlinear hysteretic soil model which have effects on pipe embedment with as-laid pipe condition were investigated from the sensitivity analyses. Finally, dynamic embedment factor by soil parameters was investigated and its tendency was analyzed.
SOIL MODELS AND DESIGN DATA Force-displacement soil models Representative soil models for a comparison of pipe embedment results on soft clay are presented in this section. It is to deal with not only soil models used in offshore pipeline engineering such as free span and on-bottom stability analyses, but also nonlinear soil models. Free span analysis by DNV-RP-F105 (DNV, 2006) Pipeline embedment is primarily caused by soil failure by upper loading. A pipe resting on a seabed can be considered as a strip foundation and the bearing capacity model is used to calculate the pipe. The bearing capacity of soil is the maximum downward intensity of load which the soil can resist without shear failure or excessive settlement. Thus, the bearing capacity should
Unauthenticated Download Date | 3/28/15 2:45 PM
Int. J. Nav. Archit. Ocean Eng. (2015) 7:227~243
229
be enough to support upper loads and occurred embedment should be below allowable depth. The vertical soil reaction force for clay soil with constant undrained shear strength for free span analysis of offshore pipeline based on DNV (2006) is as follows:
Rv = N c ⋅ Su ⋅ B + Ap ⋅ γ soil '
(1)
where N c = bearing capacity factors (= 5.14, shallow penetration, undrained condition), Su = undrained shear strength, for v ≤ 0.5 D 2 ( D − v)v ), B = contact width for pipe-soil load transfer ( = for v > 0.5 D D D = pipeline diameter,
v = vertical pipe penetration, Ap = cross-sectional area of penetrated of pipe, and γ soil ' = submerged unit weight of soil.
On-bottom stability by DNV-RP-F109 (DNV, 2010) This design code uses the formula applied based on the results for various industry study by Verley and Lund (1995) for the calculation of initial penetration depth and is applied for shear strength less than 70 kPa. This formula is indicated in Eq. (2). The unit weight of soil (saturated) and soil shear strength are the key parameters (Randolph and White, 2008). This empirical formula was derived based on lateral monotonic loading and considered as static model sometimes. This model considers the effect of passive resistance force and, not only single friction force. There is limitation as large-amplitude lateral movement is not considered. V = 0.0071 ⋅ Gc 0.3 D D ⋅ S u
z pi
3.2
V + 0.062 ⋅ Gc 0.3 D ⋅ S u
0.7
(2)
where z pi = initial penetration depth, D = pipeline diameter, V = vertical force per unit length, Su = shear strength; Gc = soil (clay) strength parameter (= Su / ( D ⋅ γ s ) ), and γ s = unit weight of soil. Soil model with pushed in pipe (PIP) by Merifield et al. (2009) Merifield et al. (2008) also analyzed about bearing parameters using numerical analysis and suggested the power law parameter a and b in the range 0 0.5
a
b
a
b
Smooth
4.97
0.23
4.88
0.21
Rough
6.73
0.29
6.15
0.15
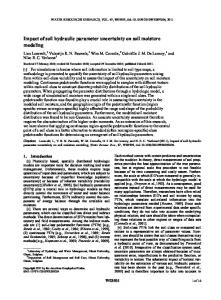
The power law coefficients in bearing factor consider the value for smooth boundary condition. The surface roughness, k for pipeline with concrete coating is about 0.0033 (1/300) m (DNV, 2006). If a function of roughness, k/D is under 10-4, it is included in smooth condition and if it is above 10-2, it belongs to rough condition. The pipe embedment results of smooth condition were identified about 15 to 20 % larger than rough condition through some analyses. Therefore, the results for rough condition will be estimated by sensitivity analyses of smooth condition. Nonlinear hysteretic soil model The nonlinear hysteretic soil model by Randolph and Quiggin (2009) was used in OrcaFlex (2013) as seabed model for an engineering analysis of catenary riser and pipeline. This model includes soil behaviors such as cyclic loading motion, uplift and suction. The study on cyclic loading was firstly performed by Andersen et al. (1998). After that, many nonlinear soil models were proposed (Aubeny et al., 2006; Randolph and Quiggin, 2009). The non-linear hysteretic soil model characteristics by Randolph and Quiggin (2009) are shown in Fig. 1. There are four penetration modes such as not-in-contact, initial penetration, uplift and repenetration. Initial penetration is generally modelled by the backbone curve while soil behavior is based on hyperbolic secant stiffness. Normal seabed reaction force (P) Ultimate suction resistance (Pu-suc)
I. Initial penetration
Ultimate penetration resistance (Pu )
VII. Repenetration following lift-off V. Suction releases with repenetration
IV. Suction decays (if uplift continues) VI. Further repenetration
III. Further uplift resisted by suction
II. Uplift
Penetration (z)
Fig. 1 Soil model characteristics for different modes (Randolph and Quiggin, 2009).
Unauthenticated Download Date | 3/28/15 2:45 PM
Int. J. Nav. Archit. Ocean Eng. (2015) 7:227~243
231
The ultimate resistance force building the backbone curve for initial penetration is shown below Eq. (4). The resistance force of soil is closer to the ultimate resistance force known as the backbone curve as the pipe penetration progresses.
= Pu N c ( z / D) ⋅ Su ⋅ D
(4)
where N c ( z / D)= a ⋅ ( z / D)b N c ( z / D) = bearing factor (= N c (0.1) ⋅ 10 ⋅ ( z / D) c N=
for z / D ≥ 0.1 ). for z / D < 0.1
In the initial penetration mode, the penetration resistance is given by
= P( z ) H IP (z ) ⋅ Pu ( z )
(5)
where H IP (z ) = hyperbolic factor (= z / [1 + z ] ), z = penetration, but non-dimensionalized to be in units of D / K max , and K max = pipe-soil stiffness The hyperbolic factor equals to 0 ( z = 0 ) as the initial penetration starts and it equals to 1/ 2 ( z = 1 , z = D / K max ), when z asymptotically approaches 1 as the penetration gets large compared to D / K max . In case of static analysis, the embedment is only calculated by the initial penetration mode. Other modes including uplift and repenetration are covered in the section related to sensitivity analysis using this nonlinear model. Design data for pipe embedment Before the estimation of pipe embedment, each pipe condition and applied vertical force for pipe embedment from four different methods, i.e. DNV-RP-F105 (DNV, 2006), DNV-RP-F109 (DNV, 2010), PIP by Merifield et al. (2009) and nonlinear soil model on very soft clay are compared in Table 2. In case of empirical formulas used in design code, water filled submerged pipe weight with zero lift force is assumed as the vertical force applied to seabed because pipe condition is under the installation of system test with shape of pipe resting on seabed. Most of these formulas are for initial embedment. On the other hand, nonlinear soil model with installation effect to estimate dynamic embedment considers pipe submerged weight with additional contact force by laying configuration. In dynamic installation condition, vessels response and pipe oscillation at TouchDown Zone (TDZ) due to environmental load causes more pipe embedment. The details on pipe condition and applied force for pipe embedment are summarized in Table 2. Table 2 Pipe condition and applied force for pipe embedment by soil models. Load Methods
Pipe condition
Applied load to seabed pipe
Maximum vertical force
Pipe shape
Zero lift force
Water filled submerged pipe weight
Pipe resting on the Seabed (only laid pipe is considered)
Contact force due to catenary configuration with void pipe condition
Pipe with laying configuration (e.g. S-lay, J-lay etc.)
DNV-RP-F105 DNV-RP-F109
Installation or system test
PIP Installation - Static Nonlinear soil model
Installation Dynamic
Vessel response and pipe movement due to environmental load
Unauthenticated Download Date | 3/28/15 2:45 PM
232
Int. J. Nav. Archit. Ocean Eng. (2015) 7:227~243
Target model The 32-inch pipeline data for the embedment calculation are summarized in Table 3. It includes pipe, material, soil, environmental and vessel data. The environmental and vessel data are for the dynamic embedment with laying effects using nonlinear soil model. The installation analysis is based on s-lay type. The pipeline is installed at water depth of 60 m and environmental data of combination between 1-yr and 10-yr return period values are used for the dynamic analysis. The vessel Response Amplitude Operator (RAO) data are also applied. Table 3 Input data for the pipe embedment. Categories
Items
Units
Values
Outside diameter
mm
813
Wall thickness
mm
20.6
Corrosion thickness
mm
4.2
kg ⋅ m −3
940
mm
95
kg ⋅ m −3
3,044
Pipe Corrosion coating density Concrete thickness Concrete coating density
kg ⋅ m
Steel density Young’s modulus
−3
7,850
MPa
207,000
-
0.3
MPa
450
-
Soft clay
kPa
2.1
N ⋅ m −3
16,150
Material Poisson ratio Specified minimum yield strength (SMYS) Soil type Undrained shear strength Soil
Dry unit soil weight
N ⋅m
Submerged unit soil weight
−3
Poisson’s ratio
-
0.495
Water depth
m
60
1-yr Significant wave height
m
10-yr 1-yr Environmental
Peak period 1-yr Steady current velocity 10-yr Wave and current to pipe axis
4.7 7.5
s
10-yr
11 13.3
m ⋅ s −1
0.29 0.33
deg
59.9
-
S-lay
Tensioner capacity
kN
2,400
Stinger radius
m
300
Lay type Vessel
6,090
Analysis condition for dynamic embedment The dynamic installation analysis was performed by OrcaFlex (2013) software developed by Orcina Ltd. The OrcaFlex (2013) is a fully 3D nonlinear time domain FE simulation code. It has been used in the offshore industry for the analysis of
Unauthenticated Download Date | 3/28/15 2:45 PM
Int. J. Nav. Archit. Ocean Eng. (2015) 7:227~243
233
metallic and flexible pipeline/risers from offshore structures such production platform, lay vessel, and tanker loading buoy, oceanographic mooring, pull-in analysis and others. Above all, Orcaflex includes non-isotropic sliding friction seabed and resilience seabed model. The modelling for pipeline installation analysis is shown in Fig. 2.
Fig. 2 Pipeline installation modelling using OrcaFlex (2013).
The normal lay condition with the vessel lay speed other than zero is not recommended through a number of research because the embedment result of this condition is less than in-place condition for downtime events such as repairing, welding and others (Westgate et al., 2010b; Sun et al., 2013). It means the application of normal lay condition is only insufficient for real pipe embedment under various conditions. In this study, the dynamic embedment was calculated by downtime events covering normal lay results. The number of cycle for lay vessel in place due to downtime events was computed as the total simulation time divided by wave period (i.e. based on the event duration and the wave period).
N=
Event time T
(6)
where
N = number of cycle, and T = wave period ( s ).
PIPE EMBEDMENT RESULTS ON SOFT CLAY Firstly, dynamic pipe embedment under installation condition was reviewed. Then pipe embedment results on soft clay calculated using the aforementioned empirical soil models and numerical methods were compared with field embedment data surveyed by SSS. The importance on dynamic embedment with nonlinear soil models was determined through a comparison of pipe embedment results. Dynamic embedment with laying effect Fig. 3 shows the pipe embedment by the number of cycles at TDP under two cases on RPV: a) 1-yr wave & 10-yr current, and b) 10-yr wave & 1-yr current. The irregular wave condition was applied for basic dynamic analysis, but it was difficult to judge the tendency of effect on number of cycle because wave train in time domain was irregular with different wave period and height respectively. Both results of airy wave theory showed same significant wave height and peak period under two RPV combinations, which caused a small increase after about 30 to 40 cycles. Although pipe embedment increased as the number of cycles rose under irregular wave condition, 100 cycles were selected for the dynamic analysis because the difference between 40 and 100 cycles in regular wave case was small and the simulation time was required above 100 cycles in TDZ for embedment calculation of installation cases for the cycle by cycle approach (Sun et al., 2013). In addition to these, major downtime event case should not be considered for installation condition with more than one hour. Therefore, the target simulation time
Unauthenticated Download Date | 3/28/15 2:45 PM
234
Int. J. Nav. Archit. Ocean Eng. (2015) 7:227~243
was about 800 sec., which corresponds to the 100 cycles at TDZ based on mean zero up crossing period. For this analysis, 1-yr wave and 10-yr current load combination was used as the conservative results to design offshore pipeline such as on-bottom stability and free span.
Embedment / Pipe diameter
1.2
Effect of wave & current RP on dynamic embedment
1.0
0.8 10-yr wave & 1-yr current
0.6
0.4
1-yr wave & 10-yr current Reference cycle
0.2 Regular wave (Airy) Irregular wave (JONSWAP)
0.0 0
50
100
150
200
250
300
350
Number of cycles
Fig. 3 Dynamic embedment by cycle by cycle approach. A comparison of pipe embedment results The pipe embedment results for shear strength of 2.1 kPa from various conditions and models such as initial embedment by empirical formula, static and dynamic embedment using numerical analysis with installation condition, and field embedment as-laid data after pipe installation are shown is Table 4. In this study, Side Scan Sonar (SSS) method has been applied to the aslaid 32-inch export pipeline for the field survey. Field survey was carried out using a ROV and the camera captures were digitized to read the actual pipe embedment after pipeline installation. The data covers about 13 km of length with 60 m of water depth. In case of difference of embedment between survey data and empirical formulas, that could be the reason of this study which was started to estimate more accurate seabed embedment by considering dynamic embedment. The soil model by Verlay and Lund in DNV-RP-F109 (DNV, 2010) caused conservative embedment with about one-third in comparison with the field data, and the result by bearing capacity model in DNV-RP-F105 (DNV, 2006) was calculated more than 3 times embedment of the field data. PIP by Merifield et al. (2009) led to small embedment as half of the field data. It was confirmed that pipe embedment result by formulas in design codes and empirical formula have limits in comparison with the field data. Among the results of numerical analysis using nonlinear hysteretic model, pipe embedment by dynamic installation was 0.5 D and below the mean value of field embedment. It is reasonable and may be judged as obvious condition in comparison to field embedment data. Table 4 Results of the pipe embedment by soil models (S u = 2.1 kPa). Field data Methods SSS
Empirical formulas Verlay and Lund
Bearing capacity
Numerical analysis
PIP by Merifield
Nonlinear hysteretic model Installation
Conditions Embedment/D
As-laid 0.56 (Mean)
System test 0.21
0.17
0.27
Unauthenticated Download Date | 3/28/15 2:45 PM
0.26
Static
Dynamic
0.10
0.50
Int. J. Nav. Archit. Ocean Eng. (2015) 7:227~243
235
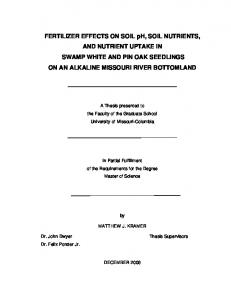
The results on pipe embedment range by shear strength in the range of soft clay are presented in below Fig. 4. Overall, as the shear strength of clayey soil was larger, the difference of pipe embedment results among each soil model had the tendency to decrease. Therefore, the accuracy on pipe embedment is more required in soft clay range, which means low shear strength. The discrepancy of pipe embedment for three conditions, i.e. system test and installation under static and dynamic using nonlinear soil model, depends on the applied vertical reaction force. Fig. 4(a) shows the ratio of vertical reaction force divided by pipe submerged unit weight under each condition. Static and dynamic installation analysis with catenary shape showed the increasing tendency by variation of shear strength. However, in the case of system test for initial embedment, vertical reaction force was regarded as water-filled submerged weight and was applied with same through total shear strength. At the reference shear strength of 2.1 kPa, the touchdown reaction force of about 2.9 times of pipe submerged weight was occurred in dynamic installation condition. Vertical reaction forces by effective pipe weight under each condition are shown in Fig. 4(b). As the effective pipe weight was calculated as the reaction force ( V ) divided by the product of shear strength and the pipe diameter increased, clay was close to soft with the decrease of shear strength. Normally, effective pipe weight greater than 2.5 means ‘heavy’ pipe and below 1.5 is considered as ‘light’ pipe. While most calculated dynamic vertical reaction force came under ‘heavy’ pipe, the static results included ‘light’ pipe. The cyclic movement including lateral and vertical direction at TDZ by environmental loading, vessel motion, laying condition and others in the time domain had many effects on vertical reaction force. 0.8
Pipe embedment on soft clay
Embedment / Pipe diameter
0.7
Max. field data Mean+S.D.
0.6
Mean Mean-S.D.
0.5
(Dynamic installation) Nonlinear soil model
0.4 0.3 0.2 0.1
(Static installation) Nonlinear soil model
(System test) Bearing capacity (System test) PIP by Merifield
(System test) Verlay & Lund
0.0 0
1
2
3
4
5
6
7
8
9
10
Undrained shear strength (kPa)
14
Vertical reaction force / Pipe submerged weight
Vertical reaction force / Pipe submerged weight
Fig. 4 Pipe embedment on soft clay.
Vertical reaction forces 12
Nonlinear soil model (Dynamic installation)
10 Reference Su (2.1kPa)
8 6 Nonlinear soil model (Static installation)
4 2
Empirical formula & Nonlinear soil model (System test)
0 0
3
6
9
12
15
18
21
24
27
30
14
Vertical reaction forces 12 10 8 6 Dynamic
4 System test
2 Static
0 0
1
2
3
4
5
6
7
8
Effective pipe weight (V/Su*D)
Shear strength, Su (kPa)
(a) Shear strength effects.
(b) Effective pipe weight effects. Fig. 4 Vertical reaction force.
Unauthenticated Download Date | 3/28/15 2:45 PM
9
10
236
Int. J. Nav. Archit. Ocean Eng. (2015) 7:227~243
SENSITIVITY ANALYSIS ON NONLINEAR SOIL MODEL PARAMETERS In this study, the nonlinear soil model is important for the calculation of dynamic embedment and if the critical parameters have not been fully understood, over simplification could also lead to a non-conservative design solution or bring out the opposite results. The sensitivity analysis on parameters of nonlinear soil model such as shear strength gradient, normalized secant stiffness, suction resistance ratio, and saturated soil density was performed within the values of soft clay range, and the tendency on pipe embedment was reviewed by the results through various values. Nonlinear soil parameters The selected parameters are shear strength gradient, normalized stiffness, saturated soil density, suction resistance ratio and saturated soil density. The ranges of all parameters are summarized in Table 5. The value ranges were determined for the properties of soft clay soils based on DNV (2006) and nonlinear soil model (Randolph and Quiggin, 2009). These parameters have effects on nonlinear soil behaviors such as initial penetration, uplift, suction and repenetration. Table 5 Parameters of nonlinear hysteretic soil model and their ranges. Parameters
Unit
Ranges
Shear strength gradient
kPa / m
0
0.5
1
1.5
2
2.5
Secant stiffness Suction resistance factor Saturated soil density
-
50
100
150
200
250
300
0.5
0.6
0.7
0.8
0.9
1
1,450
1,500
1,550
1,600
1,646
1,700
-
kg / m
3
Pipe embedment by nonlinear soil model parameters Shear strength gradient First of all, shear strength gradient is confirmed through undrained shear strength ( Su ) at soil depth, z and shown in Eq. (7). As the seabed depth is getting deeper, shear strength increased. An increase of shear strength from mudline to penetration depth is controlled by the shear strength gradient and it increases the ultimate resistance limit as well.
Su ( z ) = Su 0 + ρ ⋅ z
(7)
where Su 0 = undrained shear strength at mudline, and ρ = soil undrained shear strength gradient. Shear strength gradient distribution for sensitivity analysis is illustrated in Fig. 5, with the shear strength at mudline of 2.1 kPa. As the shear strength gradient is increased, the soil was stiffer below the seabed mudline. The value of shear strength gradient varied from 0 ~ 2.5 kPa/m with the increase of 0.5 kPa/m. Shear strength gradient distribution
Depth drom the seabed
0.0
0.5
1.0
1.5
2.0
2.5
3.0
0.0
0.5
1.0 Sug=0.0 kPa/m
0.5kPa/m
1.0kPa
1.5kPa
2.0kPa
1.5
Fig. 5 Shear strength gradient distribution.
Unauthenticated Download Date | 3/28/15 2:45 PM
2.5kPa
Int. J. Nav. Archit. Ocean Eng. (2015) 7:227~243
237
As the shear strengh under mudline increased, the pipe embedment decreased as portrayed in Fig 6(a). The pipe embedment at shear strength gradient of 0 kPa/m was about 0.5 pipe diameter and it was reduced about 0.39 pipe diameter at shear strength gradient of 2.5 kPa/m. The distance of TDZ displayed small reduction when the pipe embedment decreased also. The decreased pipe movement at TDZ was due to the incresed stiffness by increasing shear strength gradient and normally, pipe movement at TDZ causes much larger embedment depth. Increase of shear strength and its gradient under mudline has proportional relation with seabed normal resistance, and the seabed bearing pressure, which is the ratio of normal resistance divided by pipe diameter, showed the tendency to increse. The maximum bearing pressure was about 14.5 kPa at shear strength gradient of 2.5 kPa/m as shown in Fig. 6(b). However, at the same shear strength, the pipe embedment increased as the bearing pressure incresed.
(a) Pipe embedment. (b) Seabed normal bearing pressure. Fig. 6 Pipe embedment and normal bearing pressure by shear strength gradient variation. Normalized secant stiffness The normalized secant stiffness is used for the parameter, z which is the ratio of penetration and D / K max . The relations among stiffness, parameter z , and hyperbolic factor are proportional through the formulas above, and the penetration resistance increases as the values of these parameters are larger. In case of uplift mode, it is considered as dynamic stiffness (blue line in Fig. 7). The distance from start point of uplift mode to zero point of soil resistance force is called a mobilization distance, and the behavior in this stage forms the basis for dynamic pipe and soil interaction. It is a function of pipeline diameter and used symbol, Λ. Its value is about 10 % of pipe outside diameter (Poulos, 1988). In soft clay, the pipe-soil stiffness is in the range from 150 to 250 for the ultimate net bearing pressure (Bridge et al., 2004; Clukey et al., 2005). Normal seabed reaction force (P) Ultimate suction resistance (Pu-suc)
Ultimate penetration resistance (Pu )
Initial penetration static stiffness
Stiffness after initial penetration Mobilization distance (ΛD)
Uplift Penetration (z)
Fig. 7 Static and dynamic soil stiffness (Bridge, 2005).
Unauthenticated Download Date | 3/28/15 2:45 PM
238
Int. J. Nav. Archit. Ocean Eng. (2015) 7:227~243
As the stiffness was larger, the pipe embedment decreased in static analyses results. In case of static analysis, only the initial penetration and not-in contact modes in nonlinear soil model were used. In light of the static analyses results, the relation between stiffness and pipe embedment was inversely proportional in the initial penetration mode. This tendency was confirmed in Fig. 8. The stiffness effect in dynamic analysis showed proportional relation tendency on pipe embedment. Unlike static analysis, the stiffness had effect on all modes including initial penetration, uplift, suction, and repenetration of nonlinear hysteretic model.
Embedment / Pipe diameter
0.6
Secant stiffeness 0.5 Dynamic embedment
0.4 0.3 0.2
Static embedment
0.1 0.0 0
50
100
150
200
250
300
350
Normalized secant stiffeness
Fig. 8 Pipe embedment for normalized secant stiffness. Detailed behavior between pipe and seabed soil by increasing normalized stiffness can be observed in Fig. 9. The hysteretic loop repeated about 100 numbers of cycles with all cases. As the stiffness increased, the ultimate bearing pressure increased as well in the initial penetration mode, and then the mobilization distance related to stiffness gradient decreased in the uplift mode. As a result, the pipe embedment increased with increased stiffness under dynamic condition.
Normal bearing pressure (kPa) -4
0
4
Vertical depth from seabed / Diameter
0.0
8
12 Kmax = 50 Kmax = 150 Kmax = 250
-0.1
-0.2
-0.3
-0.4
-0.5
-0.6
Fig. 9 Pipe embedment behavior by normalized secant stiffness.
Unauthenticated Download Date | 3/28/15 2:45 PM
Int. J. Nav. Archit. Ocean Eng. (2015) 7:227~243
239
Suction resistance ratio As the penetration force reduces to zero, this allows the soil to rebound as the pipe moves upwards under uplift mode. After that, as the pipe continues to move upwards, the pipe and soil suction between the soil and the pipe causes a tensile force that resists the motion of the pipe. The soil suction force is determined largely on the pull-out velocity, consolidation time and consolidation load during model test. In nonlinear soil model, the suction resistance ratio has an effect on ultimate suction resistance limit and has the value from zero to unity. However, the values between 0.5 and 1 are recommended for uplift motion as the optimum value (Randolph and Quiggin, 2009). Its formula can be seen in Eq. (8), and when suction resistance ratio, f suc is in unity, it produces a backbone curve for the ultimate suction resistance force. In the uplift mode, pipe embedment is reduced by gradually approaching to the ultimate suction resistance.
− f suc ⋅ Pu ( z ) Pu − suc =
(8)
where f suc = suction resistance ratio, and Pu ( z ) = ultimate penetration resistance as penetration, z . The increasing suction resistance ratio increases of the pipe embedment. It is the reason why the hysteretic loop under pipesoil behavior was expanded as the ultimate suction resistance due to the increase of suction ratio factor. There was no change in the ultimate normal bearing pressure because the suction resistance ratio only had uplift and suction mode. The alteration of ultimate suction resistance by suction ratio variation is confirmed in Fig. 10.
Normal bearing pressure (kPa) -4
0
4
Vertical depth from seabed / Diameter
0.0
8
12 fsuc = 0.6 fsuc = 0.8 fsuc = 1.0
-0.1
-0.2
-0.3
-0.4
-0.5
-0.6
Fig. 10 Pipe embedment by suction resistance ratio variation.
Saturated soil density The range of saturated soil density, which is the sum of submerged soil density and seawater density, was calculated based on DNV (2006). Variation of saturated soil density has an effect on soil extra buoyancy force for the pipe element that displaces soil, which has a higher saturated density than the water by heaved soil. The soil extra buoyancy force is calculated using Eq. (9).
Unauthenticated Download Date | 3/28/15 2:45 PM
240
Int. J. Nav. Archit. Ocean Eng. (2015) 7:227~243
Extra soil buoyancy force = fb ⋅ Adisp ⋅ ( rr soil − sea ) ⋅ g
(9)
where f b = soil buoyancy factor (= 1 + 1 / λ ), λ = berm geometry parameter, Adisp = displacement area below seabed tangent plane, ρ soil = saturated soil density, and ρ sea = seawater density. Increase of soil extra buoyancy force led to the increase of the ultimate resistance limit. Fig. 11 shows the behavior of pipe embedment by saturated soil density variation. At the saturated soil density of 1,645 kg/m3, the maximum ultimate normal bearing pressure was observed. Although the saturated soil density had an effect on ultimate resistance values, constant mobilization distance at each saturated soil density was confirmed due to steady stiffness. In conclusion, the pipe with heaved soil by larger saturated soil density was caused by less embedment. Normal bearing pressure (kPa) -4
0
4
Vertical depth from seabed / Diameter
0.0
8
12
ρsat = 1,450 kg/m3 ρsat = 1,550 kg/m3 ρsat = 1,646 kg/m3
-0.1
-0.2
-0.3
-0.4
-0.5
-0.6
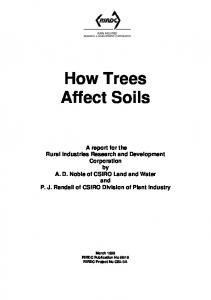
Fig. 11 Pipe embedment by saturated soil density variation. Dynamic embedment factors (DEF) The dynamic embedment factor, which is the ratio of dynamic embedment divided by static embedment, is non-dimensioned parameter to evaluate pipe embedment by dynamic condition. It has been previously mentioned that the dynamic embedment factor is the range from 2.0 to 10.0 (Merifield et al., 2008). However, it is difficult to decide critical or important parameter for pipe embedment through these wide range of values. On the other hand, the narrower range between 1.0 ~ 3.5 by Westgage et al. (2010a) was reported, but it was not sensitive to horizontal motion, as regular horizontal oscillation and only constant vertical load were used. To estimate more accurate embedment, dynamic embedment is important through the comparison of calculated pipe embedment and along with this result, the understanding of nonlinear soil model is needed. Based on the sensitivity analysis on nonlinear soil parameters such as shear strength gradient, normalized stiffness, suction resistance factor and saturated soil density, dynamic embedment factor of about 5 was derived. It means the resulted dynamic embedment was about 5 times of static embedment. The normalized secant stiffness had large variation of DEF from 4.0 to 5.3. The effect of shear strength gradient to DEF was the smallest below 4.9, and this parameter only decreased pipe embedment. An approximately linear trend line of DEF was drawn by nonlinear soil parameter variation shown in Fig. 12.
Unauthenticated Download Date | 3/28/15 2:45 PM
Int. J. Nav. Archit. Ocean Eng. (2015) 7:227~243
241
5.6 5.2
DEF = 0.065 Sug2 - 0.416 Sug + 4.907 R2 = 0.999
4.8 4.4 4.0
Dynamic embedment factor (DEF)
0.0
0.5
1.0
1.5
2.0
2.5
Shear strength gradient (Sug, kPa/m) 5.6 5.2 4.8
DEF = 2.387 Kmax0.142 R2 = 0.985
4.4 4.0 50
100
150
200
250
300
Normalized secant stiffenss (Kmax) 5.6 5.2 4.8
DEF = 0.742 fsuc + 4.478 R2 = 0.998
4.4 4.0 0.5
0.6
0.7
0.8
0.9
1.0
Suction resistance factor (fsuc) 5.6 5.2 4.8
DEF = -0.002 ρsat + 8.205 R2 = 0.994
4.4 4.0 1450
1500
1550
1600
Satruated soil density (ρsat,
1650
1700
kg/m3)
Fig. 12 Dynamic embedment factor by nonlinear soil parameters.
CONCLUDING REMARKS In this paper, the estimation of pipe embedment in offshore pipeline engineering such as on-bottom stability and free span was reviewed and the limit of pipe embedment on soft clay based on empirical formula was confirmed. Therefore, the importance of dynamic embedment with installation effect representing more accurate pipe embedment was verified in comparison with field data of embedment by SSS. The sensitivity analysis on soil parameters within the ranges of soft clay soil of nonlinear hysteretic soil models that affect on dynamic embedment was performed, and the tendencies on pipe embedment were investigated as dynamic embedment factor. The results are summarized as below. 1) The results of initial embedment had the differences of the minimum 2 times and the maximum 3.3 times embedment of the mean value of field embedment data by SSS survey, except for the embedment by nonlinear hysteretic soil model. In case of dynamic installation condition based on nonlinear soil model, similar pipe embedment as 0.5 D in comparison with as-laid embedment data was estimated by considering pipe condition in field. 2) The number of cycle over 100 at TDZ could be required for the dynamic embedment with installation effects to represent the downtime event under installation condition, and this result was validated with field embedment. 3) The behavior between pipe and soil under dynamic condition and the effects on embedment by soil parameters of nonlinear hysteretic model were identified. Dynamic embedment factor by shear strength gradient was reduced to 4.3. The suction
Unauthenticated Download Date | 3/28/15 2:45 PM
242
Int. J. Nav. Archit. Ocean Eng. (2015) 7:227~243
factor and saturated soil density brought about 5 times compared with static embedment, and secant stiffness had dynamic embedment factor of about 4.0 to 5.3. 4) Estimated dynamic embedment factor and nonlinear soil behaviors under pipe embedment on soft clay by soil parameters should be the indicators to judge dynamic effects for pipe embedment compared with static conditions. The effects on various environmental data and laying vessel conditions on dynamic behavior of pipe embedment for more general DEF results will be performed in further study.
ACKNOWLEDGEMENT This work was supported by the Energy Efficiency & Resource of the Korea Institute of Energy Technology Evaluation and Planning (KETEP) grant funded by the Korea government Ministry of Knowledge Economy (Grant Number: 20143010021870). This research was also supported by Training Program for Advanced Engineering Experts (No. : H2001-13-1001) funded by the Ministry of Trade, Industry and Energy, Republic of Korea. In addition, the authors acknowledge for support of Graduate School of Engineering Mastership (GEM), Pohang University of Science and Technology (POSTECH), POSCO, PETRONAS and Offshore Engineering Center UTP (OECU). The OECU is an emerging research consultancy centre in Malaysia and subinstitution of Deepwater Technology Mission Oriented Research (MOR). Since its inception, OECU has been active in the support of PETRONAS Carigali SKG 11 offshore ventures and researches.
REFERENCES Andersen, K.H., Kleven, A. and Heien, D., 1998. Cyclic soil data for design of gravity structures. Journal of Geotechnical Engineering, 114(5), pp.517-539. Aubeny, C.P., Shi, H. and Muff, J.D., 2005. Collapse loads for cylinder embedded in trench in cohesive soil. International Journal for Geomechanics, 5(4), pp.320-325. Aubeny, C.P., Biscontin, G. and Zhang, J., 2006. Seafloor interaction with steel catenary risers. Final project report (Number: 510, Task order: 35988). Houston: Texas A&M University. Bridge, C., 2005. Effects of seabed interaction on steel catenary risers. Ph.D. Dissertation. University of Surrey, Guildford, Surrey, UK. Bridge, C., Howells, H., Toy, N., Parke, G. and Woods, R., 2003. Full scale model tests of a steel catenary riser, Technical paper. Houston: Fluid Structure Interaction, 2H Offshore. Bridge, C., Laver, K., Clukey, E. and Evans, T., 2004. Steel catenary riser touchdown point vertical interaction models. Offshore Technology Conference (OTC 2004), 3-6 May Houston, USA (OTC 16628). Cheuk, C.Y. and White, D.J., 2011. Modelling the dynamic embedment of seabed pipelines. Géotechnique, 61(1), pp.39-57. Clukey, E.C., Haustermans, L. and Dyvik, R., 2005. Model tests to simulate riser-soil interaction effects in touchdown point region. In: Proceedings of the International Symposium on Frontiers in Offshore Geotechnics (ISFOG 2005), Perth, Australia, 19-21 September 2011, pp.651-658. DNV, 2006. Free spanning pipelines. Recommended practice. DNV-RP-F105. Oslo: Det Norske Veritas. DNV, 2010. On-bottom stability design of submarine pipelines. Recommended practice. DNV-RP-F109. Oslo: Det Norske Veritas. Dunlap, W.A., Bhojanala, R.P. and Morris, D.V. 1990. Burial of vertically loaded offshore pipelines in weak sediments. The 22nd Offshore Technology Conference, Houston, USA, 7-10 May 1990 (OTC 6375). Elosta, H., Huang, S. and Incecik, A., 2013. Dynamic response of steel catenary riser using a seabed interaction under random loads. Ocean Engineering, 69(1), pp.34-43. Merifield, R.S., White, D.J. and Randolph, M.F., 2008. The ultimate undrained resistance of partially embedded pipelines. Geotechnique, 58(6), pp.461-420. Merifield, R.S., White, D.J. and Randolph, M.F., 2009. Effect of surface heave on response of partially embedded pipelines on clay. Journal of Geotechnical and Geoenvironmental Engineering, 135(6), pp.819-829. OrcaFlex, 2013. OrcaFlex manual version 9.6C. Cumbria: Orcina Ltd.
Unauthenticated Download Date | 3/28/15 2:45 PM
Int. J. Nav. Archit. Ocean Eng. (2015) 7:227~243
243
Park, K.S., Choi, H.S., Kim, D.K., Yu, S.Y. and Kang, S.C., 2015a. Structural analysis of deepwater steel catenary riser using OrcaFlex. Journal of Ocean Engineering and Technology, 29(1), pp.16-27. Park, K.S., Kim, Y.T., Kim, D.K., Yu, S.Y. and Choi, H.S., 2015b. A new method for strake configuration design of Steel Catenary Riser. Ships and Offshore Structures, In-press (http://dx.doi.org/10.1080/17445302.2014.999479). Poulos, H.G., 1988. Marine geotechnics. London: Unwin Hyman Ltd. Randolph, M.F. and Quiggin, P., 2009. Non-linear hysteretic seabed model for catenary pipeline contact. The 28th International Conference on Ocean, Offshore and Arctic Engineering (OMAE 2009), Honolulu, USA, 31 May - 5 June 2009 (OMAE2009-79259). Randolph, M.F. and White, D.J., 2008. Pipeline embedment in deep water: quantification and processes. The 40th Offshore Technology Conference (OTC 2008), Houston, USA, 5-8 May 2008 (OTC 19128). SAFEBUCK JIP, 2010. Phase I, II, III and GEO, joint industry project. [online] Avaliable at: Sun, J., Chang, G.A. and Liu, X., 2013. On the prediction of pipeline as-laid embedment using a cycle by cycle approach for deepwater application. The 32nd International Conference on Ocean, Offshore and Arctic Engineering (OMAE 2013), Nantes, France, 9-14 June 2013 (OMAE2013-10485). Verley, R.L.P. and Lund, K.M., 1995. A soil resistance model for pipeline placed on clay soils. Proceedings of the 14th International Conference on Ocean, Offshore and Arctic Engineering (OMAE 1995), Copenhagen, Denmark, 18-22 June 1995, pp.225-232. Westgate, Z.J., White, D.J. and Randolph, M.F., 2010a. Pipeline laying and embedment in soft fine-grained soils: field observations and numerical simulations. The 42th Offshore Technology Conference (OTC 2010), Houston, USA, 3-6 May 2010 (OTC-20407). Westgate, Z.J., Randolph, M.F., White, D.J. and Li, S., 2010b. The influence of sea state on as-laid pipeline embedment: A case study. Applied Ocean Research, 32(3), pp.321-331. Yu, S.Y., Choi, H.S., Lee, S.K., Do, C.H. and Kim, D.K., 2013. An optimum design of on-bottom stability of offshore pipelines on soft clay. International Journal of Naval Architecture and Ocean Engineering, 5(4), pp.598-613. Yu, S.Y., Choi, H.S., Lee, S.K. and Kim, D.K., 2014. Trend and review of corrosion resistant alloy (CRA) for offshore pipeline engineering. Journal of Ocean Engineering and Technology, 28(1), pp.85-92.
Unauthenticated Download Date | 3/28/15 2:45 PM