Statistica Sinica 23 (2013), 989-1017 doi:http://dx.doi.org/10.5705/ss.2011.246
NONSTATIONARY SPATIAL MODELING USING PENALIZED LIKELIHOOD Yin-Ping Chen and Hsin-Cheng Huang National Central University and Academia Sinica
Abstract: We consider nonstationary spatial modeling using empirical orthogonal functions (EOFs) under the consideration that data may be observed only at some sparse, irregularly spaced locations with repeated measurements. Instead of obtaining EOFs by principal component analysis based on a class of pre-specified basis functions or a pre-smoothing step with data imputed on a regular grid, we propose a regularization approach using penalized likelihood, which provides a new EOF-type expansion in terms of a small number of functions with their degrees of smoothness controlled by a tuning parameter. An expectation-conditional-maximization algorithm is applied to obtain the penalized maximum likelihood estimates of the mean and the covariance parameters simultaneously. Some simulation results show that the proposed method performs well in both spatial prediction and covariance function estimation, regardless of whether the underlying spatial process is stationary or nonstationary. In addition, the method is applied to analyze precipitation in Colorado. Key words and phrases: Empirical orthogonal function, Karhunen Lo´eve expansion, smoothing splines, spatial prediction, thin-plate splines.
1. Introduction The empirical orthogonal function (EOF) technique, termed by Lorenz (1956) in meteorology, is an effective tool for nonstationary spatial modeling. It can be regarded as an extension of the conventional principal component analysis (PCA) to a continuous spatial domain in terms of some basis functions (Obukhov (1960); Holmstr¨om (1963); Obled and Creutin (1986)). An early review of EOF analysis can be found in Alishouse et al. (1967). Some more recent reviews on EOF analysis are provided by Wilks (1995), Preisendorfer (1988), Jolliffe (2002), Hannachi, Jolliffe, and Stephenson (2007), and Cressie and Wikle (2011). The aim of EOF analysis is to achieve a low dimensional representation of a continuous spatial (or spatial-temporal) process and its covariance function. Consider a sequence of zero-mean nonstationary Gaussian spatial processes {Yt (s) : s ∈ D} defined on a compact region D ⊂ Rd , which have a common covariance function CY (s, s′ ) ≡ cov(Yt (s), Yt (s′ )), s, s′ ∈ D, for t ∈ N ≡ {1, 2, . . .}.
990
YIN-PING CHEN AND HSIN-CHENG HUANG
If CY (·, ·) is continuous, then Yt (s) is known to possess the following biorthogonal decomposition: ∞ ∑ Yt (s) = wt,k ϕk (s), (1.1) k=1
where wt,k ∼ N (0, λk ), for k, t ∈ N, are uncorrelated variables with λ1 ≥ λ2 ≥ ∫ · · · ≥ 0, ϕk (·)’s are orthonormal functions in the sense that D ϕk (s)ϕk′ (s)ds = δk,k′ , and δk,k′ denotes the Kronecker delta. The decomposition (1.1) is called the Karhunen-Lo`eve expansion (Karhunen (1947); Lo`eve (1978)). It follows that ∫ wt,k = D Yt (s)ϕk (s)ds, k, t ∈ N, and the covariance function, CY (s, s′ ), satisfies ∑ ′ CY (s, s′ ) = ∞ k=1 λk ϕk (s)ϕk (s ). Thus ϕk (·)’s are the solutions of the Fredholm integral equation: ∫ CY (s, s′ )ϕk (s′ )ds′ = λk ϕk (s), s ∈ D, k ∈ N, (1.2) D
where ϕk (·) is the kth eigenfunction of CY (·, ·) and λk is the corresponding eigenvalue. In practice, CY (·, ·) is unknown and the process Yt (·) is only observed at some finite number of locations. Hence the ϕk (·)’s and λk ’s have to be estimated from data. There are basically two approaches when the data locations are irregularly located. One approach is to restrict the ϕk (·)’s to a function space generated by some pre-specified basis functions (e.g., Cohen and Jones (1969); Deville (1974); Creutin and Obled (1982); Obled and Creutin (1986); Braud, Obled, and Phamdinhtuan (1993)). Then the conventional or a spatially weighted version of PCA can be directly applied. Nevertheless, the resulting eigenfunction estimates may be sensitive to the choice of the basis functions. The other approach utilizes a two-step procedure by first imputing data at each t on a fine grid, and then applying the conventional PCA to the processed data (e.g., Karl, Koscielny, and Diaz (1982); Wikle and Cressie (1999)). However, this approach may be sensitive to the choice of a smoothing method and is likely to underestimate the variances at locations where there are few data nearby. In this paper, we derive a likelihood-based approach for EOF analysis incorporating the possibility that the data locations may be sparse and irregularly spaced. Instead of applying a two-step procedure, we propose a regularization approach under the penalized likelihood framework; this provides a new estimation method of EOFs with degrees of smoothness controlled by a tuning parameter. In addition, we incorporate a stationary process in the model similar to that considered by Wikle and Cressie (1999), which allows us to reduce the model dimension further.
NONSTATIONARY SPATIAL MODELING USING PENALIZED LIKELIHOOD
991
The article is outlined as follows. Section 2 introduces our model and the proposed penalized likelihood method, as well as some formulae for spatial prediction. Section 3 develops an expectation-conditional-maximization (ECM; Meng and Rubin (1993)) algorithm for simultaneous estimation of the mean and the covariance parameters. Some simulation results on one- and two-dimensional spaces are given in Section 4, and an application of our method to precipitation in Colorado is given in Section 5. Finally, Section 6 contains a brief discussion. 2. The Proposed Method Consider a sequence of Gaussian (nonstationary) spatial processes {Yt (s) : s ∈ D} of interest defined on a compact region D ⊂ Rd , which are independent at time t ∈ N. Suppose that data Zt = (Zt (s1 ), . . . , Zt (sn ))′ are observed at locations s1 , . . . , sn and times t = 1, . . . , T , with added Gaussian white noise according to Zt (si ) = Yt (si ) + εt (si ), with εt (si ) ∼ N (0, σε2 ),
i = 1, . . . , n.
(2.1)
Motivated by (1.1), we propose a model for {Yt (s) : s ∈ D} as ′
Yt (s) = xt (s) β +
K ∑
wt,k ϕk (s) + ξt (s),
s ∈ D, t ∈ N,
(2.2)
k=1
where xt (s) is the p-vector regressor at location s, β is the corresponding regression parameter vector, wt,k ∼ N (0, λk ), k = 1, . . . , K, are uncorrelated, ϕk (·)’s are unknown functions, and ξt (·) is a zero-mean stationary spatial process with its covariance function parameterized by θξ , and independent of the wt,k ’s. We can rewrite Zt in matrix form as Zt = Xt β + ΦK wt + ξt + εt , t = 1, . . . , T, (2.3) ( )′ where Xt ≡ xt (s1 ), . . . , xt (sn ) , ϕk ≡ (ϕk (s1 ), . . . , ϕk (sn ))′ , k = 1, . . . , K, ΦK ≡ (ϕ1 , . . . , ϕK ), wt ≡ (wt,1 , . . . , wt,K )′ , ξt ≡ (ξt (s1 ), . . . , ξt (sn ))′ , and εt ≡ (εt (s1 ), . . . , εt (sn ))′ . As in Wikle and Cressie (1999), we consider a stationary component ξt for global behavior which, as to be shown in simulations, is effective in further reducing the model dimension. Let Vξ (θξ ) ≡ var(ξt )/σε2 . Then the covariance matrix of Zt can be written as ΣZ (θ) ≡ var(Zt ) =
K ∑
λk ϕk ϕ′k + σε2 (Vξ (θξ ) + In ),
k=1
where θ ≡ (λ1 , . . . , λK , ϕ′1 , . . . , ϕ′K , σε2 , θξ′ )′ consists of all the covariance parameters.
992
YIN-PING CHEN AND HSIN-CHENG HUANG
2.1. Penalized maximum likelihood For simplicity, we take d = 1, 2. We consider a penalized maximum likelihood (PML) method for estimating β and θ with the roughness penalties J(ϕ1 ), . . . , J(ϕK ) imposed on the functions, ϕ1 (·), . . . , ϕK (·), leading to the objective function T log |ΣZ (θ)|+
T ∑
(Zt −Xt β)′ Σ−1 Z (θ)(Zt −Xt β)+α(J(ϕ1 )+· · ·+J(ϕK )), (2.4)
t=1
subject to an identifiability constraint, ϕ′k (Vξ (θξ ) + In )−1 ϕk = 1, where α > 0 is a smoothing parameter and the roughness penalty ∫ (ϕ′′k (s))2 ds, D {( 2 ) ( 2 ) ∫ ∂ ϕk (x, y) 2 ∂ ϕk (x, y) 2 +2 J(ϕk ) = ∂x2 ∂x∂y s=(x,y)∈D ( 2 )2 } ∂ ϕk (x, y) + ds , ∂y 2
k = 1, . . . , K, has the form for d = 1,
for d = 2.
Note that the minimizers for ϕ1 (·), . . . , ϕK (·) in (2.4) are natural cubic splines and thin-plate splines with knots at {s1 , . . . , sn } for d = 1 and d = 2, respectively (see Green and Silverman (1994)). Also note that when Vξ (θξ ) is assumed to be 0, the cost function (2.4) is similar to those considered by Yao, M¨ uller, and Wang (2005) and Huang, Shen, and Buja (2008) in a least squares setting for analyzing sparse longitudinal data. For d = 1, Green and Silverman (1994) showed that J(ϕk ) can be written in the form of ϕ′k Ωϕk , k = 1, . . . , K. Specifically, Ω can be expressed in terms of hi ≡ si+1 − si , i = 1, . . . , n − 1, as Ω = QP −1 Q′ , where Q is an n × (n − 2) banded matrix with entries h−1 if j = k = 1, . . . , n − 2, k , −1 −1 −h − h , if j = k + 1 = 2, . . . , n − 1, k k+1 qj,k = h−1 if j = k + 2 = 3, . . . , n, k+1 , 0, otherwise, and P is an (n − 2) × (n − 2) banded symmetric matrix with entries h +h k k+1 , if j = k = 1, . . . , n − 2, 3 pj,k = hk+1 if |j − k| = 1, k = 1, . . . , n − 3, 6 , 0, otherwise.
NONSTATIONARY SPATIAL MODELING USING PENALIZED LIKELIHOOD
993
Similarly for d = 2, it follows from Green and Silverman (1994) that J(ϕk ) = ϕ′k Ωϕk , k = 1, . . . , K, where Ω = E −1 − E −1 T ′ (T E −1 T ′ )−1 T E −1 , T is a 3 × n matrix with the ith column (1, s′i )′ , E is an n × n symmetric matrix with the (i, j)th entry Eij = η(∥si − sj ∥), and η(r) = (1/8π)r2 log r. Consequently, the penalized log-likelihood of (2.4) can be rewritten in matrix form as ℓZ (β, θ) ≡ T log |ΣZ (θ)| +
T ∑
′ (Zt − Xt β)′ Σ−1 Z (θ)(Zt − Xt β) + α tr(ΦK ΩΦK ) ,
t=1
(2.5) subject to ϕ′k (Vξ (θξ ) + In )−1 ϕk = 1, k = 1, . . . , K. We estimate both β and θ simultaneously by minimizing (2.5) using an ECM algorithm (Meng and Rubin (1993)) with details given in Section 3. The smoothness parameter α can be selected using cross-validation (CV, see examples in Sections 4 and 5). 2.2. Spatial prediction When both β and θ are known, the minimum mean squared error predictor of Yt (s) is Ybt (s) ≡ E(Yt (s)|Zt ) = xt (s)′ β + σY (s)′ Σ−1 Z (θ)(Zt − Xt β),
s ∈ D,
(2.6)
where σY (s) ≡ cov(Yt , Yt (s)) =
K ∑
λk ϕk (s)ϕk + σε2 vξ (s)
k=1
and vξ (s) ≡
1 cov(ξt , ξt (s)). σε2
The corresponding mean squared prediction error (MSPE) of Ybt (s) is ( )2 MSPE(s) ≡ E Ybt (s) − Yt (s) = CY (s, s) − σY (s)′ Σ−1 Z (θ)σY (s), where CY (s, s′ ) ≡
K ∑
λk ϕk (s)ϕk (s′ ) + Cξ (s, s′ )
k=1
and
Cξ (s, s′ ) ≡ cov(ξt (s), ξt (s′ )).
(2.7)
994
YIN-PING CHEN AND HSIN-CHENG HUANG
( )2 Alternatively, for s ∈ D, Ybt (s) and E Ybt (s) − Yt (s) can be written as: ) ( Ybt (s) = E E(Yt (s)|Zt , wt ) Zt = xt (s)′ β + ϕ(s)′ E(wt |Zt ) ( ) +vξ (s)′ (Vξ + In )−1 Zt − Xt β − ΦK E(wt |Zt ) ,
(2.8)
MSPE(s) = var(Yt (s)|Zt ) ) ) ( ( = E var(Yt (s)|Zt , wt ) Zt + var E(Yt (s)|Zt , wt ) Zt ) ( = E var(ξt (s)|Zt , wt ) Zt ( ( ) ) +var ϕ(s)′ wt + vξ (s)′ (Vξ + In )−1 Zt − Xt β − ΦK wt Zt ) ( = E var(ξt (s)|Zt , wt ) Zt (( ) ) +var ϕ(s)′ − vξ (s)′ (Vξ + In )−1 ΦK wt Zt = var(ξt (s)) − σε2 vξ (s)′ (Vξ + In )−1 vξ (s) ( )′ + ϕ(s) − Φ′K (Vξ + In )−1 vξ (s) ( ) ×var(wt |Zt ) ϕ(s) − Φ′K (Vξ + In )−1 vξ (s) ,
(2.9)
where ϕ(s) ≡ (ϕ1 (s), . . . , ϕK (s))′ and, for simplicity, Vξ (θξ ) is written as Vξ . Equations (2.8) and (2.9) allow us to compute Ybt (s) more efficiently than those given by (2.6) and (2.7), because E(wt |Zt ), var(wt |Zt ) and (Vξ + In )−1 are byproducts of the proposed ECM algorithm (see Section 3). When β is unknown, we can plug-in the generalized least squares estimate βbgls =
(∑ T
Xt′ Σ−1 Z (θ)Xt
)−1 ( ∑ T
t=1
Xt′ Σ−1 Z (θ)Zt
) ,
t=1
for β in (2.8), resulting in the universal kriging predictor (see Cressie (1993)) of Yt (s) given by Ybt (s) = xt (s)′ βbgls + ϕ(s)′ E(wt |Zt ) ( ) +vξ (s)′ (Vξ + In )−1 Zt − Xt βbgls − ΦK E(wt |Zt ) .
(2.10)
The corresponding MSPE can be written as ′
′
MSPEuk (s) = MSPE(s) + (xt (s) − σY (s)
(∑ T
Σ−1 Z (θ)Xt )
Xt′ Σ−1 Z (θ)Xt
)−1
t=1 ′
′
×(xt (s) − σY (s)
′ Σ−1 Z (θ)Xt ) .
(2.11)
NONSTATIONARY SPATIAL MODELING USING PENALIZED LIKELIHOOD
995
3. Multicycle ECM Algorithm The penalized log-likelihood function of (2.5) is difficult to minimize directly. We instead apply the ECM algorithm (Meng and Rubin (1993)) by treating wt ’s as missing data. The full negative penalized log-likelihood of Z1 , . . . , ZT and w1 , . . . , wT , up to an additive constant, can be written as ( ) 2 ℓZ,w (β, θ) = T n log σε + T log |Vξ (θξ ) + In | + log |ΛK | +
T 1 ∑ (Zt − Xt β − ΦK wt )′ (Vξ (θξ ) + In )−1 (Zt − Xt β − ΦK wt ) σε2 t=1
+
T ∑
′ wt′ Λ−1 K wt + α tr(ΦK ΩΦK ) ,
(3.1)
t=1
where ΛK is a diagonal matrix with diagonal elements λ1 , . . . , λK . Basically, the ECM algorithm approaches the problem of minimizing (2.5) by iteratively performing an expectation (E) step that computes the expectation of ℓZ,w (β, θ) conditioned on Z1 , . . . , ZT based on the current fits of β and θ, followed by a sequence of conditional maximization (CM) steps, which successively maximize the conditional penalized log-likelihood obtained in the E-step with respect to each component of β and θ. bt ≡ E(wt |Zt ), t = 1, . . . , T , and Σw|Z ≡ In the E-step, we calculate w var(wt |Zt ) based on the current fits, βe and θe of β and θ as ) ( ) ) ) ( ( 2 −1 ( e K −1 Φ e ′ Vξ (θeξ )+In −1 Zt −Xt βe , (3.2) e +Φ e ′ Vξ (θeξ )+In −1 Φ bt = σ w eε Λ K K K ( )−1 ) ( −1 e + 1Φ eK e ′ Vξ (θeξ ) + In −1 Φ Σw|Z = Λ , (3.3) K σ eε2 K from which we obtain E(ℓZ,w (β, θ)|Z1 , . . . , ZT ) ( ) = T n log σε2 + T log |Vξ (θξ ) + In | + log |ΛK | T 1 ∑ bt )′ (Vξ (θξ ) + In )−1 (Zt − Xt β − ΦK w bt ) + 2 (Zt − Xt β − ΦK w σε t=1
T + 2 tr((Vξ (θξ ) + In )−1/2 ΦK Σw|Z Φ′K (Vξ (θξ ) + In )−1/2 ) σε +
T ∑
( ) ′ bt + T tr Λ−1 bt′ Λ−1 w K Σw|Z + α tr(ΦK ΩΦK ). K w
(3.4)
t=1
We then successively update each component of β and θ by minimizing (3.4) with the other components held fixed in a sequence of CM steps.
996
ΦK
YIN-PING CHEN AND HSIN-CHENG HUANG
(( ) ( )) c ≡ (w b1 , . . . , w bT )′ . First, Let R ≡ Z1 − X1 βe , . . . , ZT − XT βe and W is updated by minimizing
T ∑
( ) ( ) 2
Vξ (θeξ ) + In −1/2 Zt − Xt βe − ΦK w bt t=1
( ) ( ) +T tr (Vξ (θeξ ) + In )−1/2 ΦK Σw|Z Φ′K (Vξ (θeξ ) + In )−1/2 + α σ eε2 tr Φ′K ΩΦK ,
which is equivalent to minimizing c ⊗ (Vξ (θξ ) + In )−1 )vec(ΦK ) −2vec(R)′ (W ( ( ) ) c ′W c + T Σw|Z ) ⊗ Vξ (θeξ ) + In −1 + α σ +vec(ΦK )′ (W eε2 IK ⊗ Ω vec(ΦK ), resulting in e K) = vec(Φ
((
)−1 ) ( ) c ′W c + T Σw|Z ⊗ Vξ (θeξ ) + In −1 + α σ W eε2 IK ⊗ Ω ( ( ) )′ c ⊗ Vξ (θeξ ) + In −1 vec(R), × W (3.5)
e1 , . . . , ϕ e ). We then rescale ϕ ek for k = 1, . . . , K, by dividing it e = (ϕ where Φ ) )−1 K )1/2 ( ( ′(K ek = 1. Notice that we ek e′ Vξ (θeξ ) + In −1 ϕ e Vξ (θeξ ) + In ϕ so that ϕ by ϕ k k e K in this CM step only if the value of (3.4) decreases after rescaling. update Φ The CM updating formulae for β, σε2 , and the λk ’s have simple closed forms given by ) (∑ )−1( ∑ T T ) )−1 )−1 ( ( ( ′ ′ e e e e bt , (3.6) Zt − ΦK w β= Xt Vξ (θξ )+In Xt Xt Vξ (θξ )+In σ eε2 =
t=1 T ∑
1 Tn
t=1
(
e Kw bt Zt − Xt βe − Φ
)′ (
Vξ (θeξ ) + In
)−1 (
e Kw bt Zt − Xt βe − Φ
)
t=1
)−1/2 ) ) ( 1 (( e K Σw|Z Φ e ′ Vξ (θeξ ) + In −1/2 , + tr Vξ (θeξ ) + In Φ K n T ∑ 2 2 ek = 1 λ w bt,k + σw|Z,k , k = 1, . . . , K, T
(3.7) (3.8)
t=1
2 bt , and σw|Z,k where w bt,k is the kth entry of w is the kth diagonal element of Σw|Z . Finally, the updating formula for θξ in the CM step is { θeξ = arg min T log Vξ (θξ ) + In θξ
+
T )′ ( )−1 ( ) 1 ∑( e Kw e Kw bt Vξ (θξ ) + In bt Zt − Xt βe − Φ Zt − Xt βe − Φ 2 σ eε t=1
NONSTATIONARY SPATIAL MODELING USING PENALIZED LIKELIHOOD
+
)−1/2 ( )−1/2 )} T ( ′ e e tr (V (θ ) + I Φ Σ Φ V (θ ) + I . n n K w|Z K ξ ξ ξ ξ σ eε2
997
(3.9)
Unfortunately, θeξ in (3.9) does not have a closed-form expression, and hence has to be computed using some optimization routine. Therefore, it appears computationally more efficient to apply a multicycle ECM algorithm by updating θξ only after all the other parameters converge. Detailed steps of our multicycle ECM algorithm are given below. 1. Start with some initial estimates of β and θ. bt , t = 1, . . . , T , and Σw|Z based on the current values of 2. E-step: Compute w β and θ. 3. Inner CM-step: Update ΦK , β, σε2 , and λk , k = 1, . . . , K according to (3.5)(3.8). 4. Repeat Steps 2 and 3 until convergence. 5. Outer CM-step: Update θξ according to (3.9). 6. Repeat Steps 2-5 until convergence. Throughout the paper, the initial estimates of β, θξ , λ1 , . . . , λK ′ −1 , and σε2 for K = K ′ ≥ 1 are given by the corresponding PML estimates for K = K ′ − 1. The initial estimate of λK ′ is set to be λK ′ /2, and the initial estimate of ΦK is )1/2 ( given by Vξ (θeξ ) + In M , where M is an n × K matrix formed by the first )−1/2 ( K left singular vectors of Vξ (θeξ ) + In R and θeξ denotes the initial estimate of θξ . Note that the PML estimates of β and θ for K = 0 are nothing but the maximum likelihood (ML) estimates βb0 and θb0 for the stationary model given by (2.3) without the ΦK wt term, where βb0 = 2 σ bε,0 =
(∑ T
Xt′
t=1 T ∑
1 Tn
(
Vξ (θbξ,0 ) + In
)−1
Xt
)−1 ( ∑ T
Xt′
(
Vξ (θbξ,0 ) + In
)−1
) Zt ,
t=1
(
Zt − Xt βb0
)′ (
Vξ (θbξ,0 ) + In
)−1 (
) Zt − Xt βb0 ,
t=1
and θbξ,0 can be obtained by maximizing the profile likelihood of θξ using some optimization algorithm. According to Meng and Rubin (1993), the cost function value of our multicycle ECM algorithm is guaranteed to decrease at each iteration. In addition, they also show that a multicycle ECM algorithm shares the same theoretical properties as the corresponding ECM algorithm. Some examples regarding the rates of convergence of EM, ECM, and multicycle ECM can be found in Meng (1994).
998
YIN-PING CHEN AND HSIN-CHENG HUANG
b K , and Φ b K estimated by the proposed PML method, the With σ bε2 , θbξ , Λ estimated spatial covariance function of CY (·, ·) can be written as bY (s, s′ ) ≡ C
K ∑
bk ϕbk (s)ϕbk (s′ ) + C bξ (s, s′ ), λ
s, s′ ∈ D,
k=1
bξ (s, s′ ) is the estimate of Cξ (s, s′ ) by plugging θbξ in for θξ in Cξ (s, s′ ). where C )2 ( When β is either known or zero, an estimate of E Ybt (s)−Yt (s) can be obtained by plugging θb in for θ in (2.9) bξ (s, s) − σ \ bξ (s)′ (Vbξ + In )−1 v bξ (s) MSPE(s) =C bε2 v ( )′ b b ′ (Vbξ + In )−1 v bξ (s) + ϕ(s) −Φ K ( ) b b w|Z ϕ(s) b ′ (Vbξ + In )−1 v bξ (s) , ×Σ −Φ K
where bξ (s) = v
(3.10)
1 b bξ (sn , s))′ , (Cξ (s1 , s), . . . , C σ bε2
bξ (sn )), Vbξ = (b vξ (s1 ), . . . , v ( )−1 1 b −1 + Φ b w|Z = Λ b ′ (Vbξ + In )−1 Φ bK . Σ K σ bε2 K ( )2 Similarly from (2.11), an estimate of E Ybt (s) − Yt (s) for the universal kriging predictor is (∑ )−1 T ′ ′ −1 b ′ −1 b \ \ b Y (s) ΣZ (θ)Xt ) MSPEuk (s) = MSPE(s) + (xt (s) − σ Xt ΣZ (θ)Xt t=1 ′
′
b Y (s) ×(xt (s) − σ
′ b Σ−1 Z (θ)Xt ) .
4. Simulation Studies To assess the performance of the proposed model, we conducted four simulation experiments in one- and two-dimensional spatial domains. Here we focus on covariance function estimation, and hence we consider no regressor with Xt (s) = 0, t = 1, . . . , T, s ∈ D for the first three experiments. The prediction performance of various methods is compared using the averaged MSPE criterion T ∫ ( )2 1 ∑ AMSPE ≡ E Ybt∗ (s) − Yt (s) ds, T |D| s∈D ∫
t=1
ds, and Ybt∗ (s) denotes a generic predictor of Yt (s), for t = ( )2 \ 1, . . . , T , s ∈ D. Similar to the plug-in estimate MSPE(s) of E Ybt (s) − Yt (s)
where |D| =
s∈D
NONSTATIONARY SPATIAL MODELING USING PENALIZED LIKELIHOOD
999
in (3.10), the plug-in estimate of the averaged MSPE is \ ≡ AMSPE
1 ∑ T |D| T
t=1
∫
∗
\ (s)ds, MSPE
s∈D
∗
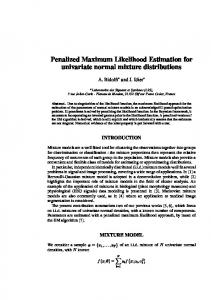
\ (s) denotes a generic plug-in estimate of E(Ybt∗ (s) − Yt (s))2 . In where MSPE addition, the performance of various methods in covariance function estimation can be compared using the averaged mean squared error criterion ∫ ∫ 1 b ∗ (s, s′ ) − CY (s, s′ ))2 dsds′ , AMSE ≡ E(C Y |D|2 ′ s,s ∈D b ∗ (s, s′ ) denotes a generic estimate of CY (s, s′ ) for s, s′ ∈ D. where C Y 4.1. Experiment I In the first experiment, we consider an example brought up by Nott and Dunsmuir (2002) in a one-dimensional spatial domain √ 4]. The spatial √ with D = [−4, process Yt (·) was generated according to Yt (s) = Ψ(s)Y1,t (s)+ 1−Ψ(s)Y2,t (s), where Ψ(·) is the cumulative distribution function of the standard normal distribution, and Yj,t (·) is a zero-mean Gaussian process with the exponential covariance function CYj (s, s′ ) = exp(−ρj ∥s − s′ ∥), j = 1, 2. (4.1) The data were generated on D = [−4, 4] according to (2.1) with n = 20 and σε2 = 0.04, where s1 = −4, s20 = 4, and s2 , . . . , sn−1 were sampled on D using simple random sampling, and then rearranged so that s1 < · ·√ · < sn .√ The resulting spa′) = Ψ(s) Ψ(s′ )CY1 (s, s′ )+ tial covariance function of Y (·) is given by C (s, s t Y √ √ 1 − Ψ(s) 1 − Ψ(s′ )CY2 (s, s′ ). We considered time points T = 50, 100 in combination with (ρ1 , ρ2 ) = (2, 1/20), (2, 1/2), (2, 2), corresponding to high nonstationarity, mild nonstationarity, and near stationarity, respectively, for Yj,t (·)’s in (4.1). The corresponding spatial covariance functions are shown in Figure 1. We applied the proposed PML method and considered the exponential covariance family for ξt (·) in (2.2) parametrized by θξ = (τξ , ρξ )′ : 1 cov(ξt (s), ξt (s′ )) = τξ exp(−ρξ ∥s − s′ ∥). σε2
(4.2)
We chose K ∈ {0, 1, . . . , 3} and α ∈ A in (2.5) via 6-fold CV, where A = {2−8 , 2−7 , . . . , 28 }. Specifically, we randomly partitioned s2 , . . . , s19 into six disjoint subsets, D1 , . . . , D6 , each with size 3. For each Dj , we estimated the parameters using the proposed PML based on data {Zt (s) : s ∈ {s1 , . . . , s20 } \ Dj , t =
1000
YIN-PING CHEN AND HSIN-CHENG HUANG
Figure 1. True spatial covariance functions of CY (·, ·) in Experiment I with three different pairs of parameters: (a) (ρ1 , ρ2 ) = (2, 1/20); (b) (ρ1 , ρ2 ) = (2, 1/2); (c) (ρ1 , ρ2 ) = (2, 2).
1, . . . , T } at the remaining locations, and predicted Yt (s) by Ybt (s), for s ∈ Dj , K ∈ {0, 1, . . . , 3}, and α ∈ A. Notice that s1 and sn were always included as data locations in each fitting sample of CV to avoid the boundary effect. We then chose K and α in (2.5) simultaneously such that (K,α)
CV(K, α) =
T ∑ ν ∑ ∑
(K,α)
2
Yb (s) − Zt (s) , t
(4.3)
t=1 j=1 s∈Dj
was minimized among K ∈ {0, 1, 2, 3} and α ∈ A, where ν = 6. Note that for K = 0, the model reduces to a stationary model independent of α, where the parameters are estimated by ML and Yt (s) is predicted using simple kriging. The proposed method is compared with the following methods. 1. Method I: A reduced model similar to (2.1) and (2.2) was considered except that there was no stationary process term ξt (·) in (2.2). The proposed PML method was used for parameter estimation, and the parameters were computed using the ECM algorithm introduced in Section 3 but with no θξ term. The tuning parameters K and α were selected by CV, (4.3), but with (K,α) Ybt (s) obtained from the reduced model. This method, avoiding taking the inverse of Vξ (θξ ) + In in the proposed multicycle ECM algorithm, has the advantage of being computationally more efficient. 2. Method II: This method applied a pre-smoothing (or pre-gridding) step commonly used in EOF analysis (e.g., Karl, Koscielny, and Diaz (1982); Wikle and Cressie (1999)) when data are sampled at irregularly spaced locations. First, {Yt (s) : s ∈ D} were imputed based on data Zt using natural cubic splines with the smoothing parameter chosen by generalized cross-validation
NONSTATIONARY SPATIAL MODELING USING PENALIZED LIKELIHOOD
1001
(GCV) for each t = 1, . . . , T . Then we obtained the sample covariance funcT {∑ } tion Yt (s)Yt (s′ )/T : s, s′ ∈ D , whose first K eigenfunctions were used t=1
as estimates of ϕ1 (·), . . . , ϕK (·) and the corresponding eigenvalues were used as estimates of λ1 , . . . , λK . With the parameters given by these estimates being assumed known, the remaining parameters, σε2 and θξ , were estimated by ML. 3. Method III: This method used the estimates of ϕ1 (·), . . . , ϕK (·) from Method II, but λ1 , . . . , λK were further re-estimated along with σε2 and θξ using ML by applying a multicycle ECM algorithm similar to the one described in Section 3. The AMSPE performance of the four methods is shown in Table 1, where “Ideal” refers to ideal selection for the number of basis functions, which corresponds to the smallest AMSPE among those based on K ∈ {0, 1, 2, 3} for each replicate. The performance of the four methods for covariance function estimation in terms of AMSE is shown in Table 2. In general, the proposed PML method performed significantly better than the other three methods for almost all cases in terms of covariance function estimation. Regarding spatial prediction, although the proposed method also outperformed Method III in all cases, the differences were only significant for some highly nonstationary cases. For highly and mildly nonstationary cases with ρ1 ̸= ρ2 , the proposed PML method achieved the smallest AMSPE at K = 1 for all cases, whereas the other three methods all achieved the smallest AMSPE at K = 0 in all cases, indicating that the nonstationary feature is not well captured. We found that the surfaces imputed from the pre-smoothing step in Methods II and III tend to be under-smoothed, causing instability in covariance function estimation. In particular, Method III performed miserably due to poor estimation of ϕk (·)’s, which in turn caused high variation in CV selection. In addition, the proposed PML method tended to have a smaller bias in estimating AMSPE than the other three methods. 4.2. Experiment II In this experiment, we consider a two-dimensional example of Chang, Hsu, and Huang (2010): √ √ Yt (s) = xY1,t (s) + 1 − xY2,t (s), where (x, y) = s ∈ D = [0, 1] × [0, 1], and Y1,t (·) and Y2,t (·) are independent Gaussian processes with zero means and covariance functions given by (4.1). Then the covariance function of Yt depending on ρ1 and ρ2 in (4.1) is
1002
YIN-PING CHEN AND HSIN-CHENG HUANG
Table 1. AMSPEs of various methods for spatial prediction in Experiment I based on 500 simulation replicates, where a boldface value indicates that the corresponding method performs significantly better than the other three methods, and the values given in parentheses are the corresponding standard errors. (ρ1 , ρ2 ) (2, 1/20)
T 50
Method PML Method I Method II Method III
100
PML Method I Method II Method III
(2, 1/2)
50
PML Method I Method II Method III
100
PML Method I Method II Method III
(2, 2)
50
PML Method I Method II Method III
100
PML Method I Method II Method III
Ideal 0.2292 (0.0015) .2369 (0.0017) .2348 (0.0016) .2335 (0.0016) .2290 (0.0014) .2366 (0.0016) .2343 (0.0016) .2332 (0.0016) .2867 (0.0016) .2894 (0.0017) .2875 (0.0016) .2888 (0.0017) .2864 (0.0015) .2889 (0.0016) .2873 (0.0015) .2881 (0.0016) .4162 (0.0017) .4167 (0.0017) .4161 (0.0017) .4166 (0.0017) .4153 (0.0016) .4155 (0.0016) .4152 (0.0016) .4155 (0.0016)
CV 0.2302 (0.0015) 0.2372 (0.0017) 0.2370 (0.0017) 0.2694 (0.0054) 0.2295 (0.0015) 0.2369 (0.0016) 0.2363 (0.0016) 0.2550 (0.0040) 0.2885 (0.0016) 0.2894 (0.0017) 0.2896 (0.0017) 0.3444 (0.0056) 0.2874 (0.0015) 0.2889 (0.0016) 0.2888 (0.0016) 0.3167 (0.0036) 0.4177 (0.0018) 0.4167 (0.0017) 0.4169 (0.0017) 0.5088 (0.0064) 0.4163 (0.0016) 0.4155 (0.0016) 0.4157 (0.0016) 0.4585 (0.0039)
K=0 0.2369 (0.0017) 0.2369 (0.0017) 0.2369 (0.0017) 0.2369 (0.0017) 0.2366 (0.0016) 0.2366 (0.0016) 0.2366 (0.0016) 0.2366 (0.0016) 0.2894 (0.0017) 0.2894 (0.0017) 0.2894 (0.0017) 0.2894 (0.0017) 0.2889 (0.0016) 0.2889 (0.0016) 0.2889 (0.0016) 0.2889 (0.0016) 0.4167 (0.0017) 0.4167 (0.0017) 0.4167 (0.0017) 0.4167 (0.0017) 0.4155 (0.0016) 0.4155 (0.0016) 0.4155 (0.0016) 0.4155 (0.0016)
K=1 0.2299 (0.0015) 0.5299 (0.0017) 0.2456 (0.0017) 0.2648 (0.0055) 0.2292 (0.0014) 0.5306 (0.0012) 0.2453 (0.0016) 0.2603 (0.0050) 0.2882 (0.0016) 0.7447 (0.0024) 0.2921 (0.0017) 0.3296 (0.0052) 0.2872 (0.0015) 0.7445 (0.0019) 0.2919 (0.0016) 0.3132 (0.0036) 0.4186 (0.0018) 0.8898 (0.0020) 0.4181 (0.0017) 0.4797 (0.0054) 0.4168 (0.0016) 0.8974 (0.0014) 0.4169 (0.0016) 0.4470 (0.0038)
K=2 0.2364 (0.0016) 0.4417 (0.0014) 0.2484 (0.0018) 0.3051 (0.0061) 0.2359 (0.0015) 0.4463 (0.0011) 0.2454 (0.0017) 0.2865 (0.0047) 0.2886 (0.0016) 0.6247 (0.0020) 0.2946 (0.0017) 0.3473 (0.0053) 0.2881 (0.0015) 0.6310 (0.0015) 0.2940 (0.0016) 0.3239 (0.0037) 0.4185 (0.0018) 0.8041 (0.0020) 0.4207 (0.0017) 0.5021 (0.0062) 0.4169 (0.0017) 0.8141 (0.0013) 0.4189 (0.0016) 0.4555 (0.0039)
K=3 0.2376 (0.0018) 0.3834 (0.0014) 0.2525 (0.0023) 0.3532 (0.0072) 0.2387 (0.0017) 0.3875 (0.0010) 0.2472 (0.0020) 0.3274 (0.0054) 0.2886 (0.0016) 0.5393 (0.0017) 0.2955 (0.0018) 0.3711 (0.0055) 0.2881 (0.0015) 0.5480 (0.0013) 0.2955 (0.0017) 0.3389 (0.0036) 0.4189 (0.0018) 0.7314 (0.0019) 0.4225 (0.0018) 0.5204 (0.0063) 0.4170 (0.0017) 0.7446 (0.0013) 0.4208 (0.0016) 0.4625 (0.0038)
NONSTATIONARY SPATIAL MODELING USING PENALIZED LIKELIHOOD
1003
Table 2. AMSEs of various methods for covariance function estimation in Experiment I based on 500 simulation replicates, where a boldface value indicates that the corresponding method performs significantly better than the other three methods, and the values given in parentheses are the corresponding standard errors. (ρ1 , ρ2 ) Method K=0 1 (2, 20 ) PML 0.0817 (0.0006) Method I 0.0817 (0.0006) Method II 0.0817 (0.0006) Method III 0.0817 (0.0006) (2, 12 ) PML 0.0168 (0.0002) Method I 0.0168 (0.0002) Method II 0.0168 (0.0002) Method III 0.0168 (0.0002) (2, 2) PML 0.0006 (0.0000) Method I 0.0006 (0.0000) Method II 0.0006 (0.0000) Method III 0.0006 (0.0000)
T = 50 K=1 K=2 0.0245 0.0278 (0.0008) (0.0008) 0.0482 0.0408 (0.0009) (0.0012) 1.1627 1.3613 (0.0599) (0.0656) 0.1097 0.1084 (0.0189) (0.0142) 0.0116 0.0111 (0.0004) (0.0003) 0.0637 0.0467 (0.0007) (0.0005) 0.3478 0.5179 (0.0203) (0.0258) 0.0884 0.0928 (0.0119) (0.0112) 0.0048 0.0060 (0.0002) (0.0006) 0.0511 0.0432 (0.0002) (0.0002) 0.2603 0.3565 (0.0256) (0.0268) 0.0990 0.1187 (0.0141) (0.0157)
K=3 0.0281 (0.0010) 0.0593 (0.0034) 1.4558 (0.0690) 0.1257 (0.0175) 0.0104 (0.0003) 0.0389 (0.0007) 0.6255 (0.0292) 0.1015 (0.0114) 0.0073 (0.0008) 0.0379 (0.0003) 0.4356 (0.0285) 0.1269 (0.0148)
K=0 0.0789 (0.0005) 0.0789 (0.0005) 0.0789 (0.0005) 0.0789 (0.0005) 0.0159 (0.0001) 0.0159 (0.0001) 0.0159 (0.0001) 0.0159 (0.0001) .0003 (0.0000) 0.0003 (0.0000) 0.0003 (0.0000) 0.0003 (0.0000)
T = 100 K=1 K=2 0.0154 0.0191 (0.0004) (0.0004) 0.0373 0.0281 (0.0004) (0.0004) 1.0551 1.2948 (0.0548) (0.0658) 0.1118 0.0845 (0.0368) (0.0151) 0.0078 0.0091 (0.0002) (0.0006) 0.0570 0.0403 (0.0006) (0.0003) 0.3712 0.5467 (0.0397) (0.0418) 0.0547 0.0571 (0.0065) (0.0067) 0.0031 0.0031 (0.0001) (0.0002) 0.0498 0.0407 (0.0001) (0.0001) 0.3042 0.3844 (0.0969) (0.0956) 0.0608 0.0658 (0.0177) (0.0159)
K=3 0.0200 (0.0005) 0.0325 (0.0012) 1.3925 (0.0691) 0.0995 (0.0195) 0.0089 (0.0006) 0.0303 (0.0003) 0.6667 (0.0434) 0.0613 (0.0071) 0.0034 (0.0002) 0.0337 (0.0002) 0.4539 (0.0951) 0.0672 (0.0158)
√ √ CY (s, s′ ) = xx′ CY1 (s, s′ ) + (1 − x)(1 − x′ )CY2 (s, s′ ). The data were generated on D according to (2.1) with n = 25 and σε2 = 0.04, where s1 = (0, 0), s2 = (0, 1), s3 = (1, 0), s4 = (1, 1), and the remaining 21 points, s5 , . . . , s25 , were sampled on D using simple random sampling. Similar to Experiment I, we considered time points T = 50, 100 in combination with (ρ1 , ρ2 ) = (10, 1), (4, 1), (1, 1), corresponding to high nonstationarity, mild nonstationarity, and near stationarity, respectively, for Yj,t (·)’s in (4.1). The contour plots of CY (s0 , s) at s0 = (1/2, 1/2) and (1/4, 1/4) for the three models are provided in Figure 2. We applied the proposed PML method and considered the exponential covariance family of (4.2) for ξt (·) in (2.2). Similar to Experiment I, we chose K ∈ {0, 1, 2, 3} and α ∈ A simultaneously via 7-fold CV, where {s1 , s2 , s3 , s4 }
1004
YIN-PING CHEN AND HSIN-CHENG HUANG
Figure 2. True spatial covariance functions of {CY (s0 , s) : s ∈ D} in Experiment II with three different pairs of parameters, (ρ1 , ρ2 ) = (10, 1), (4, 1) (1, 1) (corresponding to the three columns), and two locations, s0 = (1/2, 1/2), (1/4, 1/4) (corresponding to the two rows).
were always included as data locations in each fitting sample of CV to avoid the boundary effect, and the remaining 21 locations were randomly partitioned into seven disjoint subsets for computing CV as described in Experiment I. The proposed method was compared with the same methods as in Experiment I. For Methods II and III, {Yt (s) : s ∈ D} were imputed based on data Zt using thin-plate splines (Duchon (1977); Wahba (1990)) with the smoothing parameter chosen by GCV, for t = 1, . . . , T . The AMSPE performance of the four methods for spatial prediction is summarized in Table 3, and the AMSE performance for covariance function estimation is shown in Table 4. Overall, the results are similar to those in Experiment I except that Method III outperformed Methods I and II in covariance function estimation. In fact, it even performed better than the proposed PML method in some nearly stationary cases because, unlike Experiment I, the surfaces were well imputed by the pre-smoothing step for Methods II and III. A randomly selected example of the estimated spatial bY (s0 , s), at s0 = (1/2, 1/2), (1/4, 1/4) based on the procovariance function, C posed PML method for T = 50 is shown in Figure 3. Our method appears to catch nonstationary features quite well.
NONSTATIONARY SPATIAL MODELING USING PENALIZED LIKELIHOOD
1005
bY (s0 , s) : s ∈ D} using Figure 3. Estimated spatial covariance function {C the proposed PML method with K = 1 in Experiment II with three different pairs of parameters, (ρ1 , ρ2 ) = (10, 1), (4, 1) (1, 1) (corresponding to the three columns), and two locations, s0 = (1/2, 1/2), (1/4, 1/4) (corresponding to the two rows).
4.3. Experiment III For the third simulation experiment, we generated data {Z1 , . . . , ZT } di√ √ rectly from (2.3) with ϕ1 (s) = 3x, ϕ2 (s) = 3(2y − 1), where s = (x, y) ∈ D = [0, 1] × [0, 1], wt ∼ N (0, diag(0.25, 0.16)), ξt (·) is a Gaussian process with zero mean and covariance function, cov(ξt (s), ξt (s′ )) = 0.16 exp{−∥s − s′ ∥}, and σε2 = 0.04. We took n = 25 and selected the data locations as in Experiment II. We considered time points T = 50, 100. The contour plots of {CY (s0 , s) : s ∈ D} at s0 = (1/2, 1/2) and (1/4, 1/4) are shown in Figure 4. We applied the proposed PML method as in Experiment II. Here we compared our method only with Method III, because Method I contains no stationary process term, ξt (·), found to be important in the previous two experiments, and Method II had performed worse than Method III in Experiment II. The AMSPE performance of the two methods for spatial prediction is summarized in Table 5, and the AMSE performance of the methods for covariance function estimation is displayed in Table 6. Clearly, our method outperformed Method III in most situations. Notice that both methods achieved the smallest AMSPE value at K = 2, which agrees with the true number of components. A randomly selected
1006
YIN-PING CHEN AND HSIN-CHENG HUANG
Table 3. AMSPEs of various methods for spatial prediction in Experiment II based on 500 simulation replicates, where a boldface value indicates that the corresponding method performs significantly better than the other three methods, and the values given in parentheses are the corresponding standard errors. (ρ1 , ρ2 ) (10, 1)
T 50
Method PML Method I Method II Method III
100
PML Method I Method II Method III
(4, 1)
50
PML Method I Method II Method III
100
PML Method I Method II Method III
(1, 1)
50
PML Method I Method II Method III
100
PML Method I Method II Method III
Ideal 0.4975 (0.0008) 0.5040 (0.0009) 0.5026 (0.0008) 0.4990 (0.0008) 0.4981 (0.0006) 0.5047 (0.0007) 0.5034 (0.0007) 0.4994 (0.0007) 0.3195 (0.0009) 0.3205 (0.0009) 0.3202 (0.0009) 0.3198 (0.0009) 0.3200 (0.0008) 0.3210 (0.0008) 0.3208 (0.0008) 0.3203 (0.0008) 0.1534 (0.0005) 0.1537 (0.0005) 0.1536 (0.0005) 0.1536 (0.0005) 0.1542 (0.0004) 0.1544 (0.0004) 0.1543 (0.0004) 0.1543 (0.0004)
CV 0.4996 (0.0008) 0.5040 (0.0009) 0.5044 (0.0009) 0.5058 (0.0010) 0.4989 (0.0006) 0.5049 (0.0008) 0.5049 (0.0007) 0.5010 (0.0007) 0.3203 (0.0009) 0.3205 (0.0009) 0.3208 (0.0009) 0.3229 (0.0009) 0.3204 (0.0008) 0.3210 (0.0008) 0.3212 (0.0008) 0.3209 (0.0008) 0.1538 (0.0005) 0.1537 (0.0005) 0.1538 (0.0005) 0.1546 (0.0005) 0.1544 (0.0004) 0.1544 (0.0004) 0.1544 (0.0004) 0.1546 (0.0004)
K=0 0.5040 (0.0009) 0.5040 (0.0009) 0.5040 (0.0009) 0.5040 (0.0009) 0.5047 (0.0007) 0.5047 (0.0007) 0.5047 (0.0007) 0.5047 (0.0007) 0.3205 (0.0009) 0.3205 (0.0009) 0.3205 (0.0009) 0.3205 (0.0009) 0.3210 (0.0008) 0.3210 (0.0008) 0.3210 (0.0008) 0.3210 (0.0008) 0.1537 (0.0005) 0.1537 (0.0005) 0.1537 (0.0005) 0.1537 (0.0005) 0.1544 (0.0004) 0.1544 (0.0004) 0.1544 (0.0004) 0.1544 (0.0004)
K=1 0.4991 (0.0008) 0.6855 (0.0011) 0.5359 (0.0039) 0.5010 (0.0008) 0.4988 (0.0006) 0.6882 (0.0008) 0.5332 (0.0036) 0.5006 (0.0007) 0.3202 (0.0009) 0.6331 (0.0015) 0.3254 (0.0009) 0.3213 (0.0009) 0.3203 (0.0008) 0.6380 (0.0012) 0.3255 (0.0008) 0.3211 (0.0008) 0.1537 (0.0005) 0.4614 (0.0016) 0.1548 (0.0005) 0.1539 (0.0005) 0.1543 (0.0004) 0.4666 (0.0012) 0.1551 (0.0004) 0.1544 (0.0004)
K=2 0.5055 (0.0009) 0.6409 (0.0010) 0.5546 (0.0056) 0.5226 (0.0011) 0.5034 (0.0007) 0.6455 (0.0008) 0.5424 (0.0048) 0.5153 (0.0007) 0.3225 (0.0009) 0.5448 (0.0012) 0.3316 (0.0018) 0.3310 (0.0009) 0.3216 (0.0008) 0.5534 (0.0010) 0.3292 (0.0011) 0.3278 (0.0008) 0.1550 (0.0005) 0.3336 (0.0010) 0.1590 (0.0007) 0.1582 (0.0005) 0.1553 (0.0004) 0.3391 (0.0008) 0.1598 (0.0007) 0.1584 (0.0004)
K=3 0.5132 (0.0013) 0.6113 (0.0009) 0.5798 (0.0077) 0.5607 (0.0015) 0.5136 (0.0011) 0.6154 (0.0008) 0.5632 (0.0068) 0.5545 (0.0014) 0.3256 (0.0010) 0.4826 (0.0011) 0.3587 (0.0062) 0.3686 (0.0016) 0.3248 (0.0009) 0.4902 (0.0010) 0.3474 (0.0048) 0.3637 (0.0014) 0.1613 (0.0008) 0.2621 (0.0007) 0.1653 (0.0014) 0.1845 (0.0008) 0.1616 (0.0006) 0.2666 (0.0006) 0.1710 (0.0029) 0.1849 (0.0007)
NONSTATIONARY SPATIAL MODELING USING PENALIZED LIKELIHOOD
1007
Table 4. AMSEs of various methods for covariance function estimation in Experiment II based on 500 simulation replicates, where a boldface value indicates that the corresponding method performs significantly better than the other three methods, and the values given in parentheses are the corresponding standard errors. (ρ1 , ρ2 ) Method (10, 1) PML Method I Method II Method III (4, 1)
PML Method I Method II Method III
(1, 1)
PML Method I Method II Method III
K=0 0.0266 (0.0003) 0.0266 (0.0003) 0.0266 (0.0003) 0.0266 (0.0003) 0.0144 (0.0002) 0.0144 (0.0002) 0.0144 (0.0002) 0.0144 (0.0002) 0.0107 (0.0005) 0.0107 (0.0005) 0.0107 (0.0005) 0.0107 (0.0005)
T = 50 K=1 K=2 0.0104 0.0112 (0.0003) (0.0003) 0.0225 0.0205 (0.0004) (0.0004) 0.5094 0.5891 (0.0270) (0.0302) 0.0125 0.0153 (0.0004) (0.0004) 0.0115 0.0143 (0.0004) (0.0006) 0.0405 0.0317 (0.0005) (0.0005) 0.5813 0.7469 (0.0292) (0.0367) 0.0196 0.0193 (0.0008) (0.0006) 0.0248 0.0270 (0.0009) (0.0008) 0.0550 0.0362 (0.0009) (0.0008) 1.0131 1.7709 (0.0513) (0.0904) 0.0513 0.0245 (0.0023) (0.0009)
K=3 0.0123 (0.0005) 0.0257 (0.0010) 0.6427 (0.0325) 0.0165 (0.0004) 0.0166 (0.0012) 0.0297 (0.0010) 0.8893 (0.0435) 0.0191 (0.0005) 0.0288 (0.0008) 0.0305 (0.0010) 2.0795 (0.1020) 0.0249 (0.0008)
K=0 0.0249 (0.0002) 0.0249 (0.0002) 0.0249 (0.0002) 0.0249 (0.0002) 0.0129 (0.0001) 0.0129 (0.0001) 0.0129 (0.0001) 0.0129 (0.0001) 0.0083 (0.0003) 0.0083 (0.0003) 0.0083 (0.0003) 0.0083 (0.0003)
T = 100 K=1 K=2 0.0069 0.0076 (0.0002) (0.0002) 0.0174 0.0146 (0.0002) (0.0002) 0.5276 0.6163 (0.0246) (0.0287) 0.0074 0.0088 (0.0002) (0.0002) 0.0070 0.0113 (0.0002) (0.0019) 0.0331 0.0240 (0.0003) (0.0003) 0.5902 0.7666 (0.0264) (0.0350) 0.0119 0.0109 (0.0004) (0.0003) 0.0172 0.0207 (0.0005) (0.0012) 0.0422 0.0236 (0.0005) (0.0004) 0.9867 1.7504 (0.0465) (0.0870) 0.0322 0.0124 (0.0013) (0.0004)
K=3 0.0083 (0.0002) 0.0140 (0.0003) 0.6980 (0.0320) 0.0097 (0.0002) 0.0144 (0.0033) 0.0178 (0.0003) 0.8998 (0.0411) 0.0106 (0.0002) 0.0250 (0.0029) 0.0162 (0.0004) 2.0841 (0.1019) 0.0124 (0.0004)
Figure 4. True spatial covariance functions in Experiment III: (a) {CY (s, s) : s ∈ D}; (b) {CY (s0 , s) : s ∈ D} for s0 = (1/2, 1/2); (c) {CY (s0 , s) : s ∈ D} for s0 = (1/4, 1/4).
1008
YIN-PING CHEN AND HSIN-CHENG HUANG
Table 5. AMSPEs of various methods for spatial prediction in Experiment III based on 500 simulation replicates, where a boldface value indicates that the corresponding method performs significantly better than the other method, and the values given in parentheses are the corresponding standard errors. T 50
Method PML
Ideal 0.0327 (0.0001) 0.0332 (0.0001) 0.0327 (0.0001) 0.0331 (0.0001)
Method III 100
PML Method III
CV 0.0330 (0.0001) 0.0335 (0.0001) 0.0328 (0.0001) 0.0332 (0.0001)
K=0 0.0351 (0.0001) 0.0351 (0.0001) 0.0352 (0.0001) 0.0352 (0.0001)
K=1 0.0336 (0.0001) 0.0345 (0.0001) 0.0336 (0.0001) 0.0347 (0.0001)
K=2 0.0330 (0.0001) 0.0334 (0.0001) 0.0328 (0.0001) 0.0332 (0.0001)
K=3 0.0389 (0.0001) 0.0385 (0.0001) 0.0389 (0.0001) 0.0380 (0.0001)
Table 6. AMSEs of various methods for covariance function estimation in Experiment III based on 500 simulation replicates, where a boldface value indicates that the corresponding method performs significantly better than the other method, and the values given in parentheses are the corresponding standard errors. Method PML Method III
K=0 0.6705 (0.0132) 0.6705 (0.0132)
T = 50 K=1 K=2 0.0613 0.0096 (0.0016) (0.0003) 0.3407 0.0104 (0.0084) (0.0004)
K=3 0.0092 (0.0004) 0.0094 (0.0004)
K=0 0.6533 (0.0093) 0.6533 (0.0093)
T = 100 K=1 K=2 0.0582 0.0053 (0.0011) (0.0002) 0.3609 0.0057 (0.0061) (0.0002)
K=3 0.0048 (0.0002) 0.0049 (0.0002)
{ } bY (s0 , s) : s ∈ D , at example of the estimated spatial covariance function, C s0 = (1/2, 1/2), (1/4, 1/4), based on the proposed PML method for T = 50, is shown in Figure 5. Again, our method can be seen to catch nonstationary features quite well. 4.4. Experiment IV Here we generated data using the model fitted by our PML method to the monthly precipitation dataset in Section 5, in order to more closely reflect a realworld situation. Specifically, we considered the model of (2.1) and (2.2) with mean function given by (5.1), and with the parameters of β and θ estimated by our PML method (see Table 10) based on the data observed at 79 stations with complete records. We further investigated how the proposed method is affected by the temporal correlation of {wt : t ∈ N} by assuming a multivariate stationary autoregressive time series of order 1: wt = awt−1 + vt ,
(4.4)
NONSTATIONARY SPATIAL MODELING USING PENALIZED LIKELIHOOD
1009
Figure 5. Estimated spatial covariance functions using the proposed PML bY (s, s) : s ∈ D}; (b) method with K = 2 in Experiment III: (a) {C b bY (s0 , s) : s ∈ D} for {CY (s0 , s) : s ∈ D} for s0 = (1/2, 1/2); (c) {C s0 = (1/4, 1/4).
where vt ∼ N (0, (1 − a2 )ΛK ). We considered a ∈ {0, 0.1, 0.5, 0.9} corresponding to different strengths of temporal dependence, and generated data according to (2.3) and (4.4) at the same 79 locations and the same number of time points. For locations at which xt,13 (s), . . . , xt,15 (s) were not observed, we estimated the surface xt,j (·) for j = 13, 14, 15, at each time t separately, using thin plate splines with the tuning parameter chosen by GCV. We applied the proposed PML method in the same way as in Experiments II and III, and chose K ∈ {0, 1, 2, 3} and α ∈ {2−10 , 2−9 , . . . , 210 } using 5-fold CV by randomly partitioning the sampling locations into five disjoint subsets of sizes 16, 16, 16, 16 and 15. The AMSPE performance of our method for spatial prediction and the AMSE performance of our method for covariance function estimation are displayed in Tables 7 and 8, respectively. We note that our covariance function estimate deteriorated only slightly when the temporal dependence parameter a increased from 0 to 0.5. However, it deteriorated more severely when a = 0.9 ˆ 1 . This is not much of a surprise since with a significantly higher variance for λ the effective sample size (i.e., the equivalent number of independent repeated measurements) is smaller when a is larger. Similar behavior can also be seen in spatial prediction but with less significant differences. As expected, the model based on K = 1 performed the best in both spatial prediction and covariance function estimation. On the other hand, it is interesting to see that the model ˆ 2 and λ ˆ3 based on either K = 2 or K = 3 performed almost as well, because λ were nearly negligible. Additionally, Table 9 reports the means and the standard deviations for the estimated parameters based on the model selected by CV. All the estimates can be seen to perform reasonably well with relatively small ˆ 1 , which is more directly biases regardless of values of a. Note that except for λ influenced by a, the standard errors of the other parameter estimates increase only slightly with a. This is not much a surprise, because the variance contributed
1010
YIN-PING CHEN AND HSIN-CHENG HUANG
Table 7. AMSPEs (×100) of the proposed method for spatial prediction in Experiment IV for data with different strengths of temporal dependence based on 500 simulation replicates, where the values given in parentheses are the corresponding standard errors. a 0.0 0.1 0.5 0.9
Ideal 6.239 (0.006) 6.239 (0.006) 6.239 (0.006) 6.241 (0.006)
CV 6.243 (0.006) 6.243 (0.006) 6.244 (0.006) 6.245 (0.006)
K=0 6.299 (0.006) 6.299 (0.006) 6.302 (0.006) 6.310 (0.006)
K=1 6.241 (0.006) 6.241 (0.006) 6.241 (0.006) 6.243 (0.006)
K=2 6.243 (0.006) 6.243 (0.006) 6.244 (0.006) 6.245 (0.006)
K=3 6.243 (0.006) 6.243 (0.006) 6.244 (0.006) 6.245 (0.006)
Table 8. AMSEs (×100) of the proposed method for covariance function estimation in Experiment IV for data with different strengths of temporal dependence based on 500 simulation replicates, where the values given in parentheses are the corresponding standard errors. a 0.0 0.1 0.5 0.9
CV 0.049 (0.002) 0.050 (0.002) 0.055 (0.003) 0.146 (0.014)
K=0 0.379 (0.005) 0.379 (0.005) 0.384 (0.006) 0.496 (0.032)
K=1 0.043 (0.002) 0.043 (0.002) 0.048 (0.002) 0.136 (0.014)
K=2 0.045 (0.002) 0.045 (0.002) 0.050 (0.002) 0.139 (0.014)
K=3 0.045 (0.002) 0.045 (0.002) 0.051 (0.002) 0.141 (0.014)
by the (temporally independent) stationary component (3.137 × 0.056) is about three times larger than that contributed by the (autoregressive) nonstationary component (0.057), and hence the effective sample size is not too much smaller than T even when a = 0.9. Although our method ignores temporal dependence, the performance is not much affected as long as that is not strong. This is consistent with the theoretical result of H¨ormann and Kokoszka (2010) for weakly dependent functional data. In addition, CV appears to be effective in selecting K for spatial prediction and covariance function estimation. 5. Application We applied the proposed method to a precipitation dataset obtained from the National Climatic Data Center (available at http://www.cgd.ucar.edu/stats/ Data/US.monthly.met/). The data consist of monthly total precipitation at 376 stations, mostly located in Colorado, from November 1993 to December 1997
NONSTATIONARY SPATIAL MODELING USING PENALIZED LIKELIHOOD
1011
Table 9. Means and the standard deviations (in parentheses) of the estimated parameters for the PML method in Experiment IV based on 500 simulation replicates. True a = 0.0 a = 0.1 a = 0.5 τξ 3.137 3.006(0.220) 3.009(0.228) 3.008(0.237) ρξ 39.050 43.428(4.219) 43.397(4.329) 43.436(4.397) σε2 0.056 0.055(0.002) 0.055(0.002) 0.055(0.002) ∫ λ1 D ϕ21 (s)ds/|D| 0.057 0.054(0.018) 0.054(0.018) 0.054(0.019) ∫ λ2 D ϕ22 (s)ds/|D| 0.000 0.004(0.007) 0.004(0.008) 0.004(0.008) ∫ λ3 D ϕ23 (s)ds/|D| 0.000 0.001(0.003) 0.001(0.003) 0.001(0.003) β1 1.485 1.478(0.117) 1.477(0.117) 1.476(0.117) β2 0.139 0.144(0.129) 0.144(0.128) 0.143(0.128) β3 0.458 0.461(0.133) 0.461(0.133) 0.460(0.133) β4 1.271 1.272(0.144) 1.272(0.144) 1.271(0.143) β5 1.863 1.873(0.153) 1.873(0.153) 1.872(0.154) β6 2.119 2.115(0.172) 2.115(0.172) 2.114(0.173) β7 2.230 2.224(0.178) 2.224(0.178) 2.222(0.180) β8 2.444 2.448(0.174) 2.448(0.174) 2.446(0.176) β9 1.980 1.982(0.160) 1.982(0.160) 1.981(0.161) β10 1.257 1.258(0.145) 1.258(0.145) 1.258(0.145) β11 0.404 0.405(0.130) 0.405(0.129) 0.405(0.129) β12 -0.151 -0.153(0.125) -0.153(0.125) -0.152(0.124) β13 -0.139 -0.136(0.038) -0.136(0.038) -0.136(0.040) β14 -0.065 -0.065(0.005) -0.065(0.005) -0.065(0.005) β15 -0.003 -0.003(0.003) -0.003(0.003) -0.003(0.003)
a = 0.9 3.014(0.228) 43.284(4.431) 0.055(0.002) 0.053(0.035) 0.004(0.008) 0.001(0.003) 1.473(0.126) 0.143(0.129) 0.458(0.134) 1.269(0.145) 1.868(0.161) 2.110(0.183) 2.217(0.190) 2.441(0.186) 1.978(0.168) 1.255(0.151) 0.403(0.128) -0.153(0.123) -0.133(0.048) -0.065(0.005) -0.003(0.003)
between latitudes 101 degrees and 109.5 degrees west and between longitudes 36.5 degrees and 41.5 degrees north. Among 376 stations, 79 of them have complete data, which were used as training data. The remaining data at 297 stations were used for validation purpose. Figure 6(a) displays the locations of all 376 stations and the elevations for the 79 sampling (training) locations on a rectangular region D based on the polyconic projection. Because monthly total rainfalls take only positive values and tend to have a distribution that is skewed to the right, they were first transformed using the log transformation ( ) Yt (s) = log yt (s) + 1 , s ∈ D, t = 1, . . . , 50, where yt (s) denotes the monthly total precipitation (in millimeters) at location s and time t. We applied the propose PML method with ξt (·) in (2.2) modeled by the exponential covariance family of (4.2). In addition, the mean function in (2.2) was modeled as ′
xt (s) β = β1 +
12 ∑ j=2
βj xt,j (s) + β13 xt,13 (s) + β14 xt,14 (s) + β15 xt,15 (s), s ∈ D, t = 1, . . . , 50, (5.1)
1012
YIN-PING CHEN AND HSIN-CHENG HUANG
Figure 6. (a) Elevations (in kilometers) of 79 sample stations (denoted as “◦”) and the locations of the 297 validation stations (denoted as “×”) for the precipitation dataset in Colorado. (b) The first eigenfunction ϕ1 (·) estimated by PML based on K = 1.
where xt,2 (s), . . . , xt,12 (s) are dummy variables for February, . . . , December, independent of s, such that xt,2 (s) = 1 if t falls in February and 0 otherwise, and so on, xt,13 (s) denotes the elevation (in kilometers) at location s independent of t, xt,14 (s) denotes the average daily maximum temperature (in degrees Celsius) at location s and time t, and xt,15 (s) denotes the extent of the average daily temperatures (in degrees Celsius) at location s and time t. We chose K ∈ {0, 1, 2, 3} and α ∈ [2−10 , 25 ] using 5-fold CV by randomly partitioning the sampling locations into five disjoint subsets of sizes 16, 16, 16, 16 and 15. For known θ, an unbiased predictor of yt (s) obtained from the universal kriging predictor Ybt (s) of (2.10) is (Journel (1980)) { } ybt (s) ≡ exp Ybt (s) + MSPEuk (s)/2 + x(s)′ m(s) − 1, (5.2) −1 ′ −1 where m(s) ≡ (X ′ Σ−1 Z X) (X ΣZ σY (s) − x(s)). The corresponding conditional MSPE is (Journel (1980); Chil`es and Delfiner (1999, p.191))
( )2 { } E ybt (s) − yt (s) = exp 2x(s)′ β + 2CY (s, s) [ { } × 1 + exp − MSPEuk (s) − 2x(s)′ m(s) { ( ) }] × exp − 2x(s)′ m(s) − 2 .
(5.3)
Our final predictor of ybt (s) and the corresponding conditional MSPE were obtained by plugging the PML estimates of β and θ into (5.2) and (5.3). For the proposed PML method, CV selected K = 1 with the estimated eigenfunction shown in Figure 6(b). Evidently, a nearly linear pattern from west
NONSTATIONARY SPATIAL MODELING USING PENALIZED LIKELIHOOD
1013
Figure 7. The predicted scores {w bt,1 : t = 1, . . . , 50} for ϕ1 (·) obtained from PML with K = 1 for the precipitation dataset in Colorado.
to east can be seen. As shown by the predicted scores, {w bt,1 : t = 1, . . . , 50}, in Figure 7, the precipitation tends to be higher in the west (east) during winter (summer). Note that in Colorado the mountains and ranges extend north and south approximately through the middle of the state and, hence, stop much of moisture from the Pacific Ocean and the Gulf of Mexico, particularly in winter when the prevailing winds come from the west with much of rain or snow falling on the mountaintops and westward-facing slopes, causing lighter precipitation in the eastern plain. On the other hand, the eastern plain tends to have more showers and thunderstorms in spring and summer due to warm and moist air from the south. In addition to the seasonal pattern, the w bt,1 ’s also showed some temporal dependence structure with the lag 1 sample autocorrelation 0.529, which could be modeled further but that is beyond the scope of this paper. The data were also analyzed by recursively applying Method III to the residuals obtained from generalized least squares fit of β for estimating θ until convergence, where the initial estimate of β was obtained using ordinary least squares. Different from the PML method, Method III chooses K = 2 eigenfunctions from CV. Table 10 displays the estimated parameters for both methods, where the estimated standard deviations for the elements of βbgls shown in parentheses ( ∑T ) ′Σ b −1 Xt −1 and were obtained from the square roots of the diagonal of X t Z ( ) (t=1 )−1 2 V bZ ≡ Φ b KΛ bKΦ b′ + σ bξ (θbξ ) + In since var(βbgls ) ≈ ∑T X ′ Σ b −1 Σ b . ε t Z Xt K t=1 The results show that the amounts of rainfall are affected by elevation, average maximum daily temperature, and some monthly effects. As we expect, higher temperatures tend to produce larger amounts of rainfall. Although the estimated coefficient for elevation is negative, higher elevations tend to have lower temperatures and hence smaller amounts of rainfall. Consequently, the overall effect of elevation on rainfall is not clear. Comparing these two methods, we notice that
1014
YIN-PING CHEN AND HSIN-CHENG HUANG
Table 10. Estimated parameters based on PML and Method III for the Colorado precipitation data, where values in parentheses are the corresponding estimated standard deviations.
τξ ρξ 2 ∫ 2σε λ1 ∫D ϕ1 (s)ds/|D| λ2 ∫D ϕ22 (s)ds/|D| λ3 D ϕ23 (s)ds/|D| β1 β2 β3 β4 β5 β6 β7 β8 β9 β10 β11 β12 β13 β14 β15
PML 3.137 39.050 0.056 0.057 1.485 (0.117) 0.139 (0.126) 0.458 (0.130) 1.271 (0.134) 1.863 (0.147) 2.119 (0.164) 2.230 (0.172) 2.444 (0.171) 1.980 (0.155) 1.257 (0.139) 0.404 (0.121) -0.151 (0.119) -0.139 (0.037) -0.065 (0.005) -0.003 (0.003)
Method III 1.349 47.614 0.059 4.575 0.080 -0.458 (0.211) 0.770 (0.295) 1.524 (0.299) 3.074 (0.303) 4.522 (0.310) 5.123 (0.322) 4.578 (0.328) 5.050 (0.327) 4.357 (0.315) 3.556 (0.303) 0.737 (0.281) 0.225 (0.280) -0.643 (0.035) -0.111 (0.004) -0.000 (0.003)
the variation of our method was contributed mainly by the stationary component, whereas that of Method III is contributed mainly by nonstationary components. We used the validation data to compare the performance between the two methods based on the averaged squared prediction errors 1 ASPE ≡ ∑50
nt 50 ∑ ∑ (
t=1 nt t=1 j=1
)2 zt (st,j ) − ybt (st,j ) ,
where zt (st,j ) denotes the observed precipitation at time t and site st,j , and nt is the total number of observed stations for the validation data at time t. The proposed method (based on K = 1) achieved an ASPE value of 9.815, smaller than the 11.751 obtained from Method III (based on K = 2). 6. Discussion In this paper, we consider nonstationary spatial modeling and develop a new EOF-type estimation method in the penalized likelihood framework. The
NONSTATIONARY SPATIAL MODELING USING PENALIZED LIKELIHOOD
1015
proposed method is applicable to sparse data and is shown to perform well in spatial prediction and covariance function estimation. Although the methodology is developed for complete data, the same PML formulation can be extended to allow for different missing observations at different time points, leading to more complicated formulae by having both missing observations and latent variables as missing data in the ECM framework. Specifically, and without loss of generality, we can assume that for each t = 1, . . . , T , we observe data at a subset of {s1 , . . . , sn } with size nt ≤ n. In (obs) other words, we can decompose Zt into the observed data Zt and the missing (mis) data Zt , t = 1, . . . , T . We also consider the same full negative penalized (mis) log-likelihood of (3.1), but treat both wt ’s and Zt ’s as missing data. Then the PML estimates for β and θ can be obtained by applying a similar ECM (obs) (obs) algorithm while conditioning only on Z1 , . . . , ZT in the E-step. Note that the proposed method is designed for small to moderately large n (number of data locations) since it requires taking the inverse of Vξ (θξ ) + In for various values of θξ ; that is difficult to handle if n is larger than a few thousands. Further research is needed to accommodate very large n using, for example, the tapering technique (Furrer, Genton, and Nychka (2006)), and to incorporate temporal dependence structure, say in terms of (4.4). Although CV appears to work well in selecting the number of eigenfunctions, we might further adopt some regularization method such as Lasso (Tibshirani (1996)) by adding a specific penalty to the proposed PML; this would allow simultaneous selection of K and parameter estimation.
References Alishouse, J. C., Crone, L. J., Fleming, H. E., Van Cleef, F. L. and Wark, D. Q. (1967). A discussion of empirical orthogonal functions and their application to vertical temperature profiles. Tellus 19, 477-482. Braud, I., Obled, Ch. and Phamdinhtuan, A. (1993). Empirical orthogonal function (EOF) analysis of spatial random fields: Theory, accuracy of the numerical approximations and sampling effects. Stochastic Hydrology and Hydraulics 7, 146-160. Chil`es, J. P. and Delfiner, P. (1999). Geostatistics: Modeling Spatial Uncertainty. Wiley, New York. Cohen, A. and Jones, R. H. (1969). Regression on a random field. J. Amer. Statist. Assoc. 64, 1172-1182. Cressie, N. (1993). Statistics for Spatial Data. Revised edition. Wiley, New York. Cressie, N. and Wikle, C. K. (2011). Statistics for Spatio-Temporal Data. Wiley, New York. Creutin, J. D. and Obled, C. (1982). Objective analysis and mapping techniques for rainfall fields: an objective comparison. Water Resources Research 18, 413-431. Deville, J. C. (1974). M´ethodes statistiques et num´eriques de l’analyse harmonique. Annales de l’INSEE 15, 1-101.
1016
YIN-PING CHEN AND HSIN-CHENG HUANG
Duchon, J. (1977). Splines minimizing rotation-invariant semi-norms in Sobolev spaces. Constructive Theory of Functions of Several Variables (Edited by W. Schempp and Z. Keller), 85-100. Springer-Verlag, Berlin-Heidelberg. Furrer, R., Genton, M. G. and Nychka, D. (2006). Covariance tapering for interpolation of large spatial datasets. J. Comput. Graph. Statist. 15, 502-523. Green, P. J. and Silverman, B. W. (1994). Nonparametric Regression and Generalized Linear Models: A Roughness Penalty Approach. Chapman & Hall. Hannachi, A., Jolliffe, I. T. and Stephenson, D. B. (2007). Empirical orthogonal functions and related techniques in atmospheric science: a review. Internat. J. Climatology 27, 11191152. Holmstr¨ om, I. (1963). On a method for parametric representation of the state of the atmosphere. Tellus 15, 127-149. H¨ ormann, S. and Kokoszka, P. (2010). Weakly dependent functional data. Ann. Statist. 38, 1845-1884. Chang, Y.-M., Hsu, N.-J. and Huang, H.-C. (2010). Semiparametric estimation and selection for nonstationary spatial covariance functions. J. Comput. Graph. Statist. 19, 117-139. Huang, J., Shen, H. and Buja, A. (2008). Functional principal components analysis via penalized rank one approximation. Electronic J. Statist. 2, 678-695. Jolliffe, I. T. (2002). Principal Component Analysis. 2nd edition. Springer, New York. Journel, A. G. (1980). The lognormal approach to predicting local distribution of selective mining unit grades. Math. Geology 12, 285-303. ¨ Karhunen, K. (1947). Uber lineare Methoden in der Wahrscheinlichkeitsrechnung. Annales Academiae Scientiarum Fennicae 37, 1-79. Karl, T. R., Koscielny, A. J. and Diaz, H. F. (1982). Potential errors in the application of principal component (eigenvector) analysis to geophysical data. J. Appl. Meteorology 21, 1183-1186. Lo`eve, M. (1978). Probability Theory. Springer-Verlag, New York. Lorenz, E. N. (1956). Empirical orthogonal functions and statistical weather prediction. Scientific Report No. 1, Statistical Forecasting Project, Department of Meteorology, Massachusetts Institute of Technology. Meng, X.-L. (1994). On the Rate of Convergence of the ECM Algorithm. Ann. Statist. 22, 326-339. Meng, X.-L. and Rubin, D. B. (1993). Maximum likelihood estimation via the ECM algorithm: a general framework. Biometrika 80, 267-278. Nott, D. J. and Dunsmuir, T. M. (2002). Estimation of nonstationary spatial covariance structure. Biometrika 89, 819-829. Obled, C. and Creutin, J. D. (1986). Some developments in the use of empirical orthogonal functions for mapping meteorological fields. J. Climate and Applied Meteorology 25, 11891204. Obukhov, A. M. (1960). The statistically orthogonal expansion of empirical functions. Bulletin of the Academy of Sciences of the U.S.S.R.: Geophysics Series 1, 288-291. Preisendorfer, R. W. (1988). Principal Component Analysis in Meteorology and Oceanography. Elsevier, Amsterdam. Tibshirani, R. (1996). Regression shrinkage and selection via the LASSO. J. Roy. Statist. Soc. Ser. B 58, 267-288.
NONSTATIONARY SPATIAL MODELING USING PENALIZED LIKELIHOOD
1017
Wahba, G. (1990). Spline Models for Observational Data. Society for Industrial and Applied Mathematics, Philadelphia. Wikle, C. K. and Cressie, N. (1999). A dimension-reduced approach to space-time Kalman filtering. Biometrika 86, 815-829. Wilks, D. S. (1995). Statistical Methods in the Atmospheric Sciences. Academic Press, San Diego. Yao, F., M¨ uller, H. G. and Wang, J. L. (2005). Functional data analysis for sparse longitudinal data. J. Amer. Statist. Assoc. 100, 577-590. Institute of Statistics, National Central University, Taoyuan 32049, Taiwan. E-mail:
[email protected] Institute of Statistical Science, Academia Sinica, Taipei 11529, Taiwan. E-mail:
[email protected] (Received October 2011; accepted September 2012)