Indian Journal of Chemical Technology Vol. 22, November 2015, pp. 338-343
Note A new cloud point microextraction method for preconcentration and determination of copper in water samples Gholamreza Khayatian*, Mahdi Hashemi & Shahed Hassanpoor Chemistry Department, Faculty of Science, University of Kurdistan, Sanandaj, Iran E-mail:
[email protected],
[email protected] Received 23 January 2013; accepted 17 March 2014 A simple and practical preconcentration method using ultrasound-assisted cloud point extraction for determination of Cu(II) in various water samples has been developed. 2-mercaptopyrdin-n-oxide as a complexing agent and Triton X-114 as a surfactant are used in proposed method. After phase separation, the surfactant-rich phase is diluted with methanolic nitric acid and determined by flame atomic absorption spectroscopy. The variables parameters affecting the complexation and extraction steps are optimized. Under optimum conditions, the detection limit of 2.2 ng mL-1 is obtained for Cu(II) ions. The method is successfully applied to the determination of Cu(II) in drinking and mineral water samples. Keywords: Ultrasound-assisted cloud point preconcentration, Copper, Triton X-114
Trace metals play an important role in human metabolism and either excess or deficiency of them in the living organism can lead to biological disorder 1,2. Copper is an important bio-element present in animals, plants and microorganism3. However, high amounts of copper can be harmful, causing irritation of nose and throat, nausea, vomiting, and diarrhea. Very high doses of copper can cause damage to liver and kidneys. Humans are commonly exposed to copper from drinking water, breathing air, food or through having skin contact with copper, particles attached to copper, or copper containing compounds4. Therefore, there is a great need to develop a simple, sensitive, selective and inexpensive method for the determination and continuous monitoring of this metal level in food and water samples5,6. There are several techniques which have been used for determination of copper at low concentration, such as inductively coupled plasma-optical emission spectroscopy7,8, microwave-induced plasma9, electrothermal atomic absorption spectrometry10,11, and inductively coupled plasma-mass spectrometry12,13.
These methods involve a greater cost and increase instrumentation complexity, limiting its widespread application to routine analytical work14. Flame atomic absorption spectrometry (FAAS) is the most widely used analytical method for trace metal quantification in environmental (water, soil, sediment and particular material), biological and foodstuff samples. This is most probably due to its low cost, friendly operation, high sample throughput and good selectivity. However, the relatively low sensitivity of FAAS and the interfering effect's sources from the matrix of the real samples are two main difficulties in these determinations. In order to overcome these difficulties, enrichment / separation methods have been commonly used for the sample pre-treatment. Among of different preconcentration techniques cloud point extraction (CPE)14-19 is a powerful method to effectively enhance atomic absorption spectrometry΄s sensitivity and selectivity2. It is well-known that ultrasound is a powerful aid in the acceleration of various steps, such as homogenizing, emulsion forming, and mass transferring between immiscible phases, in the processes of separation and extraction20,21. It is a key technology in achieving the objective of sustainable green chemistry. Using ultrasound, full extractions can now be completed in minutes with high reproducibility, reducing the consumption of solvent, simplifying manipulation and work up; giving higher purity of the final product. However, organic solvents tend to volatilize under the ultrasonic radiation22. As a result, combination of the advantages of ultrasound, triton X-114, and cloud point extraction a method ultrasound-assisted cloud point extraction was developed that simplicity, low cost, fast, high enrichment factor, and low consumption of the nonvolatile extraction phase are the advantages of the proposed method. The aim this work is the development of a simple analytical method by combination of ultrasound assisted emulsification microextraction with cloud point extraction (USAE-CPE) for the determination of Cu2+ in water sample by flame atomic absorption spectroscopy. The possible affecting factors such as the amount of triton X-114, sample pH, concentration of complexing agent, temperature and salt effect were studied.
NOTES
Experimental Section Instrumentation
Determination of copper and other cations were performed on a Shimadzu AA-670 atomic absorption spectrometer (Kyoto, Japan) under the recommended condition for each metal ion. Hollow Cathode lamps from Perkin-Elmer were operated at 6 mA with measurement at 324.8 nm, using a slit width of 0.5 nm for Cu. All pH measurments were made using a Metrohm E-691 digital pH meter with a combined glass electrode. A model Labofuge 400 (Germany) centrifuge was used to accelerate phase separation. A model 5600S (parsnahand, Iran), 28 kHz, 100 W ultrasonic bath with temperature control was used to assist the emulsification process of the microextraction technique. Reagents
Extra pure ethanol, methanol, acetonitrile (AN), nitric acid, hydrochloric acid, phosphoric acid and Triton X-114 (Merck) were used as received. Metal salts were analytical grade and purchased from Merck. A stock standard solution of copper 1000 mg/L was prepared by dissolving of 0.1900 g of Cu(NO3)2.3H2O in deionized water and then the solution diluted to a given volume. Working standard solutions of copper were freshly prepared by successive dilution of the standard stock solution to the desired concentrations. Solutions of the nonionic surfactant triton X-114 were prepared at the 0.15% (v/v) concentration. Buffer solutions were prepared from H3PO4 and NaH2PO4.4H2O. A 1.0 µM of ligand stock solution was prepared by dissolving appropriate amount of 2-mercaptopyridine n-oxide sodium salt (Fluka) in small amount of ethanol and diluted to mark with deionized water.
339
remaining micellar phase was dissolved in 0.3 mL 1.0 mol L-1 HNO3 in methanol (final solution was 0.4 mL) and then determined by FAAS. Results and Discussion Effect of the Triton X-114 Concentration
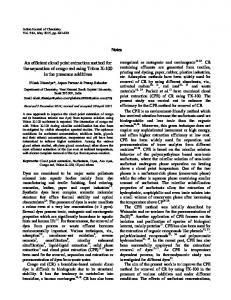
Triton X-114 is one of the non-ionic surfactants extensively use in CPE23-25. This is due to its advantages such as commercial availability with high purity, low toxicity and cost, the high density of the surfactant-rich phase facilitating the phase separation by centrifugation, and relatively low cloud point temperature. The effect of the Triton X-114 concentration on copper extraction was evaluated by varying the surfactant concentration in the range of 0.01-0.30% (v/v). As can be seen in Fig. 1, Cu2+ absorbance increased with the increase of TritonX114 concentration in the range of 0.01-0.1% (v/v) and then remained constant in the concentration range of 0.1-0.2% (v/v). Increasing Triton X-114 concentration above 0.2% (v/v) decrease extraction efficiency, presumably due to the increment in the volumes and viscosity of the surfactant-rich phase that deteriorating the FAAS signal. Therefore, a Triton X-114 concentration of 0.15% (v/v) was employed in all further studies in order to achieve the high extraction process efficiency. Effect of ultrasonic time
It is well known, the high viscosity of triton X-114 decelerates the mass transfer of the analyte through the interfaces. In the triton X-114 ultrasound assisted cloud point extraction method, the interface between the
Extraction procedure
Triton X-114 (100 µL, 0.15% (v/v)) and 1 mL ligand 100 µM were transferred to 15 mL conical tubes containing 5 mL of standard solution ( standard solution was diluted with phosphate buffer with concentration of 0.01 M with pH = 3 ) or real sample. The tubes were immersed into ultrasonic bath with temperature of 25°C to disrupt triton X-114. The Triton X-114 becomes turbid when sonicated for 60 s and then was heated in a water bath at 50°C for 4 min. Phase separation was induced by centrifuging for 7 min at 3500 rpm. After that the mixture put in ice acetone bath for 5 min and then aqueous phase collected with a syringe. For reduce viscosity, the
Fig. 1Effect of the triton X-114 concentration on absorbance of copper. Condition: water sample volume, 5.0 mL; concentration of Cu(II), 200 g L-1;
340
INDIAN J. CHEM. TECHNOL., NOVEMBER 2015
extraction solvent and the bulk aqueous phase (sample) was enormously enlarged by forming cloudy solution. Consequently, the equilibrium of the extraction was achieved in a short time. So, the effect of sonication time was evaluated and it was found that the extraction efficiency reached a maximum and was independent of the time of sonication when it is greater than 1 min. Therefore, 1 min was chosen for further studies.
increases with increasing of the ligand concentration. However, the signal was not altered by addition of ligand concentration beyond 70 µM. This observation may be interpreted by considering a quantitative extraction of the analyte in such condition. Thus, a concentration of 100 µM was selected as a suitable amount of pyrithione for the extraction process. Effect of salt
Effect of temperature
In cloud point extraction system, temperature of extraction is very important parameter for micelles occurring26. The effect of temperature was investigated in the range of 25-65°C. It was found that CPE sensitivity increased with increase in temperature from 25-45°C and reach maximum in the range of 45-55°C. Over 55°C, the CPE sensitivity decreased probably due to the stability problems for chelate and chelating agent27. Thus, a CPE temperature of 50°C was used. Studies on the effect of the incubation time showed that a time of 4 min is adequate to achieve complete extraction. So, for the further experiments, an incubation time of 4 min was used.
The addition of an electrolyte to aqueous solutions of non-ionic surfactant usually alters the cloud point due to the salting out effect28. Some electrolytes reduce the cloud point temperature while others
Effect of centrifugation time
In CPE method, centrifugation time hardly affects micelle formation but accelerates phase separation, as in conventional separation of a precipitate from its original aqueous environment. Centrifugation times at 3500 rpm have been studies in the range of 1-15 min. The results indicate that centrifugation for 10 min lead to the highest recovery and sensitivity for the copper ion.
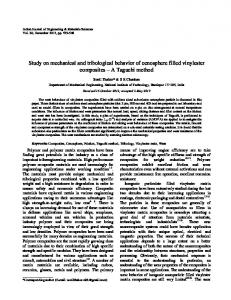
Fig. 2Effect of pH on absorbance of copper. Condition: water sample volume, 5.0 mL; concentration of Cu(II), 200 g L-1; 100 µL 0.15% triton X-114; temperature 50°C
Effect of pH
The influence of the pH of aqueous phase on the CPE of copper was studied in the pH range of 2.0-9.0. The pH was adjusted using either 0.1 mol L-1 nitric acid or sodium hydroxide (Fig. 2). The results indicate that maximum sensitivity by CPE was obtained at the pH ranges of 2-4, at higher pH values the absorbance signal and the recovery gradually decrease. These observations may be due to formation of metal hydroxide species such as Cu(OH)+, which cause formation of copper pyrithione complexes decrease at this pH range. Therefore, to achieve high efficiency, a pH of 3 was selected for subsequent work. Effect of ligand concentration
The effect of thione concentration on the absorbance of copper has been studied and the results are shown in Fig. 3. The variation of analytical signal as a function of ligand concentration in the range of 0150 µM is examined. As can be seen, the absorbance
Fig. 3Effect of concentration of 2-mercaptopyridine n-oxide on absorbance of copper. Condition: water sample volume, 5.0 mL; concentration of Cu(II), 200 g L-1; 100 µL 0.15% triton X-114; temperature 50°C. phosphate buffer pH=3
NOTES
present a contrary effect29. The effect of ionic strength on the analytical signal of copper was investigated using NaCl at concentrations from 0.2-16 % (w/v) and the results were shown in the Fig. 4. As can be seen, the analytical signal increases as the concentration of NaCl increase until a concentration of 8%. After that a considerable decrease in the absorbance signal is observed with increasing the NaCl concentration. This effect might be explained by the additional surface charge when the NaCl concentration is very high, thus changing the molecular architecture of the surfactant and consequently the micelle formation process 30. Therefore an 8% (w/v) of NaCl was chosen for further experiments.
341
phase after phase separation in order to facilitate its introduction into the nebulizer of atomic absorption spectrometer. For this reason the volume of diluents was tested in rang of 0.1-0.8 mL. As can be seen in Fig. 6, the absorbance was maximum in rang of 0.25-0.35 mL. Therefore a 0.3 mL of methanol containing 1.0 M nitric acid was chosen for subsequent experiments. Effect of diverse ions
The effect of common coexisting ions on the extraction copper was also studied. In these experiments, 5.0 mL of solutions containing 200 μg L−1
Effect of dilution agent for the surfactant-rich phase
The very high viscosity of the surfactant-rich phase is markedly decreased using a small amount of diluting agents. Different solvents such as methanol, ethanol, nitric acid dimethylforamide, ethanolic and methanolic nitric acid were tried as diluting agents to select the one producing the optimal analytical signal. Figure 5 show the best result was obtained with methanol containing 1.0 mol L-1 nitric acid. Effect of diluent volume
Since the surfactant-rich phase obtained after the cloud point preconcentration contains a high concentration of Triton X-114 and, at the same time, the volume obtained is rather small31, 1.0 mol L-1 HNO3 in methanol was added to the surfactant-rich
Fig. 4Effect of salt on absorbance of copper. Condition: water sample volume, 5.0 mL; 1.0 mL 100 µM 2-mercaptopyridine noxide; concentration of Cu(II), 200 g L-1; 100 µL 0.15% triton X-114; temperature 50°C. phosphate buffer pH=3
Fig. 5Effect of dilution agent on absorbance of copper. Condition: water sample volume, 5.0 mL; 1.0 mL 100 µM 2mercaptopyridine n-oxide; concentration of Cu(II), 200 g L-1; 100 µL 0.15% triton X-114; temprature 50°C; 8% NaCl. phosphate buffer pH=3
Fig. 6Effect of diluent volume on absorbance of copper. Condition: water sample volume, 5.0 mL; 1.0 mL 100 µM 2-mercaptopyridine n-oxide; concentration of Cu(II), 200 g L-1; 100 µL 0.15% triton X-114; temprature 50°C; 8% NaCl. phosphate buffer pH=3
342
INDIAN J. CHEM. TECHNOL., NOVEMBER 2015
of metal ion and various amounts of diverse ions were treated according to the recommended procedure. A given number of species was considered to interfere if it resulted in a ±5% variation of the absorbance signal. The results were given in Table 1. As can be seen from Table 1, the majority of the investigated ions have no significant influence on extraction of Cu2+ under the selected conditions. This may be due to formation of more stable complexes of Cu2+ ions with pyrithione than the other metal ions studied. The maximum interfering effect obtained by Fe3+ ions that form more stable complex with pyrithione than the Cu2+ ions. Lofts showed that the pyrithione can forms an ML2 complexes with Cu2+, on the other hand, stability constants and hence, reactivity of the ligand toward metal ions followed the order of Fe(III) > Cu(II) > Pb(II) > Zn(II) > Ni(II) > Co(II) > Cd(II) > Mn(II) > Ca(II)32. Therefore, it is not surprising that other cations except Fe3+ cannot significantly interfere in the extraction of Cu2+ from aqueous solution in the appropriate condition. The probable mechanism may be given as follow: 2HPT+ Cu2+ → Cu(PT)2 + 2H+ Cu(PT)2 + Triton X-114 → [Cu(PT)2][ Triton X114](sedimented phase)
pH < 2.0 with concentrated HNO3 and stored in precleaned polyethylene bottles. In order to determine copper, aliquot 50.0 mL sample oxidized by addition of 5.0 mL concentrated HNO3 and 1.0 mL concentrated H2O2 (30%). The beaker was covered with watch glass and heated at 100°C for 30 min to complete the oxidation33. The results along with the recovery for the spiked samples are given in Table 3. As can be seen, the added copper is quantitatively recovered from water samples.
Analytical figures of merit
a
Under the optimum experimental conditions, the analytical curve was linear in the range of 5-1000 µg L-1 with a correlation coefficient of (R2) 0.998. The limit of detection (LOD), calculated as the concentration of the absolute amount of analyte yielding a signal equivalent to three times the standard deviation of the blank (n= 10, LOD = 3σblank /slope) in accordance to IUPAC recommendation, was 2.2 g L-1. The results are summarized in Table 2.
Comparison of proposed method with other methods
Determination of copper by ultrasound-assisted cloud point extraction was compared with other reported methods, and results are shown in Table 4. Table 2Analytical figures of merit. Analytical parameters Linear dynamic range (g L-1) Slope (abs mg-1 L) Intercept Correlation coefficient Detection limit (g L-1) RSDa (%) Enrichment factor b Recovery (%) C
Relative standard deviation (n = 10 , 200.0 g L-1) The enrichment factor is the ratio of copper concentration in methanolic nitric acid (400 L) to that in the bulk phase initially (6.1 mL). c The recovery of extraction was calculated according to R = (Co · Vo) / (C aq0 Vaq) × 100 where Co and C aq0 are the concentrations in methanolic nitric acid and aqueous phases and Vo and Vaq are the volumes of the methanolic nitric acid and the aqueous phases, respectively b
Table 3The application of proposed method for determination of copper in natural waters (N=3). Sample (µg L-1) Tap water
Analysis of natural waters
The proposed method was successfully used for the determination of copper in several water samples. Three mineral water (Vata, Hayat, Pak, IRAN) and tap water (Sanandaj, IRAN) were acidified to
Mineral water (Vata)
Table 1Effect of diverse ions on the extraction of 200 µg L-1 Cu (II). Coexisting ions Al3+, Cd2+, Na+, Hg2+, Zn2+, Co2+, Pb2+, Ca2+, K+, CH3COO-, NO3-, PO43-, Br-, Cl -, NH4+ Mg2+, Fe2+, Ni2+ Fe3+
Mineral water (Hayat)
Amount of interfere (mg L -1) 1000
500 50
Cu(II) 5-1000 0.710 0.01 0.998 2.2 1.6 15.28 100.2
Mineral water (Pak)
Added 0 100 500 0 100 500 0 100 500 0 100 500
Mean ± standard deviation
a
Found Recovery (%) a 5 ± 0.5 − 105.9 ± 1 100.8 ± 0.9 506.7 ± 2.4 100.3 ± 0.5 6.3 ± 0.1 − 106 ± 0.1 99.7 ± 0.1 505.7 ± 0.1 99.9 ± 0.5 8.2 ± 0.6 − 108.0 ± 0.4 99.8 ± 0.6 512.9 ± 2.8 100.9 ± 0.6 7.2 ± 0.3 − 106.7 ± 2.5 99.5 ± 2.5 508.0 ± 2 100.2 ± 0.4
NOTES
343
Table 4Comparison of the proposed method with other reported methods for determination and preconcentration of copper. Analytical technique CPE-FAAS SPE- FAAS LLE- UV/ Vis SPE-FAAS CPE-FAAS CPE-FAAS CPE-UV/Vis USAE-CPE-FAAS
LOD (g L-1) 1.4 0.64 27 3 5 1.64 1.2 2.2
LDR (g L-1) 250-5000 200-400 10-1000 4.0-150 4.0-115 5.0-1000
Enrichment factor
Sample volume (mL)
RSD (%)
Ref.
35 62.5 10 20 22 31 125 15.3
15 40 200 250 25 50 10 5
2.6 < 12 2.8 3.4 1.6
31 34 35 36 37 38 39 This work
As can be seen, the proposed procedure shows good detection limit and precision, wider linear dynamic range, which are better in most cases and are comparable with reported methods in other cases. Conclusion In this work, the use of micellar systems as a separation and preconcentration for Cu(II) offers several advantages including low cost, safety, preconcentration of Cu(II) with high recoveries and very good extraction efficiency. The performance of this procedure in the extraction of copper from different real water samples is excellent. References 1 2 3
4 5 6 7 8
9 10 11 12 13 14
Mondal B C, Das D & Das A K, J Trace Elem Med Biol, 16 (2002) 148. Sahin CA, Tokgoz, I & Bektas S, J Hazard Mater, 181 (2010) 359. Kaim, W, Schwederski B, Bioinorganic Chemistry: Inorganic Elements in the Chemistry of Life (John Wiley, New York), 1991. Mohamadi S Z, Afzali D & Baghelani Y M, Anal Chim Acta, 653 (2009) 173. Ghaedi M, Fathi M R, Marahel F & Ahmadi F, Fresen Environ Bull, 14 (2005) 1158. Pappas R S, Polzin G M, Zhang L, Watson C H, Paschal D C & Ashley D L, Food Chem Toxicol , 44 (2006) 714. Takara A, Pasini-Cabello S D, Cerutti S, Gasquez J A & Martinez L D, J Pharm Biomed Anal, 39 (2005) 735. Bezerra M A, Dos Santos W N L, Lemos V A, Das Gracas M, Korn A & Ferreira S L C, J Hazard Mater, 148 (2007) 334. Jankowski K, Yao, J, Kasiura, K, Jackowska, A & Sieradzka, A, Spectrochim Acta B, 60 (2005) 369. Stafilov T, Spectrochim Acta B, 55 (2000) 893. Zendelovska D, Pavlovska G, Cundeva K & Stafilov T, Talanta, 54 (2001) 139. Tonello P S, Rosa A H, Abreu J C H & Menegario A A, Anal Chim Acta, 598 (2007) 162. Pozebon D, Dressler V L & Curtius A J, J Anal At Spectrom 13 (1998) 363. Miura J, Ishii H & Watanabe H, Bunseki Kagaku, 25 (1976) 808.
15 Ghaedi M, Shokrollahi A, Ahmadi F, Rajabi H R & Soylak M, J Hazard Mater, 150 (2008) 533. 16 Meeravali N N & Jiang S, Talanta, 80 (2009) 173. 17 Talio M C, Luconia M O, Masib A N & Fernández L P, J Hazard Mater, 170 (2009) 272. 18 Niazi A, Momeni-Isfahania T & Ahmari Z, J Hazard Mater, 165 (2009) 1200. 19 Lemos V A, Santos M S, David G T, Maciel M V & Bezerra M A, J Hazard Mater, 159 (2008) 245. 20 Priego C F & Luque M D, Anal Bioanal Chem, 387 (2007) 249. 21 Luque M D & Priego C F, Anal Chim Acta, 583 (2007) 2. 22 Li S, Cai,S, Hu W, Chen H & Liu, H, Spectrochim Acta B, 64 (2009) 666. 23 Paleologos E K, Giokas D L & Karayannis M L, Trends Anal Chem, 24 (2005) 426. 24 Hinze W L & Pramauro E, Crit Rev Anal Chem, 24 (1993) 133. 25 Fathi S A M & Yaftian M R, J Colloid Interface Sci, 334 (2009) 167. 26 Bosch Ojeda C & Sanchez Rojas F, Anal Bioanal Chem, 394 (2009) 759. 27 Stalikas C D, Trends Anal Chem, 21 (2002) 343. 28 Silva E L, Dos Santos Roldan P & Gine M F, J Hazard Mater, 171 (2009) 1133. 29 Hinze W L & Pramauro E, Crit Rev Anal Chem, 24 (1993) 133. 30 Ghaedi M, Shokrollahi A, Niknam K, Niknam E, Najibi A & Soylak M, J Hazard Mater, 168 (2009) 1022. 31 Ghaedi M, Niknam K, Niknam E & Soylak M, J Chin Chem Soc, 56 (2009) 986. 32 Lofts S, 2009. NERC/Centrefor Ecology and Hydrology, 8 pp. (CEH Project Number: C03634) (Unpublished). 33 Pereira A S, Ferreira G, Caetano L, Martines M A U, Padilha P M, Santos A & Castro G R, J Hazard Mater, 175 (2010) 399. 34 Yıldız O, Citak D, Tuzen M & Soylak M, Food Chem Toxicol, 49 (2011) 458. 35 Rekha D, Suvardhan, K, Kumar K S, Reddyprasad P, Jayaraj B & Chiranjeevi P, J Serb Chem Soc, 72 (2007) 299. 36 Aydemir N, Tokman N, Akarsubasi A T, Baysal, A & Akman S, Microchim Acta, 175 (2011) 185. 37 Liang P & Yang J, J Food Compos Anal, 23 (2010) 95. 38 Gündüz, Z Y, Urucu O A, Yetimoğlu E K & Filik H, Maced J Chem Chem Eng, 32 (2013) 69. 39 Gouda A A & Amin A S, Spectrochim Acta A, 12 (2014) 88.