Notes On Using Optimization And DSS Techniques To Support Supply Chain And Logistics Operations Tan Miller Harper Professor of Global Supply Chain Management College of Business Administration, Rider University
[email protected] Summary. In this article, we offer recommendations on approaches that can further the rate of use of optimization and related methods in firms that may not have a rich history of utilizing these types of techniques. We begin by reviewing a framework for organizing operations from the strategic level to the daily operating level. Next, we consider traditional opportunities to employ optimization and related methods across this framework of activities. We then describe a general operating approach to facilitate the use of optimization and related Decision Support System (DSS) methods as a standard business practice. Finally, “lessons learned” from the author’s implementation of DSS in several industries are discussed.
1 Introduction There are certain industries that have historically used optimization and related operations research techniques as key components of their standard business practice. The airline and oil industries represent two examples that for decades have heavily utilized Operations Research (OR) techniques to support operations. There are also a wide range of firms that utilize optimization and OR techniques on a much more sporadic or one-off basis. In this article, we offer suggestions and recommendations on approaches that can further the rate of use of optimization and related methods in firms that may not have a rich history of utilizing these types of techniques. The remainder of this article is organized as follows. We begin with a review of a framework for organizing operations from the strategic level to the daily operating level. This will provide context for the balance of the article. We next consider traditional opportunities to employ optimization and related methods across this framework of activities. This section will also address “barriers and impediments” that exist in many organizations which lead to an underutilization of OR methods. Following this, we review an approach that the author has employed in industry practice to facilitate effective and regular
196
Miller
use of optimization and related Decision Support System (DSS) methods. This discussion will include citations from several implementations. The paper concludes with some “lessons learned” and final thoughts. 1.1 Hierarchical Framework For Organizing Supply Chain Operations There are major organizational issues, systems and infrastructure considerations, methodology issues, and numerous other problem dimensions to evaluate in formulating a firm’s distribution and supply chain network planning approach. From all perspectives, effective supply chain planning over multiple time horizons requires that a firm establish appropriate linkages across horizons and establish points of intersections between these horizons. To facilitate a planning system that possesses the appropriate linkages, a firm must have an overall framework that guides how different planning horizons and planning components fit together. Figure 1 presents a general framework for hierarchical supply chain planning which defines three levels, namely the strategic, tactical, and operations level. As Figure 1 illustrates, strategic planning activities focus on a horizon of approximately two or more years into the future, while tactical and operational activities focus on plans and schedules for 12 to 24 months, and one to 18 months in advance, respectively. At the strategic level, a firm must address such key issues as overall corporate objectives, market share and profitability goals, business and product mix targets, and so on. Planning decisions on overall corporate objectives drive strategic supply chain decisions. For example, market share and business or product mix objectives will strongly influence manufacturing capacity strategies. At the strategic manufacturing planning level, the firm must address such issues as planned production capacity levels for the next three years and beyond, the number of facilities it plans to operate, their locations, the resources the firm will assign to its manufacturing operations, and numerous other important long term decisions. Decisions made at the strategic level place constraints on the tactical planning level. At the tactical level, typical planning activities include the allocation of capacity and resources to product lines for the next 12 to 18 months, aggregate planning of workforce levels, the development or fine-tuning of distribution plans, and numerous other activities. Within the constraints of the firm’s manufacturing and distribution infrastructure (an infrastructure determined by previous strategic decisions), managers make tactical (annual) planning decisions designed to optimize the use of the existing infrastructure. Planning decisions carried out at the tactical level impose constraints upon operational planning and scheduling decisions. At this level, activities such as distribution resource planning, rough cut capacity planning, master production scheduling, and shop floor control scheduling decisions occur.
Title Suppressed Due to Excessive Length
Corporate • Objectives • Product/market mix
Manufacturing • Plans •Capacities •Facilities •Locations
197
Strategic
(2 yrs. +)
Constraints Aggregate Production/Distribution Planning
• Allocates capacity and
Tactical (12 to 24 months)
resources to product lines
• Assigns sales regions to DC’s & plants
Constraints Operations Scheduling • Distribution Resource planning (DRP) • Master production scheduling • Short run DC workload scheduling
Operational (1 to 18 months)
Constraints Short-term scheduling (shop floor)
Fig. 1. A Hierarchical Supply Chain Planning Framework
The feedback loops from the operational level to the tactical level and from the tactical level to the strategic level represent one of the most important characteristics of the supply chain planning system illustrated in Figure 1. To assure appropriate linkages and alignment between levels, a closed-loop system which employs a “top down” planning approach complemented by “bottom up” feedback loops is required. For example, production and distribution plans which appear feasible at an aggregate level can often contain hidden infeasibilities that only manifest themselves at lower, more disaggregated lev-
198
A N N U P A R L O C F E O S R S E C A S T I N G
Miller
DRP/Inventory Mgmt System: Short Term Net Requirements By Week, By SKU or Family By DC
Annual Forecasts By Sales Region By Product Line
Annual Forecasts By Sales Region By Product Family*
Plant/DC/Family Optimization Model
Operational Forecasting System
P L A N T
Weekly Product Family Net Requirements By Plant
Annual Production Plan By Plant, By Family and Sourcing Plan, Plant/DC/Sales Region Assignments
(1) (1)
Family Weekly Production Scheduling Model By Plant, By Family
Master Production Schedule By Plant, By Family
End Item Weekly Production Scheduling Model By Plant, By Item Order Management
Transportation Planning And Scheduling: Inbound And Outbound
(4)
Warehouse Planning And Scheduling
S C H E D U L I N G
(2)
(3) (3)
Master Production Schedule By Plant, By End Item
Processed Orders
Shipping Schedules: Inbound and Outbound
(5)
Trailer Yard Management
(6)
Annual planning process Operational planning/scheduling process Feedback loop Planning Tool Output and/or input
Warehouse Schedules
Yard Schedules
ORDER WAREHOUSE AND TRANSPORTATION SCHEDULING
Fig. 2. Integrated Production And Distribution Planning System (Tactical/Annual Planning and Operational Scheduling)
els. Without proper feedback loops imbedded into its planning system, the danger that a firm will attempt to move forward with infeasible plans always exists. These infeasibilities often do not surface until a firm is in the midst of executing its operational plans and schedules. For additional detail on the importance of feedback loops, the reader is referred to hierarchical production planning literature (see e.g., [3], [7]). Additionally, Appendix B presents an illustrative example of a feedback loop from the operational level to the tactical level.
P R O C E S S
Title Suppressed Due to Excessive Length
199
2 The Role Of Optimization And Simulation To Support A Hierarchical Framework One can support the framework depicted in Figure 11 with a wide variety of optimization and simulation models at all three levels of the planning hierarchy. To illustrate these potential opportunities, consider Figure 2 which presents a generic tactical, operational (and strategic) supply chain planning system. We refer the reader to [7] for a lengthy review of the hierarchical system depicted. For purposes of this paper, Figure 2 serves to illustrate where opportunities to employ optimization reside across the supply chain at a high level. Specifically, the rectangles in Figure 2 “with numbers in parentheses” represent activities where optimization models and related tools either play or should play a significant decision support role. We now briefly review these potential applications and discuss “enablers” and “impediments” that impact these opportunities. Model (1) labeled “Plant/DC/Family Optimization Model” represents one of the most critical points in supply chain planning where firms should - but frequently do not - employ optimization models. As Figure 2 depicts, a firm should establish an integrated production and distribution plan as part of its tactical (annual) planning process. This need applies whether a particular firm has a large global manufacturing and distribution network, or a more moderate sized domestic network. As long as there are significant costs, service and/or capacity trade-offs that require evaluation; an optimization model has an important rule to play in the tactical planning process. The integrated production and distribution tactical plan that model (1) creates should at the minimum provide the following: •
•
A production plan for each plant in the network. Typically this plan should be at a product family level, or some other appropriate level of aggregation above the item level. A distribution plan for all Distribution Centers (DCs) that establishes network sourcing or flow relationships from plants to DCs to customers. Again this plan is generally developed at an appropriate level of product aggregation such as product family.
An optimization approach for this model assures that a firm can generate a cost minimizing or profit maximizing plan that accounts for all pertinent costs, capacities and service requirements across the network. Most critically, this approach facilitates an integrated plan which will align manufacturing and distribution activities. Despite the seemingly self-evident reasons to employ optimization models at this point in the supply chain planning process, a number of barriers limit the implementation rate of truly cross-functional integrated optimization ap1
See Appendix A for a brief discussion of the components of this system
200
Miller
proaches. The following represent some of the key impediments to broader scale use of model (1) in practice. •
•
•
Many senior managers and decision-makers responsible for manufacturing and distribution do not understand the potential benefits of optimization. It may seem hard to believe that after decades of use and availability, optimization methods remain a “black box” in many firms and industries. Managers caught up in the frenetic pace of the corporate world simply may not be willing or have the interest to invest their organization’s time in understanding, developing and implementing large-scale optimization based planning systems. This factor is an impediment to stand-alone manufacturing or distribution network implementations, as well as integrated manufacturing/distribution initiatives. There are often significant “organizational” barriers to the development of “integrated” optimization initiatives. Particularly in large firms, one frequently observes that the manufacturing and distribution organizations operate quite autonomously and each focus heavily on their own operating efficiencies. Even in firms with strong manufacturing/distribution linkages, one often still does not find the very high level of integration required to facilitate model (1). Specifically, for a firm to employ this model as a standard tactical planning process, its manufacturing and distribution functions must both adopt a holistic vision for their supply chain. This means each organization must be willing to sacrifice (or sub-optimize) its own operating efficiency, if by doing so this will enhance the overall efficiency of the firm’s supply chain. For example, manufacturing must be willing to accept higher operating costs, if by doing so, it will facilitate distribution savings that will outweigh the incremental increased manufacturing costs. Similarly in the reverse situation distribution must also agree to accept higher incremental costs for the overall good of the firm. In many firms, senior functional leadership will not accept an approach which may lead to a denigration of its own operating efficiency. In large multi-national or global firms, tax laws and benefits can heavily influence where a firm locates its plants and the firm’s activity levels at different plants. In some firms this influence is so great that senior managers perceive that no need exists for an integrated planning methodology such as model (1). Instead managers believe that manufacturing location and production levels should be based primarily upon the analysis of the tax department. In such an environment it is extremely hard to implement model (1) - even using a version of this model that includes tax and transfer pricing (see [10]).
Model (2) labeled “Family Weekly Production Scheduling Model” represents an opportunity to employ optimization to evaluate the trade-offs between production costs, changeover costs and inventory carrying costs while developing a product family production plan for a plant. This model can serve
Title Suppressed Due to Excessive Length
201
both a tactical and an operational role in a firm’s hierarchical planning and scheduling process. At the tactical (annual) level, model (2) can determine whether the production plans developed for a plant by model (1) remain feasible when evaluated in more detail. Examples of the greater level of detail typically found in model (2) compared to model (1) include evaluating production plans in weekly time buckets rather than in quarterly or annual buckets, and evaluating the impact of weekly changeovers on the feasibility of the annual production plan. Thus, at the tactical level, model (2) plays a critical role for each individual plant in validating whether a plant can operationally execute the schedule assigned to the plant by the centralized planning activity that model (1) supports. The feedback loop in Figure 2 from the output of model (2) back to model (1) represents the communication loop which must occur should model (2) identify that model (1) has assigned an infeasible annual plan to an individual plant. (See Appendix B for further discussion of this feedback loop.) At the operational level, model (2) functions as a weekly product family production scheduling model for each individual plant in a network. This model generates a production plan by week, by product family, by production line for a plant over a rolling planning horizon that typically spans 12 to 18 months. The reader is referred to [7] for a more detailed review of this model. In contrast to model (1), optimization models are more commonly utilized by firms at this point in the supply chain planning process (i.e., at the model (2) level). Nevertheless, when one considers the superior insights that optimization can provide for plant scheduling activities, the level of utilization across industries remains fairly low. Several reasons explain both the higher level of optimization utilization for model (2) vs. model (1); and the “relatively low” use of this methodology to support plant product family scheduling. These include the following: •
Model (2) has a relatively narrow functional role that does not span multiple functional areas within a firm. The manufacturing organization will utilize model (2) to schedule its plants. Thus, a manager who desires to employ optimization to schedule a plant does not typically have to obtain alignment across as broad a spectrum of organizational fiefdoms as would be necessary for model (1). • In the most extreme isolated case, an individual manager or group of managers at one plant in a firm’s network could choose to utilize model (2) just for their plant.2 This could occur based upon just the knowledge or interest of a single influential manager. • The increased availability of commercial software over the last ten to fifteen years which can perform plant scheduling problems at the line level with changeovers (see [7]) has further enhanced the probability that a firm will use optimization for model (2). 2
The author has observed such cases in practice.
202
•
Miller
A significant limiting factor, however, remains the hesitancy of managers and functional organizations to employ what are perceived as “black box” solutions and algorithms. Many managers and firms persist in their comfort level with simple spreadsheet scheduling tools that planners can easily understand and manipulate. One cannot underestimate the power that a firm’s comfort level with alternative methodologies exerts on the selection of a decision support tool.
Model (3) labelled “End Item Weekly Production Scheduling Model” represents a potentially similar opportunity to that of model (2) to employ an optimization based methodology. This model establishes a production plan by week, by end item, by production line for a plant over a rolling planning horizon that typically extends from several months to as many as 18 months into the future. The complexity of the cost and capacity trade-offs in this activity determines the potential benefit of using optimization at this point in the plant scheduling process. For example, in the case of a ceramic tile manufacturer, the changeover from one end item to another within a particular product family required only a fifteen-minute wash-up during a scheduled break for the workforce (see [5]). The significant capacity and changeover decisions occurred at the product family level for this manufacturer. Thus, while an optimization model could assist the firm at the model (3) level, similarly a well-designed spreadsheet model could also effectively translate the product family schedules generated by model (2) into an end item production schedule. In contrast, for many firms and industries, changeover and capacity utilization alternatives at the end item level represent major decisions where the planner must evaluate critical choices. Production schedules for end items in the pharmaceutical industry represent such an example. The physical and/or regulatory requirements of a changeover often do not facilitate a rapid changeover over an employee work break. In such an environment, the potential contribution of an optimization methodology increases significantly. The competing factors that facilitate and impede the use of optimization for model (3) are quite similar to those that influence model (2). Both models have applicability in a stand-alone plant environment with the primary difference between the two models being the level of product aggregation each respectively addresses. Model (4) labeled “Transportation Planning And Scheduling” represents an activity where private industry has employed optimization methods quite heavily. In fact, one would be hard pressed to identify a general category of planning and scheduling activities where the use of optimization is more prevalent. A number of factors have contributed to this relatively high utilization rate include the following. • •
Commercial user-friendly software for transportation scheduling has been widely available since the 1980’s, and on a more limited basis even earlier. Further, commercial vendors effectively designed transportation scheduling software to integrate easily into a firm’s existing supply chain IT sys-
Title Suppressed Due to Excessive Length
203
tems (i.e., a transportation package typically requires more limited systems interfaces and fields of data than other supply chain systems.) • Transportation scheduling has a relatively narrow scope organizationally - it is usually the purview of a transportation group in a firm. This often allows transportation managers relatively more autonomy to employ niche products and methodologies for their function - without having to obtain “political” alignment across a broad spectrum of functions in an organization. • The need for a method (i.e., optimization) that can mathematically determine how to schedule shipments is often more intuitively understood by non-technical managers than some other scheduling requirements for a firm. For example, this author’s observation is that managers often have a difficult time comprehending how a mathematical tool “tradesoff” changeover costs vs. variable production costs vs. inventory carrying costs in a production scheduling model - all while satisfying capacity constraints. In contrast, the concept that a mathematical tool can create a delivery schedule that consolidates orders/shipments with similar delivery dates and destinations is more easily understood. This “ease of understanding” facilitates a greater willingness and comfort level on the part of non-technical managers to entrust the transportation scheduling activity to a mathematical optimization tool. • In summary, the relatively narrow organizational domain of transportation scheduling, the relative simplicity of the activity, and the bountiful availability of good commercial user-friendly software have collectively contributed to a higher utilization of optimization in this functional area compared to other supply chain scheduling activities. Model (5) displayed as “Warehouse Planning And Scheduling” in Figure 2 represents another activity area that could benefit from increased utilization of optimization (and simulation). In fact, simulation perhaps even more than optimization has the potential to provide far greater contributions to warehouse operations in private industry. Although one can find occasional examples of a firm utilizing simulation or optimization to plan warehouse operations, the instances remain few and far between. Again, a number of factors have impeded the uptake of simulation or optimization for warehouse planning and scheduling including the following: •
Firms operating warehouses, and even warehouse operations consulting firms in general have a strong confidence level in utilizing spreadsheet based engineering models to design and operate warehouses. These spreadsheet models, fortified with good engineering rates on projected warehouse productivity measures, can provide good insights into warehouse size, labor and material handling equipment requirements (see e.g., [2]). The capability of spreadsheet models to evaluate effectively warehouse operations requirements, and to predict the potential capacity limitations and bottlenecks of “sequential” warehouse operations has made these models very
204
•
Miller
popular in practice. At the same time, this has reduced the need or drive of industry practitioners to invest more heavily in sophisticated techniques such as simulation. Further, the previously cited general comfort level that exists with easily understood spreadsheet models, also dampens the use of simulation or optimization in warehouse operations, as does this factor in other functional areas.
The planning activity of warehouse design and layout has benefited the most to date in practice from simulation and optimization models. This typically represents more of a one-time long-run planning activity. Because of the perceived importance of optimizing warehouse operations flow, firms are in some cases more willing to invest the resources required to construct a sophisticated simulation model to assist in layout design. Nevertheless, based on this author’s experience, the number of firms employing true simulation for strategic warehouse design remains a small minority. Further, when utilized, such models generally serve a one-time design planning purpose, but do not become incorporated into a standard business practice. Model (6) noted as “Trailer Yard Management” in Figure 2 is closely associated with model (5) Warehouse Planning And Scheduling. In fact, commercial warehouse management systems (WMS) often include trailer yard management as a sub-module within the overall WMS. We identify trailer yard management separately and explicitly because it represents a very important functional component of a firm’s distribution network. However, because this scheduling area is often considered a sub-function of warehouse operations, it sometimes does not receive the attention it requires. An efficiently scheduled trailer yard can make the difference between a warehouse operation that successfully meets customer fulfillment requirements, and an operation that experiences service failures. Opportunities for the use of optimization in general are not as prevalent for warehouse trailer yard management as for the previous supply chain functions discussed (i.e., models 1 through 5). For extremely large warehouses trailer yards, sequencing issues can exist that optimization can better address than alternative methods. Certainly for large container rail yards optimization techniques can offer significant benefits. However, even for relatively large manufacturing and distribution warehouses (e.g., facilities of one million square feet or more), schedulers can usually generate effective unloading sequences using simple inventory prioritization logic in a database/spreadsheet application. Nevertheless, because selected opportunities do exist for optimization approaches to warehouse yard management, and because of the often overlooked importance of this activity, we have included this functional area in this discussion.
Title Suppressed Due to Excessive Length
205
3 An Approach To Promote The Use Of Optimization And Related DSS Methods In Supply Chain Operations Based upon implementations in a number of industries including pharmaceutical, consumer healthcare and ceramic tile among others; the author has employed a specific strategy to promote the use of optimization, simulation and related DSS techniques within a firm’s operations. This section reviews this strategy. Additionally, the reader is referred to [2]; [5]; and [4] for detailed examples of DSS implementations based upon this approach. The following steps outline this strategy from the perspective of a manager seeking to develop and implement effective DSS tools such as optimization for his or her operation. 1. Evaluate your operation from the hierarchical, multiple planning period perspective previously described. 2. Select the planning activity or function within one’s overall operation that can benefit most immediately from the introduction of an optimization (or simulation) based DSS. The factors that dictate this decision will vary by firm. Briefly, however, decision factors would naturally include: what facet of one’s operation has the greatest need for enhanced DSS support, what project has the greatest likelihood of success, what project has the highest probability of stimulating further DSS enhancements and so on. 3. Staff the project with a colleague or colleagues who are employees of the firm, and ideally who are already established within the operation where the implementation will occur. (I.e., Do not rely solely on third party consultants to develop the DSS for your operation.) 4. Utilize consultants to assist on the project only if necessary (e.g., if the skill sets and/or resources are not fully available internally). However, an internal employee must lead the project. Additionally, there must be one or more internal employees with the skill sets and knowledge to develop, implement and effectively utilize optimization and/or simulation. If there are internal resources who have the skill sets to utilize the applications, this will ensure continuity once the firm implements the planning methodology. 5. Establish the use of this DSS tool as a standard business practice, once the initial DSS application is developed. The frequency with which the firm’s operation will utilize the DSS tool will naturally vary depending upon the application. However, the critical point is that the role of this DSS tool in the operation’s planning and scheduling activities be well defined. 6. Utilize the initial DSS applications to create a foundation from which to build and append additional related DSS planning tools and methodologies for the organization. The strategy outlined in steps 1 through 6 sketches some basic high-level steps that have led to the successful implementations of DSS applications. Clearly there exist many more detailed steps necessary to facilitate a successful
206
Miller
project and the reader is referred again to the citations at the beginning of this section for more detailed descriptions. These six steps, however, provide a general overview of the recommended approach. In particular, once the DSS application has been developed and the initial implementation occurs, steps 5 and 6 assume critical importance. The manager(s) responsible for the DSS must ensure that the tool becomes an integral, standard component of the planning activity the DSS supports. Thus, the key question becomes how to assure this progression? Steps 3 and 4 provide guidance to this question. Step 3 describes that one must select employees to manage the project who have existing roles and responsibilities within the firm. By having one or more key internal employees lead the development and implementation of the DSS project, this assures that there will be an in-house “advocate or champion” of the DSS on an ongoing basis. For this reason, if the sponsoring manager of the project can appoint two or more employees to major roles in the DSS project, this further enhances the ongoing support and advocacy for the system. Additionally, employees who hold key or central positions in the operation where the DSS will be implemented represent the best candidates to lead the DSS project - again because this will facilitate a very strong ongoing advocacy for the system. Similarly, should a sponsoring manager find it necessary to employ consultants to staff significant portions of the DSS project, it becomes important that the sponsor have a good exit strategy for the consultant(s). Specifically, an effective transition process must take place whereby internal employees must quickly assume ongoing operational responsibility for any portions of the system developed by the consultant(s). If this “hand-off” does not occur quickly, the probability significantly increases that the DSS will not become ingrained into the firm’s operation. Instead the new system risks ending up unused “on the shelf” because it lacks ongoing supporters within the firm’s operations. With the appropriate advocacy established in steps 3 and 4, we return to steps 5 and 6. As noted, in step 5 the sponsoring manager must establish the use of the DSS tool as a standard business practice. Depending upon the level in the hierarchical planning framework (Figure 1) that the DSS supports, the operation may employ the tool as frequently as daily, or as infrequently as quarterly to annually. Regardless of the appropriate frequency, the sponsoring manager and project advocates (i.e., the key employees who led the development project) must take the necessary steps to facilitate the DSS integration. This may represent a very simple or significant undertaking depending on the situation. If the project “advocates” plan to utilize the DSS in their own planning activities and area of responsibility, integrating the DSS as a standard business practice requires simply that these managers execute an implementation plan. Once implemented, the DSS becomes a core or standard business practice. However, if the sponsoring manager and DSS advocates must influence others to utilize the DSS to support planning activities that are either not their (the advocates’) direct responsibility or are relatively remote
Title Suppressed Due to Excessive Length
207
(e.g., in distant plants); step 5 becomes far more difficult. For this reason, we highly recommend that in the initial DSS project selection process, the sponsoring manager choose an application that will support his or her area of responsibility directly. Further, we recommend that the manager select a DSS project that will support an operation or planning activity with which the manager has regular and direct contact. This will again facilitate a successful integration of the DSS as a standard business practice. We consider now step 6 where the initial DSS implementation project becomes the foundation tool that stimulates the growth of an expanded system over time. Based on the implementations previously cited in this article, as well as other successful implementations, the author has observed a consistent pattern. Namely, a successful DSS implementation will “eventually” support several activities or operations in addition to the initial application. Several factors contribute to this. An optimization project or similar large scale DSS effort requires numerous data inputs. These data inputs can often support secondary DSS applications not originally envisioned when the initial system was planned. For example, the developers of the DSS reported in [2] originally constructed this system to provide general support for DC operations and customer logistics scorecards. However, when the operation that this DSS supported suddenly had significant storage capacity issues in the early to mid 2000s; the developers rapidly created another DSS to provide daily inventory deployment guidance for the over capacitated network (see [8]. In developing this DSS, the in-house team that developed the second DSS relied heavily upon the data sets and existing data interfaces that supported the initial DSS. In some cases, the team simply augmented an existing interface from the firm’s ERP to the existing DSS with additional data fields. These additional fields appended to the existing interface facilitated the rapid development of algorithms that formed the basis of a daily inventory deployment DSS. In this example, the fact that the firm already had one successful DSS in place - a “foundation” - paved the way for the rapid implementation of a second DSS. A similar evolution occurred at a firm described in [4] and [9]. In this case, a firm developed and implemented a mathematical optimization model that generated integrated tactical manufacturing and distribution plans (i.e., model (1) in Figure 2). This DSS model quickly became a key component of the firm’s standard tactical planning business process. This optimization model became the “foundation” tool that then spawned the development of several related DSS implementations at this firm over the next several years. In this case, the original optimization model generated very significant savings, as well as customer service level improvements for the firm. The success of this initial implementation created great interest at the firm in further improving the quality of key data inputs to this model. In particular, the firm next developed a new tactical forecasting system to provide product family demand projections to the integrated manufacturing and distribution model (see [9]). This integrated top down/bottom up forecasting system replaced a
208
Miller
previous manual, anecdotal and judgment based forecasting approach, and it dramatically improved the firm’s forecast accuracy. Next, as the firm scrutinized its new optimization based manufacturing and distribution planning system, it realized that it needed to improve the start of period inventory data inputs to its planning process. Specifically, the firm discerned that its aggregated inventory inputs to the production planning process were leading to production schedules that created poor customer service line item fill rates. Briefly, the aggregated inventory inputs did not properly recognize serious inventory imbalances that could exist at the end item and product family level. To correct this problem, the firm developed a DSS that evaluated its inventory simultaneously at multiple levels (i.e., at the end item and product family levels). This DSS application became a pre-processing step that the firm utilized to develop its inventory inputs to the tactical production planning process (see [6] for additional details). The examples cited in this section illustrate how an initial DSS implementation stimulates over time the development of additional DSS applications. As noted a well-implemented DSS typically provides secondary and tertiary benefits and decision support for additional problems beyond those which the developers of such systems explicitly designed the original application. Additionally, once an initial optimization model or similar DSS provides significant contributions to a firm, this usually spawns further interest and inquiries from other managers in an organization. Specifically, managers who observe a DSS system improving the effectiveness of decision-making in a periphery function to their own become interested in utilizing similar methodologies to support their own areas of functional responsibility. This can lead to either new DSS projects or the expansion of existing DSS implementations. In either case, a key point remains that the original DSS project creates a foundation from which to build other applications to benefit a firm. This further illustrates the importance for a manager of carefully identifying and implementing an initial DSS project. 3.1 Lessons Learned And Final Thoughts The hierarchical planning framework reviewed at the outset of this paper provides a unifying perspective with which to view existing and potential DSS applications in a firm. An organization with strong capabilities will have DSS systems to support planning activities at the strategic, tactical and operational levels (i.e., support for all planning horizons). For the manager or firm seeking to enhance internal DSS capabilities, a review of the firm’s current decision support systems across all planning horizons represents a good starting point. This review will serve to help identify those planning activities that could benefit the most from additional support. Once the sponsoring manager has selected a DSS application for development and implementation, it is critical to keep in mind that optimization and similar operation research techniques remain unknown, “black box” methods
Title Suppressed Due to Excessive Length
209
for many firms and managers. Thus, the success of a DSS application may hinge upon whether the sponsoring manager can install one or more internal project leads who have both strong operational knowledge and a good comfort level with technical operations research type methodologies. Finally, once the DSS application is developed and implemented, the sponsoring manager must quickly incorporate this new capability into the firm’s standard business planning process. In summary, there is no one “right way” to implement optimization and other DSS techniques into a firm’s core planning processes. However, the approaches outlined in this paper have facilitated a number of successful implementations in different firms and industries. It is hoped that the approaches described herein may offer some useful insights for other potential applications.
A Brief Review of Key Components of the Integrated Production And Distribution Planning System Depicted in Figure 2 A.1 Annual Forecasts By Sales Region By Product Line •
A high level forecast (e.g. at a division or major product line) typically initiates the tactical planning process. The “Sales Region” would be a very large region such as a country in a global planning model.
A.2 Annual Forecasts By Sales Region By Product Family •
•
A manufacturing and distribution optimization model generally requires forecasts at the product family level (i.e. at a more disaggregated level than the initial high level forecast.) A product family is defined as a group of individual end items that have similar manufacturing and distribution characteristics (e.g. items that can be produced on the same production lines at the same plants, and at similar costs and rates). Additionally, the sales or geographic regions in this product family forecast should be more disaggregated than in the initial high level forecast. For example in a U.S. domestic model, the sales regions defined in the optimization model may consist of one hundred to several hundred metropolitan areas and surrounding areas. In contrast the initial high level forecast may be a total U.S. forecast by product line.
A.3 Plant/DC/Family Model •
This optimization model generally includes the following components: 1. All plants and other major finished goods supply points (e.g., contract manufacturers).
210
•
Miller
2. All major finished goods production lines at all plants 3. Definitions (and explicit modeling) of all major product families produced at plants/supply points. This includes variables and constraints in the model that define the rate and cost of production of each product family on each production line. 4. The freight cost to transport each product family from its supply point origin(s) to the sales regions defined in the model where there exists demand for the product family. Note that this also includes the freight costs to transport product families across intermediate origindestination pairs between the original supply point and final point of demand. 5. The cost and capacity constraints (or throughput rates) associated with product families moving through intermediate facilities between the original product family supply point(s) and the final demand point(s). A distribution center (DC) is the most typical example of an intermediate facility. 6. A demand forecast for each product family at each defined sales region (final demand point) in the optimization model. The Plant/DC/Family Model often contains many more components such as inventory carrying costs, duty and customs costs, etc. The reader interested in a more comprehensive review is referred to [4] and [7]. Note also that this type of model frequently contains a mix of fixed and variable costs. Thus, model design decisions typically include an evaluation of whether to utilize a mixed integer or linear programming approach.
A.4 Annual Production Plan By Plant, By Family And Sourcing Plan •
An integrated network-wide production and distribution plan produced by the Plant/DC/Family optimization model.
A.5 Operational Forecasting System •
A system that generates demand forecasts for all stock-keeping units (skus). A sku is defined as an individual finished good end item that is stored at a defined geographic location (e.g., a DC or retail store) to satisfy customer orders (i.e., meet demand).
A.6 DRP/Inventory Management System •
A system that projects inventory requirements at finished goods inventory stocking locations (e.g., DCs). This system utilizes sku forecasts, sku service level targets, and current sku inventory levels at a stocking location to project net inventory requirements by sku.
Title Suppressed Due to Excessive Length
211
A.7 Weekly Product Family Net Requirements By Plant • A projection of the net inventory and production requirements for each product family that a plant produces. The product family net requirements are developed by aggregating the net requirements of each individual end item within a product family. A.8 Family Weekly Production Scheduling Model By Plant, By Family •
See description of model (2) in text
A.9 Master Production Schedule By Plant, By Family •
The planned production schedule and related information (e.g., total demand) generated by the weekly production-scheduling model for each product family that a plant produces. (See APICS dictionary for additional descriptions[1].)
A.10 End Item Weekly Production Scheduling Model •
See description of model (3) in text
A.11 Master Production Schedule By Plant, By End Item •
The “planned” production schedule and related information generated by the weekly production-scheduling model for each end item that a plant produces.
A.12 Order Management; Transportation Planning And Scheduling; Warehouse Planning And Scheduling; and Trailer Yard Management •
For a comprehensive review of order, transportation, warehouse and trailer yard processes and management, the reader is referred to [11].
B Illustration Of A Feedback Loop From The Operational Level To The Tactical Level Feedback loops from the operational level to the tactical level and from the tactical level to the strategic level represent a key and “defining attribute” of any hierarchical supply chain planning system. To provide additional perspective of what a feedback loop is, in this appendix we review an illustrative feedback loop from model (2) to model (1) in Figure 2.
212
Miller
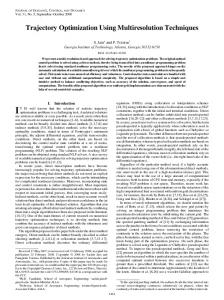
Fig. 3. Illustrative Tactical Production Plan Created By Model (1)
As previously discussed, in the tactical planning process, model (1) generates a 12 to 18 month production plan at the product family level for each plant in a network. The model also creates an integrated distribution plan that identifies which plants supply which DCs, and which DCs serve which customers, again at the product family level. Figure 3 displays a network-wide annual production plan that for illustrative purposes we will assume model (1) has created. This plan displays the weeks of production of each product family that each plant will manufacture over a 12 month planning horizon. (For simplicity the figure primarily shows “dots” rather than all 26 product families and their assignments.) For illustration we now focus on model (1)’s assignment that Plant 1 should produce one week of product family A. We will also assume that product family A has the following attributes: 1. It contains 20 finished good end items, and 2. Each of the 20 end items has a minimum production run length of a 1/2 day (i.e., if the plant has to produce an item, it must produce the item for a minimum of 1/2 of a day). Briefly end items are aggregated into product families for tactical planning based upon their respective similar characteristics. For example, assume that
Title Suppressed Due to Excessive Length
213
Figure 4: Two Scenarios For Product Family A At Plant 1
23 Fig. 4. Two Scenarios For Product Family A At Plant 1
this is a ceramic tile manufacturing network, and that the 20 end items in product family A are different color 2” × 2” wall tile end items (e.g., blue, green, yellow etc.). Each end item can be produced on the same production lines at the same plants, and at very similar costs per unit and at similar output rates. These similar end items would be planned as one product family in model (1) at the tactical planning level. Now let’s consider Figure 4 which depicts two very different scenarios (Case 1 and Case 2) - under which model (1) could generate an initial assignment of one week of production for product family A at plant 1. The total demand for product family A consists of the sum of the demand for the 20 end items that comprise this product family. (For simplicity we will also define production requirements as equal to total demand in this example.) Now consider Case 1 and Case 2 in Figure 4. Case 1 • The total demand (and production requirements) for product family A at Plant 1 is in three end items (1, 2, and 3). • There is no demand for end items 4 through 20 (i.e., demand = 0) • Thus, as Figure 3 depicts, to satisfy the demand for product family A at the plant 1 will require 2 days production of item 1, two days of
214
Miller
•
Case 2 • • • •
item 2 and one day of item 3. No production of items 4 through 20 is required. Therefore, plant 1 can feasibly produce the production assignment from model (1) of one week of family A. (Note that we define five business days as one week in this example.) • The total demand for product family A at plant 1 consists of 1/4 of a day’s production for each of its twenty end items. 20 × 1/4 = 5 business days total demand; or one week of demand (and production) - the assignment of model (1) to plant 1 for family A. Recall however that plant 1 has a minimum production run length of 1/2 day for any item. Therefore, for plant 1 to produce all twenty items in family A will require 20 × 1/2 = 10 business days of production. Thus, the production assignment from model (1) to plant 1 for product family A is not feasible.
B.1 How Can This Infeasible Production Assignment Occur At the network-wide tactical planning level, models and planners generally do not evaluate very detailed issues such as the minimum run length of individual end items and individual plants. The purpose and objectives of 12 to 18 months planning exercises at the tactical level necessitate that planning/modeling be conducted at more aggregated levels (e.g., product families rather than end items). This allows the possibility that plans developed at the tactical level may in some cases be infeasible to implement at the operational level. Case 2 illustrates how these infeasibilities may arise. In practice, “feedback loops” from lower planning and scheduling levels to higher levels take on great importance because of the type of situation illustrated in Case 2. As plans cascade down from one level to the next lower level (e.g., network-wide to individual plant), managers at the lower level must evaluate these plans and communicate back any infeasibilities identified. This becomes an iterative process whereby tactical plans should be revised based on feedback loop communications, and then revised tactical plans are reevaluated at the operational level. This process continues until a feasible plan, at all levels, has been developed. The reader is referred to [7] for additional discussion of feedback loops and hierarchical systems.
References 1. James F. Cox and John H. Blackstone. American Production And Inventory Control Society (APICS) Dictionary. APICS Educational Society for Resource Manage, eleventh edition, 2004. 2. Vijay Gupta, Emmanuel Peters, Tan Miller, and Kelvin Blyden. Implementing a distribution network decision support system at Pfizer/Warner-Lambert. Interfaces, 32(4), 2002.
Title Suppressed Due to Excessive Length
215
3. Arnoldo Hax and Harlan Meal. Hierarchical integration of production planning and scheduling. In M.A. Geisler, editor, TIMS Studies In Management Science, Vol. 1, Logistics. Elsevier, 1975. 4. Matthew Liberatore and Tan Miller. A hierarchical production planning system. Interfaces, 15(4), 1985. 5. Renato De Matta and Tan Miller. A note on the growth of a production planning system: A case study in evolution. Interfaces, 23(4), 1993. 6. Tan Miller. A note on integrating current end item inventory conditions into optimization based long run aggregate production and distribution planning activities. Production and Inventory Management Journal, 32(4), 1991. 7. Tan Miller. Hierarchical Operations And Supply Chain Management. SpringerVerlag Press, second edition, 2002. 8. Tan Miller. An applied logistics decision support system. In INFORMS Annual Meeting, Pittsburg, PA, 2006. 9. Tan Miller and Matthew Liberatore. Seasonal exponential smoothing with damped trends: an application for production planning. International Journal of Forecasting, 9(4):509–515, 1993. 10. Tan Miller and Renato De Matta. A global supply chain profit maximization and transfer pricing model. Journal of Business Logistics, forthcoming, 2008. 11. James R. Stock and Douglas Lambert. Strategic Logistics Management. Irwin/McGraw-Hill, forth edition, 2001.