Illustration 1: Daubechies 45 transform of a click possibly made by /Ziphiidae/ ... As you can see, even with the smallest window allowed by Adobe Audition, a 32.
Notes On Using Wavelets In A Detection Stage
Notes On Using Wavelets In A Detection Stage Mark Fischer, August 2016
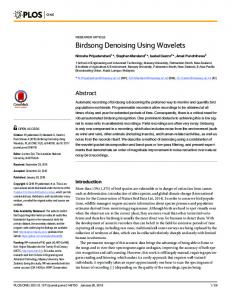
Illustration 1: Daubechies 45 transform of a click possibly made by /Ziphiidae/ recorded October 28th on the MARS hydrophone Shown here is essentially the basis for the method of approaching an architecture for automated detection and classification described below. Wavelet theory was developed precisely for the kinds of signals that happen to be made by the odontocetes – transient sounds, very localized in time. The short-time Fourier transform was developed to get better results with these kinds of signals than a normal Fourier transform would – but has numerous failings. Better to use a form of mathematics developed for these kinds of events in the first place, than to attempt to wrestle a stationary basis { the sine wave } into representing a waveform that is explicitly not stationary.
Notes On Using Wavelets In A Detection Stage
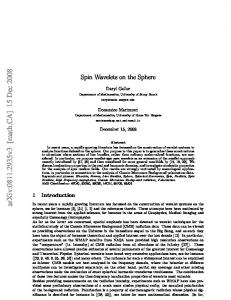
Illustration 2: Example of a possible Ziphiidae click with Low signal-to-noise However, before we get to the classification of a 300µsec click, an educated guess as to the source of the sound detected, we first have to make a detection. While this is not a difficult task with recordings that have high signal-to-noise ratios, these kinds of sounds pose a unique challenge, in that they have a maximum theoretical range of detection of approximately 4 kilometers. Therefore, we are motivated to attempt detections with recordings having a low signal-to-noise ratio, as is the case with the example seen here.
Notes On Using Wavelets In A Detection Stage
Illustration 3: Closeup of example of a possible Ziphiidae click with Low signal-to-noise As you can see, even with the smallest window allowed by Adobe Audition, a 32 sample window, the spectrogram is essentially a blob. There must be a better way, and there is. Let us consider the use of wavelets here.
Notes On Using Wavelets In A Detection Stage
Illustration 4: Amplitude waveform of a click possibly made by Ziphiidae We start with an example of what we are looking for – this is the amplitude waveform as depicted by 4000 samples recorded at 256000 samples per second of a click that could be made by a Beaked whale, as annotated by an experienced acoustic analyst at the Naval Postgraduate School. These clicks are -very- short, on the order of 300 µseconds, in frequency space around 25 to 33 kilohertz. One way of making a detection is to use the Teager energy operator, used quite frequently in many applications.
Notes On Using Wavelets In A Detection Stage
Illustration 5: The Teager energy of amplitude waveform This operator is sensitive, indeed – unfortunately it is sensitive to background noise as well. One of the first adopted uses of wavelets, however, was in the service of denoising a signal. They can function as, essentially, a bandpass filter. So what if we take the mean of the wavelet transform of the input waveform?
Notes On Using Wavelets In A Detection Stage
Illustration 6: Mean value of the wavelet transform of the input waveform We can see this already looks like a noticeable improvement for what is otherwise a pretty weak click.
Notes On Using Wavelets In A Detection Stage
Illustration 7: Teager energy of the mean of the wavelet transform of the input waveform Using the mean of the wavelet transform as the input has made a noticeable improvement in the output of the Teager energy operator.
Notes On Using Wavelets In A Detection Stage
Illustration 8: Plot of Teager energy when thresholded A trivial threshold reveals where to mark the input waveform.
Notes On Using Wavelets In A Detection Stage
Illustration 9: Closeup of the plot of the Teager energy function Here is a closeup at the particular region.
Notes On Using Wavelets In A Detection Stage
Illustration 10: Marking the bounds of the input waveform using the Teager of the mean of the wavelet transform Finally, we return to examine the region that this straightforward process has chosen for a candidate.
Notes On Using Wavelets In A Detection Stage
Illustration 11: Amplitude waveform of selected region So this is what was chosen in the initial recording.
Notes On Using Wavelets In A Detection Stage
Illustration 12: Scalogram of selected portion of input waveform Finally, the scalogram of the selected input waveform, and the basis for subsequent classification.