Journal of Experimental Psychology: Human Perception and Performance 2006, Vol. 32, No. 1, 32– 44
Copyright 2006 by the American Psychological Association 0096-1523/06/$12.00 DOI: 10.1037/0096-1523.32.1.32
Numbers and Space: A Computational Model of the SNARC Effect Wim Gevers and Tom Verguts
Bert Reynvoet
Ghent University
University of Leuven, Campus Kortrijk
Bernie Caessens and Wim Fias Ghent University
The SNARC (spatial numerical associations of response codes) effect reflects the tendency to respond faster with the left hand to relatively small numbers and with the right hand to relatively large numbers (S. Dehaene, S. Bossini, & P. Giraux, 1993). Using computational modeling, the present article aims to provide a framework for conceptualizing the SNARC effect. In line with models of spatial stimulus– response congruency, the authors modeled the SNARC effect as the result of parallel activation of preexisting links between magnitude and spatial representation and short-term links created on the basis of task instructions. This basic dual-route model simulated all characteristics associated with the SNARC effect. In addition, 2 experiments tested and confirmed new predictions derived from the model. Keywords: SNARC effect, dual-route, Simon effect
proposed connectionist model of numerical cognition (Verguts, Fias, & Stevens, 2005). This model was originally proposed to explain and integrate a number of findings in numerical cognition, such as the distance effect and size effect in number comparison and the distance effect in masked priming studies of numerical cognition. The extended version of the model proposed in the present article additionally accounts for a number of SNARCrelated findings and also makes predictions about aspects of the SNARC effect that have not been reported elsewhere. Additionally, the architecture of the present model combines the domainspecific representation of number and space with basic dual-route conceptions. Before presenting the model, we first summarize the most important characteristics of the SNARC effect.
Although numbers and space appear to be very different dimensions, recent evidence has accumulated in support of close connections between these representational domains (e.g., Walsh, 2003). A striking example of this connection is the association between number and space as evidenced from the SNARC (spatial numerical associations of response codes) effect: the finding that relatively small numbers are responded to faster with left-sided responses, and relatively large numbers are responded to faster with right-sided responses (spatial numerical associations of response codes; Dehaene, Bossini, & Giraux, 1993). The most widely used task to investigate the SNARC effect is a parity judgment task (Dehaene et al., 1993). In this task subjects have to indicate the parity status (odd– even) of a number by means of a manual left or right response. On the one hand, there seems to be general consensus that the direction of the association between magnitude and response hand side is the result of the preferred reading and writing direction (Dehaene et al., 1993; Zebian, 2005). On the other hand, specific information regarding how the system incorporates the link between magnitude information and response code is still unresolved. Therefore, the aim of this article is to provide a detailed conceptualization of the SNARC effect and its origin. This is done by implementing the effect in a recently
Characteristics of the SNARC Effect First, the relation between magnitude information and response hand is not restricted to a parity judgment task. The SNARC effect is also present when subjects have to perform a magnitude comparison task (Dehaene, Dupoux, & Mehler, 1990). In this task, where magnitude information is relevant, subjects have to press a left- or a right-hand button if a target number is larger or smaller than a reference number (for instance, 5). As in the parity judgment task, small numbers are responded to faster with the left hand, and large numbers are responded to faster with the right hand. One could argue that while one is performing a parity judgment task, the number is not totally irrelevant to the task. However, the SNARC effect has also been found in a phoneme monitoring task (Fias, Brysbaert, Geypens, & d’Ydewalle, 1996), even when the number is merely printed in the background and totally unrelated to the task at hand (Fias, Lauwereyns, & Lammertyn, 2001). Hence, the SNARC effect can be reliably measured both when magnitude information is relevant (e.g., magnitude comparison) or irrelevant (e.g., parity judgment), supporting the view that the SNARC effect is triggered automatically. Also note that relevance of the magnitude information is not the only differ-
Wim Gevers, Tom Verguts, Bernie Caessens, and Wim Fias, Department of Experimental Psychology, Ghent University, Ghent, Belgium; Bert Reynvoet, Department of Psychology, University of Leuven, Campus Kortrijk, Leuven, the Netherlands. Wim Gevers is supported by Grant D.0353.01 from the Flemish Fund for Scientific Research. Bernie Caessens is supported by Grant P4/05 from the Inter-University Attraction Poles Programme and a grant from the Ghent University Research Fund. Correspondence concerning this article should be addressed to Wim Gevers, Department of Experimental Psychology, Ghent University, Henri Dunantlaan 2, 9000, Ghent, Belgium. E-mail:
[email protected] or
[email protected] 32
33
NUMBERS AND SPACE
ence between parity and magnitude judgment. In parity judgment, the numbers alternate between the left and the right hand (e.g., 1 is left, 2 is right, 3 is left). In the magnitude judgment task, numbers on one side of the interval center are mapped to the left, whereas the other numbers are mapped to the right. Although this difference in spatial grouping can be of importance to the SNARC effect, no direct comparison between both groupings has so far been conducted. Second, evidence has now accumulated that the conflict between magnitude information and response hand is resolved at the response-selection stage. For instance, Caessens, Hommel, Reynvoet, and Van Der Goten (2004) found cross-talk between the overlapping preparation of a lateralized manual and a verbal numerical response. Specifically, Caessens et al. (2004) asked participants to perform two speeded choice tasks in close temporal succession. In task one (T1) participants responded to the letters X or O (Experiment 3) with either the left or right hand. Shortly after the letter appeared, it was replaced by a colored rectangle, which served as a stimulus for task two (T2). Participants had to respond by saying either “one” or “two,” depending on the color of the rectangle. The results showed that manual key-presses for T1 were faster when they were to be followed by their SNARC compatible T2 number response (“one” following left and “two” following right, respectively). Therefore, the associated spatial code of the T2 numerical response interfered with T1 response selection, supporting a response selection origin of the SNARC effect. Additionally, studies that relate the SNARC effect to the Simon effect further support this hypothesis. The Simon effect is the finding that responses are initiated faster if the relative location of the stimulus and the response correspond, even if the stimulus location is irrelevant to the task (Simon & Rudell, 1967). Several studies, using electrophysiological methods, showed evidence in favor of a response selection origin of the Simon effect (De Jong, Liang, & Lauber, 1994; Valle-Incla`n, 1996; van der Lubbe, Jaskowski, Wauschkuhn, & Verleger, 2001). Electrophysiological measurements of the SNARC effect closely mirror these results and suggest that response selection is of key importance for the SNARC effect (Keus, Jenks, & Schwarz, 2005; Gevers, Ratinckx, De Baene, & Fias, in press). Finally, with behavioral paradigms, it has been shown that the Simon and SNARC effects statistically interact (Keus & Schwarz, 2005; Gevers, Caessens, & Fias, 2005), a finding that can be explained in terms of temporal overlap (Hommel, 1993, 1994) between the spatial information triggered by the magnitude information and by the spatial location of the stimulus. Together, these results support the notion that the conflict between spatial codes in the SNARC effect is resolved at response selection stages. A third characteristic of importance is the temporal distribution of the SNARC effect. It is a well-known observation that the effects of most experimental factors increase as response speed decreases (Luce, 1986). This observation has been confirmed by previous studies investigating the time course of the SNARC effect with distribution analyses (Gevers et al., in press; Mapelli, Rusconi, & Umilta`, 2003). This is an important observation because it distinguishes the SNARC from the basic Simon task, in which a decreasing Simon effect as a function of response time is observed (Hommel, 1993). A final characteristic of the SNARC effect is that the association between side of space and magnitude is relative rather than abso-
lute. For instance, in a parity judgment task with numbers ranging from 1 to 5, the numbers 4 and 5 will be responded to faster with the right hand. However, when the numbers range from 4 to 9, the numbers 4 and 5 are responded to faster with left hand side (Dehaene et al., 1993, Experiment 3; Fias et al., 1996). In sum, any model of the SNARC effect must be able to account for the fact that the SNARC effect is triggered automatically and is located at response-selection stages rather than at perceptual or at late motor execution stages, and it must account for the fact that the SNARC effect increases with passing of time and is relative to the size of the interval used.
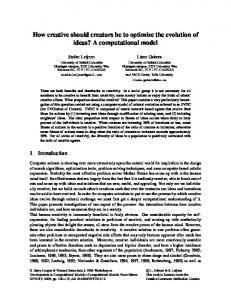
A Model of the SNARC Effect Most conflict tasks, like the Simon task, are explained in terms of a dual-route architecture (e.g., De Jong et al., 1994; Kornblum, Hasbroucq, & Osman, 1990). For the Simon task, this means that both the irrelevant (e.g., location of the stimulus) and the relevant information (e.g., color of the stimulus) are processed in parallel along independent pathways. More specifically, these models consist of a relatively fast unconditional route that automatically codes for the location of the stimulus and a relatively slow conditional route that is dependent on the task instruction and provides the mapping of the relevant attribute to the required response. If both routes converge on the same spatial response code (compatible condition), a response can be initiated relatively fast. If, on the contrary, both routes converge on opposing response codes (incompatible condition), reaction times are slower, and errors are more frequent. Given the above evidence suggesting that the SNARC effect derives from the same mechanism as the Simon effect, our model of the SNARC effect (shown in Figure 1) follows a similar logic.
Overview of the Model The model is graphically represented in Figure 1 and described in more detail in the Appendix. The model consists of three layers.
Figure 1. The basic architecture of the model explaining the SNARC effect for a parity judgment task, a magnitude comparison task, and a task where an arbitrary mapping is applied from number to response. R1 ! Response 1; R2 ! Response 2.
34
GEVERS, VERGUTS, REYNVOET, CAESSENS, AND FIAS
The bottom layer represents the mental number line (Dehaene et al., 1990) and consists of two fields, a number field and a standard field. Each field consists of 15 nodes, and each node within a field codes for one number (numbers 1 to 15 are represented in the current implementation). The number field (Figure 1, bottom layer) is one instantiation of the mental number line and codes the presented target numeral. The function of the standard field is task dependent: In a magnitude comparison task, it codes for the standard to which a number has to be compared (e.g., 5 in the example above). In contrast, in a task in which there is only one relevant number (e.g., parity judgment), the standard field codes for the mean of the range of the presented numerals. Alternatively, we could assume that in the latter type of task, the whole range of relevant numbers (1–9) is uniformly activated in the standard field. This alternative assumption led to very similar simulation results, so for simplicity, we assume in the following that the mean of the presented numerals is activated. The middle layer receives input from each of these two number lines (number field and standard field). According to the model, a number is always coded as either small or large (magnitude field consisting of two nodes), regardless of what task is implemented. In a magnitude comparison task, the magnitude field in the middle layer is the only activated field. Additional fields can be activated on the basis of the task at hand. During a parity judgment task, the parity field (consisting of two nodes, one for odd and one for even) will be activated in parallel with the activation of the magnitude field. If the task requires an arbitrary number-response mapping, this information is coded in the connections between the number field and the arbitrary field. The model as described up to now is the same as that described in Verguts et al. (2005). To account for the SNARC effect, we now added a top layer with spatially defined responses. This response layer consists of two nodes connected with each other through lateral inhibition, one coding for a left response and one coding for a right response. Once a fixed threshold is reached in one of the nodes in the response field, the actual response (depending on which of the two response nodes reached threshold) can be initiated.
Implementation of the Model To test the model directly with respect to the previously defined characteristics of the SNARC effect, the model performed both a magnitude comparison and a parity judgment task. For the magnitude and parity tasks, all weights from the number field to the parity and magnitude fields were taken from the Verguts et al. (2005) study; these weights were obtained from application of a training algorithm. Because the mapping to response hands was not implemented in that study, appropriate parameter values were chosen here. The mapping from the number field to the arbitrary field was not implemented in the Verguts et al. model, so appropriate parameter values were chosen here as well. Upon presentation of a stimulus, all activation values of the network start changing according to their relevant equation (see the Appendix). When the activation value of one of the response units reaches a fixed threshold, the corresponding response is assumed to be chosen by the model. This threshold parameter was set at 0.5. The time taken to reach that threshold is taken as the model’s response time (RT).
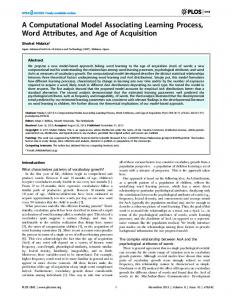
Results To capture the essence of the SNARC effect in detail, we computed the SNARC effect using a regression analysis method adopted from Fias et al. (1996; see also Lorch & Myers, 1990). This method consists of computing the dRT (RT right hand minus RT left hand) for each number separately. Because of the characteristics of the SNARC effect (faster left hand responses for small numbers and faster right hand responses for large numbers), more negative dRT values are expected with increasing magnitude. With this method, the model implementation shows a SNARC effect as revealed by a negative slope both in the parity judgment task and in the magnitude comparison task (see Figures 2A and 2B). Our second aim was to see how the SNARC effect develops over time. To that end, four different processing speeds over trials were introduced in the model, going from fast to slow (see the Appendix). From Figure 3, it is clear that the SNARC effect increases with time: The slopes become larger with slower conditions.
Figure 2. The SNARC (spatial numerical associations of response codes) effect generated by the model. The observed data and regression line represent response time differences (dRT) between right-handed minus left-handed responses as a function of magnitude in a parity judgment task (A) and a magnitude comparison task (B).
NUMBERS AND SPACE
35
Figure 3. The SNARC (spatial numerical associations of response codes) effect generated by the model as a function of response speed. The observed data and regression line represent response time differences (dRT) between right-handed minus left-handed responses as a function of magnitude in a parity judgment task (A) and a magnitude comparison task (B).
A remarkable result is the fact that shape of the SNARC effect seems to be different in the magnitude comparison and the parity judgment task. Comparison of the shapes of the relationship between number magnitude and model-generated dRT reveals that the relationship is continuous in the parity judgment task but categorical in the magnitude comparison task (compare Figure 2A vs. 2B and Figure 3A vs. 3B).
Discussion How the SNARC effect is obtained from the model with both parity judgment and the magnitude comparison task can be summarized as follows.
Magnitude Comparison Task First, consider what happens when the model has to process a magnitude comparison task. The number field codes for the specific presented numeral, whereas the standard field codes for the standard (e.g., 5 if the task is to classify numerals as either smaller or larger than 5). On the basis of this information, the magnitude field (see Figure 1, middle layer) automatically codes the presented number as either small or large (“smaller” or “larger” nodes). If the target number is larger than the standard, the node “larger” becomes more active than the node “smaller” in the magnitude field; if the target number is smaller than the standard, the node
36
GEVERS, VERGUTS, REYNVOET, CAESSENS, AND FIAS
“smaller” becomes more active than the node “larger.” These activation values are projected to the response field (left hand/right hand). Finally, the node “smaller” projects to the response node “left” and the node “larger” projects to response node “right.” However, there is a second route needed from the magnitude field to the response field. Indeed, the process just described constitutes the automatic route and is triggered in any numerical task. However, input to the response layer does not come from the automatic route alone. Additional activation comes from the controlled route, which is activated intentionally by the subject via the task instructions (the task-related route). Because magnitude information is relevant during the magnitude comparison task, this task-related activation will also depart from the magnitude field (see Figure 1, middle layer). The difference is that the task-related route may specify a mapping different from the automatic path (“smaller” 3 “right”). It follows that more time will be needed to reach the response threshold if the task-related and the automatic route activate a different response hand.
Parity Judgment Task Now consider the parity judgment task, in which magnitude information is irrelevant. Similar to the magnitude comparison task, magnitude information would still be automatically activated through the magnitude field up to the level of response activation (automatic route). However, task-related activation now follows a different path. Instead of passing the magnitude field, this activation is now sent through the parity field, which specifically codes for the task instruction. For example, the number 1 is connected to the response “odd” in the parity field, number 2 with the response “even,” and so on. On the basis of the task instruction, the associated activation is then sent to the response layer. For example, if the task instruction is to press left for an odd number, the nodes “odd” and “even” in the parity field will be associated with nodes “left” and “right” in the response field, respectively. Besides this overall SNARC effect, the model also conformed to the predefined characteristics of the SNARC effect at a more detailed level. The model is able to explain the automatic nature of the SNARC effect. Both when the number is relevant or irrelevant, the model correctly predicted a SNARC effect. This is so because the magnitude field is always triggered, regardless of the task. With respect to the response-based nature of the SNARC effect, note in Figure 1 that all mappings responsible for the SNARC effect depart after the number has been semantically activated (full arrows from middle layer to response layer). Therefore, the model respects the response-based origin of the effect. Third, this architecture also accounts for the relative status of the SNARC effect. This is true because the standard field always codes for the middle of the range of relevant numbers. For instance, if numbers are presented in the range from 1 to 9, 5 will be activated in the standard field, and the number 4 will be categorized as relatively small. If, on the other hand, numbers in the range from 1 to 5 are presented, the standard field will activate the number 3. As a result, the number 4 will be considered as relatively large. Why the model results in a SNARC effect that increases with time is depicted in Figure 4. Weak activations need more time to reach the response threshold (see Figure 4A). It follows from the model’s conceptualization that there exists a nonlinear relation between the time needed for (at least) one of the response nodes to
Figure 4. Architecture resulting in a SNARC (spatial numerical associations of response codes) effect that increases with time. A: Demonstrates that weak activations (A1–A4) require more time to reach the threshold because of the nonlinear relation between the time needed to reach a threshold and the input to the response node. B: Illustrates four different strengths of input in relation to the SNARC compatible and the SNARC incompatible condition.
reach a threshold value (ordinate) and amount of input to this response node (abscissa). In Figure 4B, A1–A4 denote four levels of input strength. A1 and A2 denote strong activation, whereas A3 and A4 denote weak activation. Further, for strong activation, A1 denotes the SNARC compatible condition (strongest input) and A2 denotes the SNARC incompatible condition (relatively weaker input). An analogous argument holds for A3 and A4. The increasing strength of the SNARC effect was implemented by manipulating the strength of the input at the standard and magnitude fields (see the Appendix for details). A compatibility effect is calculated as the time difference between the SNARC-compatible and the SNARC-incompatible condition. As a result of the nonlinear relation between time and input, compatibility effects will be larger the weaker the input activation. Indeed, the smaller the amount of input, the larger the difference in time between SNARC-compatible (A1, A3) and SNARCincompatible conditions (A2, A4). Remarkably, from the model, we also observed that the SNARC effect was distributed continuously in the parity judgment task, and a categorical shape emerged in the magnitude comparison task (see Figure 2A vs. 2b and Figure 3A vs. 3B). So far, the shape of the SNARC effect has not been given any attention in the literature, let alone that shapes were compared between tasks. A look at published studies implementing a magnitude comparison task in the context of a SNARC effect revealed a highly similar categorical shape (Ba¨chtold, Baumu¨ller, & Brugger, 1998). Regarding the parity judgment task, visual inspection of data obtained in earlier studies reveal a continuous shape (Dehaene et al., 1993; Fias,
NUMBERS AND SPACE
2001; Fias et al., 1996). Because, so far, no study directly investigated this difference in the shape of the SNARC effect for parity judgment and magnitude comparison tasks, and because we didn’t want to rely on post hoc observations based on visual inspection, we decided to empirically test the model’s prediction.
Experiment 1: Parity Judgment and Magnitude Comparison Participants performed both a magnitude comparison and a parity judgment task. Because magnitude information is relevant during the magnitude comparison task but irrelevant during the parity judgment task, it is possible to see whether the SNARC effect differs between these conditions. More specifically, it is shown that the SNARC effect differs in shape but not in time distribution between the two tasks.
Method Participants Forty subjects participated in the experiment. Fourteen volunteers were members of the department. The remaining 26 were undergraduate students of Ghent University who participated in the experiment for course credit. Six participants were left-handed. All subjects (average age 24.4 years) had normal or corrected-to-normal vision. None of the subjects were familiar with the purpose of the study.
Stimuli and Procedure Stimulus delivery and millisecond accurate response registration was achieved by means of the ERTS software package (Beringer, 1995) on a Pentium-Class PC running MS-DOS. Response times (RTs) were measured to the nearest millisecond. Stimuli were the Arabic numbers in the range from 1 to 9 with the exception of 5. Target numbers were viewed from a distance of approximately 60 cm and subtended 0.86° and 0.40° in the horizontal and vertical plane, respectively. Each target number was preceded by a fixation mark (#) in the center of the screen during 500 ms and was then replaced by the target number. This target remained on the screen until response or 3,000 ms elapsed. After an intertrial interval of 1,000 ms, a new trial was initiated. All participants performed both the magnitude comparison and the parity judgment task. For each task, each participant completed two blocks. In the parity judgment task, even numbers had to be responded to with the right hand button, and odd numbers, with the left hand button. In the subsequent block, this response assignment was reversed. Similarly, during magnitude comparison, subjects had to respond with the left hand to small numbers (1– 4) and with the right hand to large numbers (6 –9). In the subsequent block, this response assignment was reversed. Order of task and blocks were counterbalanced across subjects. Before the experimental session, a practice block was run in which each target number was presented twice. During the experimental session, each block consisted of 20 presentations per target number, leading to a total of 160 trials. Between blocks, subjects were allowed to take a break.
Results Only correct trials with RTs longer than 200 ms were used to compute the median RT. Order of the tasks was not significant, and it did not interact with any of the other variables. Therefore, in the remaining analyses this factor was not taken into account.
37
Parity Judgment Task In total, only 4.42% errors were made. Overall median RT for the target numbers in the range from 1 to 9 (except 5) was 449, 443, 444, 433, 450, 447, 436, and 472 ms. Median latencies and errors were entered in a 2 (magnitude: small or large) " 2 (response: left or right) " 4 (distance from 5) analysis of variance (ANOVA). There were no main effects for the error analysis (F # 1.05). There was, however, a significant interaction between magnitude and response. Consistent with the SNARC effect, more errors were made on small numbers responded to with the right hand and on large numbers responded to with the left hand, F(1, 39) ! 9.52, MSE ! 13.61, p # .01. The analysis on RT revealed a main effect of magnitude, F(1, 39) ! 12.48, MSE ! 252, p # .01, showing that small numbers were responded to faster than large numbers. Inspection of median RTs showed that this effect was due exclusively to slower latencies to the number 9. The main effect for response also reached significance, F(1, 39) ! 20.10, MSE ! 189, p # .0001, indicating that subjects responded faster with the right hand than with the left hand. The main effect for distance was significant, F(3, 117) ! 18.50, MSE ! 786, p # .0001. As with the main effect for magnitude, this distance effect was caused by slower response latencies on the number 9 compared with the other numbers, which is the opposite of what would be expected on the basis of the distance effect. Most important, the SNARC effect was also reflected in the RTs, as shown by the interaction between magnitude and response, F(1, 39) ! 7.32, MSE ! 234, p # .05. Similar to the model data, the SNARC effect was expressed in terms of a dRT for each number. Subsequently, these dRT values were entered in a regression analysis with magnitude as predictor per subject. Finally we compared the slope value to zero using a single-sample t test. With this method, the SNARC effect could be captured in the following equation: dRT ! 9.21 $ 4.21(magnitude continuous), with magnitude contributing significantly, t(39) ! $3.32, SD ! 8.01, p # .001, one sided, see Figure 5A. Time course. To obtain a view of the time course, we applied the vincentizing procedure, in which RTs are rank ordered and divided into four equal bins (Ratcliff, 1979). The results of this analysis are shown in Figure 6A and Table 1. The first relevant observation is that the SNARC effect becomes stronger with increasing time. To test this observation statistically, we applied a regression analysis on the slope values with bin as predictor. More specifically, each slope value from each subject (obtained in the previous analysis) was now entered into the regression analysis with bin as predictor (1– 4). If the SNARC effect does increase with time, the regression analysis should show a negative slope with increasing bin, because later bins are associated with more negative (i.e., steeper) slope values. This was indeed the case, dRT ! .20 $ 1.64 (Bin), with t(39) ! $2.96, SD ! 3.5, p # .01. Shape. From Figure 5, it is clear that the SNARC effect has a continuous shape. The observed dRT values gradually decrease from positive (faster left-hand responses) to negative (faster righthand responses) values. We confirmed this continuous shape statistically by comparing the fit of the regression using a categorical predictor (with values 1 and 2 for values smaller or larger than 5, respectively) with the fit of the regression using a continuous predictor (described in the
38
GEVERS, VERGUTS, REYNVOET, CAESSENS, AND FIAS
Figure 5. The SNARC (spatial numerical associations of response codes) effect resulting from empirical data. The observed data and regression line represent response time differences (dRT) between right-handed minus left-handed responses as a function of magnitude in a parity judgment task (A) and a magnitude comparison task (B).
previous paragraph, with values 1– 8 for the target numbers 1–9 except 5). This comparison showed that the fit of the regression with a continuous predictor outperformed the fit of the regression with a categorical predictor (magnitude categorical), Z ! 3.10, n ! 40, p # .001 (Meng, Rosenthal, & Rubin, 1992).
Magnitude Comparison Task Median latencies and errors were entered in a 2 (magnitude: small or large) " 2 (response: left or right) " 4 (distance) ANOVA. In total, subjects made 3.49% errors. An error analysis showed a reliable distance effect, F(3, 117) ! 33.52, p # .0001. More errors were made to the numbers closer to the reference number 5. No other significant results were obtained in the error analysis. Overall median RTs for the numbers in the range from 1 to 9 (except 5) were, respectively, 381, 377, 392, 416, 413, 394, 385, and 389 ms. A 2 (magnitude) " 2 (response) " 4 (distance from reference) ANOVA on median RT showed a highly significant distance effect. Numbers closer to the reference target number 5 were responded to more slowly than were numbers further away from the reference, F(3, 117) ! 67.83, MSE ! 515, p # .0001. Small numbers were responded to more quickly than were large numbers, F(1, 39) ! 5.59, MSE ! 448, p # .05, and right-hand responses were initiated faster than were left-hand responses, F(1, 39) ! 19.37, MSE ! 894, p # .0001. The interaction between distance and magnitude just failed to reach significance, F(3, 117) ! 2.61, MSE ! 424, p # .06, showing that the distance effect was more pronounced with small than with large numbers. We find it important that the SNARC effect was reliably present, as shown by the significant interaction between response and magnitude, F(1, 39) ! 5.20, p # .05 (see Figure 5B). Time course. A regression analysis on each of the four bins obtained by vincentizing the data was performed. We used a categorical predictor because the previous analyses showed that it had a better fit than a continuous predictor. The resulting equations are shown in Table 2 and Figure 6B.
Similar to the parity judgment task, Figure 6B shows that the SNARC effect increases with time. This was confirmed when the bins were submitted to the regression analysis, dRT ! 13.81– 11.75 (bin), with t(39) ! $4.81, SD ! 15.47, p # .0001. Shape. Analogous to the parity judgment task, the dRT was computed using the regression method described above. The SNARC effect was reliably present, as shown by the following regression equation: dRT ! 5.46 $ 3.52 (magnitude continuous). However, as shown in Figure 3B, the shape of the SNARC effect is better captured by a categorical magnitude related predictor: dRT ! 16.05 $ 17.64 (magnitude categorical). A subsequent analysis confirmed that in contrast to the parity judgment task, the shape of the SNARC effect is better fitted by a categorical compared to a continuous predictor (Z ! 2.31, n ! 40, p # .05; Meng et al., 1992).
Discussion Participants performed both a magnitude comparison and a parity judgment task. The empirical data confirmed the data obtained from the model. Both data and model reliably show a SNARC effect in both tasks. That is, regardless of whether magnitude information is relevant (magnitude comparison task) or not (parity judgment task) to the task, relatively small numbers are responded to faster with the left hand, and relatively large numbers are responded to faster with the right hand. Besides this overall SNARC effect, the data also conformed to the model at a more detailed level. First, both the model and the empirical data show that the SNARC effect increases with time. Additionally, both the empirical observations and the model show that the SNARC effect is continuous for the parity judgment task but categorical for the magnitude comparison task. This result replicates previous observations of a categorically distributed SNARC effect in magnitude comparison (e.g., Ba¨chtold et al., 1998). Intuitively, one could argue that the categorical shape of the SNARC effect for a magnitude comparison task is due to the fact
39
NUMBERS AND SPACE
Figure 6. The SNARC (spatial numerical associations of response codes) effect resulting from empirical data as a function of response speed. The observed data and regression line represent response time differences (dRT) between right-handed minus left-handed responses as a function of magnitude in a parity judgment task (A) and a magnitude comparison task (B).
that the specific numerical magnitude is not necessary to the task. Indeed, for magnitude comparison, only a rough categorization as smaller or larger than 5 is required (e.g., Banks, Fujii, & KayraStuart, 1976; Tzelgov, Meyer, & Henik, 1992). In contrast, during a parity judgment task, each number must be coded specifically to retrieve its parity status, leading to a continuous shape. This account is problematic, however, because it predicts a less categorical SNARC effect over time (rather than more categorical as the data show) because of the fact that with passage of time, more fine-grained magnitude information is able to enter the system. To the contrary, according to the model, the specific magnitude of a number is always coded, regardless of which task is implemented.
Table 1 Regression Equations for the SNARC Effect for Each Bin Separately, Together With the Associated t Values in the Parity Judgment Task Time Bin Bin Bin Bin
1 2 3 4
dRT (magnitude)
t
df
SD
p
$2.51 $ 1.70 1.49 $ 2.95 8.99 $ 4.18 24.67 $ 6.74
$1.66 $3.04 $3.27 $3.58
39 39 39 39
6.47 6.14 8.08 11.90
#.06 #.01 #.01 #.001
Note. SNARC ! spatial numerical associations of response codes.
40
GEVERS, VERGUTS, REYNVOET, CAESSENS, AND FIAS
Table 2 Regression Equations for the SNARC Effect for Each Bin Separately, Together With the Associated t Values in the Magnitude Comparison Task
Stimuli and Procedure
Time
dRT (magnitude)
t
df
SD
p
Bin Bin Bin Bin
$12.99 % 1.83 2.24 $ 9.18 22.04 $ 21.80 36.08 $ 33.14
0.31 $1.23 $2.53 $3.90
39 39 39 39
37.19 47.35 54.45 72.41
#.38 #.12 #.01 #.01
1 2 3 4
Note. SNARC ! spatial numerical associations of response codes.
The model assumes that the categorical effect is the result of an interaction between the distance effect and the time course of the SNARC effect. Recall that the SNARC effect becomes stronger with increasing time. Taken together with the fact that the slowest latencies are those numbers closest to the standard (e.g., distance effect), a categorical shape results. More specifically, because of the distance effect, the latencies to the numbers 4 and 6 will be longer than to the numbers 3 and 7. Because the SNARC effect is strongest with the slowest latencies, the number 4 and 6 will be influenced more by the SNARC effect than the numbers 3 and 7. This effect breaks the continuity of the SNARC curve, pushing the dRT value for number 4 up (stronger effect) and pushing the dRt value for number 6 down (stronger effect). As a result, the observed dRT shape becomes categorical rather than continuous.
Experiment 2: Arbitrary Mapping According to the model, the categorical shape of the SNARC effect found in the magnitude comparison task, but not in the parity judgment task, is due to the joint influence of the time course of the SNARC effect and the distance effect. Given this, it follows that the SNARC effect should show a continuous shape whenever the distance effect is absent in the latencies. In this sense, the present behavioral results are in line with the predictions of the model because there is a distance effect in the magnitude comparison task but not in the parity judgment task (see also Dehaene et al., 1993; Fias, 2001; Fias et al., 1996). However, one could also argue that this continuous shape is the result of some specific aspect of the mapping rule involved in the parity judgment task, where responses alternate for consecutive numbers (e.g., 1 is left, 2 is right, 3 is left, and so on). The present experiment was designed to exclude this possibility by testing the shape of the SNARC effect in a task in which the responses were completely arbitrary. According to the model, the arbitrary mapping is processed similar to the parity judgment task (see Figure 1). If the task consists of any other mapping between number and response, conditional task related activation will now pass the arbitrary field. These nodes are constructions based solely on the task instructions. Apart from this difference, they operate in exactly the same manner as the parity field.
Method Participants In total, 16 subjects participated in the experiment. All were undergraduate students participating for course requirement. All had normal or corrected-to-normal vision. None were aware of the aim of the study.
Stimuli were the numbers in the range from 1 to 9 (except 5). All participants performed one task consisting of two blocks in a counterbalanced manner. To ascertain fully randomized S-R mappings, we chose mappings so that the number of consecutive numbers assigned to the same response side was minimized. However, we did not use a mapping without consecutive numbers, because this could trigger a parity rule (e.g., 1–3–7–9 left and 2– 4 – 6 – 8 right). We therefore chose only mappings containing exactly one set of consecutive numbers. This resulted in four possible mappings that were assigned between subjects. The first mapping consisted of the numbers 1, 3, 7, and 8 assigned to one hand, whereas the numbers 2, 4, 6, and 9 were assigned to the other hand. The other mappings were 2, 4, 7, and 8 vs. 1, 3, 6, and 9; 2, 3, 6, and 8 vs. 1, 4, 7, and 9; and 2, 3, 7, and 9 vs. 1, 4, 6, and 8. Because of the arbitrary mapping of the stimuli to the response, subjects could not apply a single rule to complete the task. Therefore, subjects were more likely to mistakenly switch stimulus-toresponse mappings during the course of the experiment. To avoid such problems, we now provided feedback about the correctness of the response throughout the entire experiment by means of a green square (correct) or a red square (error) surrounding the number as soon as a response was initiated (remaining on screen for 200 ms). For the same reason, the practice session was lengthened to 32 practice trials instead of 16. Otherwise, stimuli and procedure were the same as in the previous experiments.
Results and Discussion Trials with latencies faster than 200 ms were discarded from the analysis. In total, 5.05% errors were made. Median RTs for the numbers in the range from 1 to 9 (except 5) were 506, 532, 514, 528, 520, 517, 531, and 530 ms. Median RTs and number of errors were entered in a 2 (magnitude: small or large) " 2 (response: left or right) " 4 (distance) ANOVA. For both the RT data, F(1, 15) ! 10.39, MSE ! 1,730, p # .01, and the error data, F(1, 15) ! 16.22, p # .01, the SNARC effect was highly significant. Participants made fewer errors and were faster to respond to relative small numbers with the left hand and to relative large numbers with the right hand. The error analysis also showed a main effect for distance, F(3, 45) ! 6.52, p # .001. More specifically, subjects made more errors to the numbers 1, 2, 8, and 9 compared with the numbers 3, 4, 6, and 7. Importantly, a significant three-way interaction showed that more errors were made to the larger distances with the right hand to smaller numbers (e.g., 1 and 2) and with the left hand to larger numbers (e.g., 8 and 9), F(3, 45) ! 3.64, p # .05. Important for the present purposes, apart from a main right-hand advantage, F(1, 15) ! 4.71, MSE ! 5,055, p # .05, no effects reached significance in the latency analysis. Furthermore, the presence of the SNARC effect was confirmed with the regression method as described above. This resulted in the following regression equation: dRT ! 19.35– 8.59 (magnitude), with the slope values reliably different from 0, t(15) ! $4.38, p # .001. Both Figure 7 and the statistical analysis clearly show that the shape of the SNARC effect is continuous rather than categorical (Z ! 2.01, n ! 16, p # .05; Meng et al., 1992). Furthermore, when the model was applied to this arbitrary mapping, both the SNARC effect and its continuous shape were replicated (see Figure 5). This experiment shows that a continuous shape is found both with empirical data and with the data obtained from the model. This further confirms the idea that the shape of the SNARC effect is due to a continuous magnitude code that can be influenced by both the time course of the SNARC effect and the distance effect.
NUMBERS AND SPACE
41
Figure 7. The observed data and regression line represent response time differences (dRT) between righthanded minus left-handed responses generated by empirical data (A) and the data in a task with an arbitrary mapping rule (B).
General Discussion The present study provides a framework to conceptualize the SNARC effect. This effect shows that relatively small numbers are responded to faster with the left-hand side, whereas the converse is true for relatively large numbers (Dehaene et al., 1993). Any framework that incorporates the SNARC effect must be able to account for its basic characteristics. For the SNARC effect, these characteristics are automatic activation of magnitude information and its associated spatial code, a response-related origin, the relative status of magnitude, and the increasing strength of the SNARC effect with passing of time. These characteristics are observed in the present model. First, the model assumes that magnitude information is coded automatically. Second, the model respects the response-related origin, because mappings responsible for the SNARC effect depart after the numbers have been processed semantically. Third, the relative status of magnitude coding is respected, because the standard field always codes for the middle of the range of relevant numbers (or the standard, in a magnitude comparison task). This implies that a specific number is not coded as left or right but that a specific number is coded as either small or large, which in turn activates left or right responses. Finally, the model correctly showed that the SNARC effect increases with time. While respecting these basic characteristics in its architecture, the model was able to produce a SNARC effect very similar to those reported in behavioral studies. It is important to note that the model does not derive from new concepts but rather builds on a combination of previous conceptions that were proposed to account for spatial congruency effects (e.g., the Simon effect; e.g., De Jong et al., 1994; Kornblum et al., 1990) and basic numerical processing (Verguts et al., 2005). The general idea is that upon the presentation of a number, two routes are activated. One route codes for the automatically triggered spatial code, and the second route codes for the task dependent instructions. The assumption of such a dual-route architecture underlying the SNARC effect is validated by previous work showing that the nature of the interaction between the Simon and the SNARC effects depends on the relevance of the magnitude information (Gevers et al., in press). On the basis of this general idea, the model replicated the SNARC effect. Furthermore, on the basis of the knowledge from
previous work on basic numerical processing, the model was able to make some new predictions that were confirmed by subsequent behavioral studies. More specifically, both the behavioral results and the model showed a SNARC effect that was distributed continuously for a parity judgment task and that was distributed more categorically in a magnitude comparison task. The model explains these differential distributions as the result of an interaction with the distance effect. This effect plays a significant role in magnitude comparison but not in parity judgment. Therefore, in a magnitude comparison task, RTs on numbers closer to the reference number 5 (e.g., 4 and 6) will be prolonged more than the number 3 and 7 and so on. In combination with the finding that the SNARC effect increases with time, a categorical effect is predicted. Additionally, it was hypothesized that any task without a distance effect should show a continuous distribution. Therefore, a task was designed with an arbitrary mapping (e.g., 1, 2, 8, and 9 mapped to one hand, the remaining numbers mapped to the other hand). As predicted by the model, we found a SNARC effect with a continuous distribution that increased with time. At first sight, the present results are at odds with previous behavioral research showing that the SNARC effect can be reversed by task instructions. In Ba¨chtold et al.’s (1998) study, a regular SNARC effect was observed when subjects were asked to imagine the numbers as presented on a ruler. If they had to think of numbers as presented on a clock face (for which small numbers are represented on the right and large numbers on the left), a reversed SNARC effect was present in that small numbers were responded to faster with the right hand and large numbers were responded to faster with the left hand. This seems difficult to explain with the present model because the connection between magnitude and response hand is based on automatic (long-term memory) associations. However, Ba¨chtold et al. (1998) also found that this reversal of the SNARC effect was associated with an additional cost in response latencies, suggesting that the left-to right representation of numbers was indeed triggered automatically but then interfered with the required clock face interpretation. Translated in terms of the model, this means that the clock-face task requires another number representation apart from the number field (e.g., a clock-face like representation). In our view, the number field remains the default that triggers magnitude informa-
42
GEVERS, VERGUTS, REYNVOET, CAESSENS, AND FIAS
tion automatically, but can be replaced with the alternative clock face representation, resulting in the additive delay in response latencies. The fact that the cost in this task was additive with a reversed SNARC effect suggests that the conflict between both number representations is solved before the response related stages at a semantic level. The present results are in line with a number of other studies showing that the SNARC effect is reflected in response selection and/or preparation but not in response execution evidenced by both eye movement studies (Fischer, Warlop, Hill, & Fias, 2004; Schwarz & Keus, 2004) and psychophysiological studies (Gevers et al., in press; Keus et al., 2005). Indeed, the model is based on a threshold idea in which a response (be it manual or oculomotor) is emitted as soon as a certain threshold is reached. The model does not assume differential response speeds once this threshold is reached. This interpretation is also in accordance with recent event-related potential findings that the SNARC effect is situated at response related stages but not at later response execution processes (Gevers et al., in press). In conclusion, a combination of computational modeling with behavioral studies on the domain of numbers elucidated the relation between language and space in more detail than is possible with verbal theorizing only. More specifically, the goal of the present study was to provide a general framework for interpreting the SNARC effect. The resultant dual-route model was able to replicate the basic characteristics associated with the SNARC effect. It also provided new explanations and predictions that were confirmed by behavioral studies. Furthermore, the framework implies strong similarities between the basic architecture underlying the SNARC effect and spatial congruency effects, a topic that clearly deserves future interest.
References Ba¨chtold, D., Baumu¨ller, M., & Brugger, P. (1998). Stimulus-response compatibility in representational space. Neuropsychologia, 36, 731–735. Banks, W. P., Fujii, M., & Kayra-Stuart, F. (1976). Semantic congruity effects in comparative judgments of magnitudes of digits. Journal of Experimental Psychology: Human Perception and Performance, 2, 435– 447. Beringer, J. (1995). Experimental run time system (Version 3.11) [Computer software]. Frankfurt, Germany: Berisoft. Caessens, B., Hommel, B., Reynvoet, B., & Van Der Goten, K. (2004). Backward-compatibility effects with irrelevant stimulus-response overlap: The case of the SNARC effect. Journal of General Psychology, 131, 411– 425. Dehaene, S., Bossini, S., & Giraux, P. (1993). The mental representation of parity and number magnitude. Journal of Experimental Psychology: General, 122, 31–396. Dehaene, S., Dupoux, E., & Mehler, J. (1990). Is numerical comparison digital? Analogical and symbolic effects in two-digit number comparison. Journal of Experimental Psychology: Human Perception and Performance, 16, 626 – 641. De Jong, R., Liang, C-C., & Lauber, E. (1994). Conditional and unconditional automaticity: A dual-process model of effects of spatial stimulusresponse correspondence. Journal of Experimental Psychology: Human Perception and Performance, 20, 731–750. Fias, W. (2001). Two routes for the processing of verbal numbers: Evidence from the SNARC effect. Psychological Research, 65, 250 –259. Fias, W., Brysbaert, M., Geypens, F., & d’Ydewalle, G. (1996). The
importance of magnitude information in numerical processing: Evidence from the SNARC effect. Mathematical Cognition, 2, 95–110. Fias, W., Lauwereyns, J., & Lammertyn, J. (2001). Irrelevant digits affect feature based overlap depending on the overlap of neural circuits. Cognitive Brain Research, 12, 415– 423. Fischer, M. H., Warlop, N., Hill, R. L., & Fias, W. (2004). Oculomotor bias induced by number perception. Experimental Psychology, 51, 91–97. Gevers, W., Caessens, B., & Fias, W. (2005). Towards a common processing architecture underlying Simon and SNARC effects. European Journal of Cognitive Psychology, 17, 659 – 673. Gevers, W., Ratinckx, E., De Baene, W., & Fias, W. (in press). Further evidence that the SNARC effect is processed along a dual-route architecture: Evidence from the lateralized readiness potential. Experimental Psychology. Hommel, B. (1993). The relationship between stimulus processing and response selection in the Simon task: Evidence for a temporal overlap. Psychological Research, 55, 280 –290. Hommel, B. (1994). Spontaneous decay of response-code activation. Psychological Research, 56, 261–268. Keus, I. M., & Jenks, K. M., & Schwarz, W. (2005). Psychophysiological evidence that the SNARC effect has its functional locus in a response selection stage. Cognitive Brain Research, 24, 48 –56. Keus, I. M., & Schwarz, W. (2005). Searching for the functional locus of the SNARC effect: Evidence for a response-related origin. Memory & Cognition, 33, 681– 695. Kornblum, S., Hasbroucq, T., & Osman, A. (1990). Dimensional overlap: Cognitive basis for stimulus–response compatibility—A model and taxonomy. Psychological Review, 97, 253–270. Lorch, R. F., Jr., & Myers, J. L. (1990). Regression analyses of repeated measures data in cognition research. Journal of Experimental Psychology: Learning, Memory, and Cognition, 16, 149 –157. Luce, R. D. (1986). Response times: Their role in inferring elementary mental organization. New York: Oxford Science Publications. Mapelli, D., Rusconi, E., & Umilta`, C. (2003). The SNARC effect: An instance of the Simon effect? Cognition, 88(3), B1–B10. Meng, X. L., Rosenthal, R., & Rubin, D. B. (1992). Comparing correlated correlation coefficients. Psychological Bulletin, 111, 172–175. Ratcliff, R. (1979). Group reaction time distributions and an analysis of distribution statistics. Psychologican Bulletin, 86, 446 – 461. Schwarz, W., & Keus, I. M. (2004). Moving the eyes along the mental number line: Comparing SNARC effects with saccadic and manual responses. Perception & Psychophysics, 66, 651– 664. Simon, J. R., & Rudell, A. P. (1967). Auditory S-R compatibility: The effect of an irrelevant cue on information processing. Journal of Applied Psychology, 51, 300 –304. Tzelgov, J., Meyer, J., & Henik, A. (1992). Automatic and intentional processing of numerical information. Journal of Experimental Psychology: Learning, Memory, and Cognition, 18, 166 –179. Valle-Incla`n, F. (1996). The locus of interference in the Simon effect: An ERP study. Biological Psychology, 43, 147–162. van der Lubbe, R. H. J., Jaskowski, P., Wauschkuhn, B., & Verleger, R. (2001). Influence of time pressure in a simple response task, a choiceby-location task and the Simon task. Journal of Psychophysiology, 15, 241–255. Verguts, T., Fias, W., & Stevens, M. (2005). A model of exact smallnumber representation. Psychonomic Bulletin & Review, 12, 66 – 80. Walsh, V. (2003). A theory of magnitude: Common cortical metrics of time, space and quantity. Trends in Cognitive Sciences, 7, 483– 488. Zebian, S. (2005). Linkages between number concepts, spatial thinking, and directionality of writing: The SNARC effect and the reverse SNARC effect in English and Arabic monoliterates, biliterates and illiterate Arabic speakers. Journal of Cognition and Culture, 5, 165–191.
43
NUMBERS AND SPACE
Appendix Model of the SNARC Effect We used the same model and parameters as described in Verguts et al. (2005), with the following modifications. The original model consists of (visual) input fields, number fields (number line), and response fields. We removed the input fields, as they are not relevant to the present study. Further, for simplicity we assumed equilibrium was reached for the activation values of the nodes in the standard field and the number field, so that activation values in these fields are constant over time in the present implementation. As a consequence, when number i is presented to the number field (see Figure 1), activation of unit j in this field is equal to xNj ! exp " 0.1391($!i " j!), where subscript N indicates number field. A similar result holds for the standard field. Hence, the activation of number node i equals exp($0) ! 1, and activation of surrounding numbers decays exponentially with the distance between that number and number i. For example, if the number 3 is presented to the number field, activation of node 3 equals 1, activation of nodes 2 and 4 equals exp($1) ! 0.37, activation of nodes 1 and 5 equals exp($2) ! 0.14, and so on. To model the time course of the SNARC effect, we introduced differences in processing speed over trials. In particular, we added a parameter C that scaled the activation of number field units (xSj and xNj for units in the standard field and number field, respectively) so the values xSj and xNj were equal to Cexp( " !i " j!). Values of C were chosen symmetrically around C ! 1 (the value implicitly used earlier): C ! 1.15, 1.05, 0.95, and 0.85. Larger values of C imply faster response times.
Magnitude Task In Verguts et al. (2005), the connections from the number fields to the output units were trained. Ten such replications were obtained. We arbitrarily took the weights from the first of these replications, for both the parity and the comparison tasks. Results were similar for other replications. The standard number (i.e., 5) was projected on the standard field, and the number for comparison on the number field. The equation for the magnitude field node “smaller” was equal to d x &t' ! " xSmaller &t' # dt Smaller
" 15
"
and a similar equation holds for the xLarger node (for response “larger”). Smaller Smaller The weights wMSi and wMNi (subscript M for magnitude; subscripts S and N for standard field and number field, respectively) were obtained from the Verguts et al. model. They are shown in Table A1. In that model, the response was chosen on the basis of the values xSmaller and xLarger, but in the present case we need response nodes corresponding to the two hands (see Figure 1). The mappings between the two choices “smaller” and “larger,” on the one hand, and “left” and “right,” on the other, depend partly on the task settings and partly on automatic associations. The automatic associations are between “larger” and “right,” on the one hand, and between “smaller” and “left,” on the other. This is our implementation of the SNARC effect. In particular, suppose the task is to press the left hand for a number left of (i.e., smaller than) the standard. This is a compatible mapping, and the corresponding equation for the left hand response is then equal to d x &t' ! " xLeft &t' # xSmaller &t' # $ SNARC xSmaller &t' " % ln hxRight &t'. dt Left (A2) Similar equations hold for the right hand and for an incompatible task mapping (i.e., press right hand for a number smaller than the standard). The SNARC effect originates from the factor $SNARC xSmaller(t); the parameter $SNARC scales the size of the effect. It was set equal to 0.2 in all simulations reported in the text. The factor % Inh xRight (t) represents inhibition between the two response nodes; the scaling parameter %Inh was set equal to 0.3 in all simulations reported in the text.
Parity Task The relevant choices for the parity task are “even” and “odd.” The equation for “even” is equal to d x &t' ! " xEven &t' # dt Even
15
Smaller wMSi xSi&t' #
i!1
Smaller wMNi xNi&t',
(A1)
i!1
" 15
Even wPNi xNi&t'.
Even As for the magnitude task, the weights wPNi (subscript P for parity, N for number field) are obtained from our earlier study and are shown in Table
Table A1 Connection Weights From the Standard and Number Fields to the Middle Layer of the Model for the Magnitude and Parity Tasks Number 1 2 3 4 5 6 7 8 9 10 11 12 13 14 15
(A3)
i!1
Smaller wMSi
Smaller wMNi
Larger wMSi
Larger wMNi
$0.4357 $0.0218 0.0080 $0.0122 0.0479 0.0594 0.1076 0.1081 0.1243 0.1382 0.1146 0.1662 0.1741 0.1148 0.2996
0.7236 0.4607 0.3118 0.3557 0.2644 0.2215 0.1923 0.1827 0.1760 0.0946 0.1354 0.0801 0.0202 0.0753 0.0974
0.6678 0.3980 0.2381 0.2862 0.2461 0.2037 0.1721 0.1353 0.1084 0.1203 0.1105 $0.0214 0.1262 $0.0182 0.0492
$0.3495 0.0325 0.0087 0.0232 0.0903 0.1199 0.1224 0.1552 0.1754 0.2011 0.1889 0.2015 0.2018 0.1975 0.3430
Even wPNi
Odd wPNi
0.1158 0.8979 $0.1534 0.8564 $0.0968 0.8435 $0.1057 0.8499 $0.1071 0.8441 $0.0964 0.8534 $0.1561 0.8739 0.1656
0.9399 $0.1475 0.8451 $0.0877 0.8438 $0.1100 0.8466 $0.0953 0.8479 $0.1152 0.8477 $0.0893 0.8415 $0.1391 0.9271
44
GEVERS, VERGUTS, REYNVOET, CAESSENS, AND FIAS
A1. A similar equation holds for response “odd.” The connections from the even and odd responses are determined entirely by task settings; that is, there are no automatic associations between “even” and “odd,” on the one hand, and “left” and “right” on the other. It is assumed that the magnitude field is also automatically activated in this task. However, its influence will be smaller than that of the relevant parity field because the automatic connections in the comparison path are weaker than the relevant connections (because $SNARC # 1). Hence, if the task instructions require a left-hand response for an even number, the equation for a left-hand response is as follows: d x &t' ! $xLeft &t' # xEven &t' # $ SNARC xSmaller &t' " % Inh x Right &t'. dt Left
(A4)
Note that in the equations for the magnitude task and the parity task, only the task-relevant term is different: xSmaller(t) and xEven(t), respectively, in Equations A2 and A4, respectively. In the simulations reported here, the standard used in the parity task was the mean of the range of numbers (i.e., 5); the shape of the activation distribution on the standard field was similar
to that in the number field and was equal to that used in the magnitude task. Alternatively, we could have assumed that in the parity task, the whole range of relevant numbers (1–9) is uniformly activated in the standard field. This assumption led to very similar results.
Arbitrary Task For the arbitrary task, activation equations very similar to those of the other two tasks apply, except that the task-relevant term goes via the arbitrary field. Because this task was not used in the Verguts et al. (2005) study, task-relevant weights were set by hand. For example, in the mapping 1,378 versus 2,469, arbitrary node 1 is connected to number field nodes 1, 3, 7, and 8 (with connection weight equal to 1); arbitrary node 2 is connected to number field nodes 2, 4, 6, and 9.
Received March 28, 2005 Revision received May 30, 2005 Accepted May 31, 2005 !