Annals of Nuclear Energy 87 (2016) 707–719
Contents lists available at ScienceDirect
Annals of Nuclear Energy journal homepage: www.elsevier.com/locate/anucene
Numerical implementation, verification and validation of two-phase flow four-equation drift flux model with Jacobian-free Newton–Krylov method Ling Zou ⇑, Haihua Zhao, Hongbin Zhang Idaho National Laboratory, P.O. Box 1625, Idaho Falls, ID 83415-3870, USA
a r t i c l e
i n f o
Article history: Received 1 June 2015 Received in revised form 27 July 2015 Accepted 28 July 2015 Available online 24 August 2015 Keywords: Drift flux model Jacobian-free Newton–Krylov method Verification Validation
a b s t r a c t This paper presents a numerical investigation on using the Jacobian-free Newton–Krylov (JFNK) method to solve the two-phase flow four-equation drift flux model with realistic constitutive correlations (‘closure models’). The drift flux model is based on Isshi and his collaborators’ work. Additional constitutive correlations for vertical channel flow, such as two-phase flow pressure drop, flow regime map, wall boiling and interfacial heat transfer models, were taken from the RELAP5-3D Code Manual and included to complete the model. The staggered grid finite volume method and fully implicit backward Euler method was used for the spatial discretization and time integration schemes, respectively. The Jacobian-free Newton–Krylov method shows no difficulty in solving the two-phase flow drift flux model with a discrete flow regime map. In addition to the Jacobian-free approach, the preconditioning matrix is obtained by using the default finite differencing method provided in the PETSc package, and consequently the labor-intensive implementation of complex analytical Jacobian matrix is avoided. Extensive and successful numerical verification and validation have been performed to prove the correct implementation of the models and methods. Code-to-code comparison with RELAP5-3D has further demonstrated the successful implementation of the drift flux model. ! 2015 Elsevier Ltd. All rights reserved.
1. Introduction Accurate modeling and simulation of the two-phase flow phenomena are critical to the safety analysis of nuclear power reactors. Two-phase flow problems can generally be formulated using drift flux models or two-fluid models. Several existing reactor safety system analysis codes, such as RELAP5 (U.S. Nuclear Regulatory Commission, 2001) and TRACE (U.S. Nuclear Regulatory Commission, 2010), have achieved great successes by employing the two-fluid six-equation two-phase flow model that treats the two phases separately with the interfacial interactions considered by constitutive correlations (‘‘closure models’’). The drift flux models (Zuber and Findlay, 1965; Ishii, 1977; Ishii and Hibiki, 2011), on the other hand, treat the two phases as a mixture, and the models are formulated to consider the conservation laws of the mixture. The relative motion between the two phases is treated by constitutive correlations. Although the drift flux models have limitations in certain applications, they are widely used in many applications due to their simplicity and applicability to a ⇑ Corresponding author.
E-mail address:
[email protected] (L. Zou).
http://dx.doi.org/10.1016/j.anucene.2015.07.033 0306-4549/! 2015 Elsevier Ltd. All rights reserved.
wide range of two-phase flow problems. For example, the RETRAN-3D (Electric Power Research Institute, 1998) code uses the drift flux models and has many applications in reactor transient analyses including a small break loss-of-coolant accident. The TASS/SMR system analysis code is developed based on a three-equation drift flux model (with an additional mass equation for the non-condensable gas) for the system-integrated modular advanced reactor, SMART (Chung et al., 2012; Chung et al., 2013). Drift flux models have also been widely used in the subchannel analysis of boiling water reactor (BWR) fuel bundles Khan and Yi, 1985; Hashemi-Tilehnoee and Rahgoshay, 2013a,b, BWR core simulators (Galloway, 2010), and two-phase flow instabilities analyses (Nayak, 2007; Wang et al., 2011). Comparing to the more complex two-fluid six-equation model, the drift flux models are relatively easier to solve and implement into a computer code. However, due to the nonlinear closure models, iterative methods are normally used in solving such equation systems to achieve convergence (Galloway, 2010; Talebi et al., 2012). The Jacobian-free Newton–Krylov (JFNK) method has gained many successes in solving nonlinear systems in different disciplines (Knoll and Keyes, 2004). Mousseau has done several pioneering works (Mousseau, 2004, 2005) to use such a method
708
L. Zou et al. / Annals of Nuclear Energy 87 (2016) 707–719
Nomenclatures aw e f ||E|| Ed F G h hji J p v t x q00 T U Vgj V gj v xe
heating surface density, [1/m] specific internal energy, [J/kg] friction factor, [non-dimensional] error norm entrainment rate nonlinear function mass flux, [kg/m2-s] specific enthalpy, [J/kg] two-phase volumetric flux, [m/s] Jacobian matrix pressure, [Pa] velocity, [m/s] time, [s] axial distance, [m] heat flux, [W/m2] temperature, [K] unknown vector drift velocity of gas phase, [m/s] mean drift velocity of gas phase, [m/s] Krylov vector equilibrium quality
to solve the two-fluid problems implicitly. In our previous works (Zou et al., 2015a,b), we have successfully demonstrated the applications of the JFNK method in several simplified two-fluid problems using a high-resolution spatial discretization scheme on the staggered grid. It should be pointed out that by far only simplified and continuous closure models have been used in applying the JFNK method to solve two-phase flow problems with the two fluid models (Mousseau, 2004, 2005; Zou et al., 2015a,b). Recently, the JFNK method has also been used in newly developed reactor system analysis code (Idaho National Laboratory, 2012, 2014) and its application in multi-physics simulations of nuclear reactors (Gaston et al., 2015). However, in these works, only single-phase flow model or simplified two-phase flow model was used. There are no published works showing JFNK applications with realistic closure models such as those used in the RELAP5 code with the full spectrum of flow regimes. The discontinuities in solution space, due to the discrete flow regimes, could potentially prevent the Newton’s method from converging. Additionally, an effective preconditioning scheme is required to help the Krylov method converge efficiently. The same challenges are also present when applying the JFNK method to solve the drift the drift flux models. Based on these discussions, we believe that it is still lack of full understanding of the JFNK method in the applications of solving realistic two-phase flow problems. Resolving the potential issues aforementioned are critical to prove the practicability of the JFNK method applied to solving the realistic two-phase flow problems. In this work, our objective is to investigate application of the JFNK method to solve the four-equation drift flux model with realistic and discrete closure models. Identifying and resolving numerical issues are also the purpose of this work. Section 2 provides model descriptions for the drift flux model along with the kinematic closure correlations developed by Ishii and Hibiki (2011), as well as additional constitutive correlations required to fully close the system. Section 3 presents the numerical methods to solve the drift flux model. Section 4 presents the numerical verification and validation of the code using experimental data, as well as code comparison to the RELAP5-3D (RELAP5-3D, 2012a). Section 5 presents discussions and conclusions.
Greek symbols a void fraction, [non-dimensional] e mean absolute error Dx finite volume cell size, [m] Dt time step size, [s] 2 perturbation parameter in Jacobian-free Newton–Krylov method q density, [kg/m3] Cg volumetric vapor generation rate, [kg/m3-s] r surface tension, [N/m] Subscripts f liquid phase g gas phase i finite volume cell index inlet inlet condition m mixture sat saturation condition w wall
2. Physical model descriptions 2.1. One-dimensional four-equation drift flux model The one-dimensional four-equation drift flux model used in this work is directly adapted from the models developed by Isshi and his coworkers (Ishii, 1977; Ishii and Hibiki, 2011; Hibiki and Ishii, 2003, 2005). The original set of equations for the one-dimensional drift flux model includes two continuity equations (mixture and the dispersed phase), one mixture momentum equation and one mixture energy equation. In this work, the original set of equations has been simplified and is given as Eqs. (1–4):
@ qm @ðqm v m Þ þ ¼0 @x @t
ð1Þ
! " @ðaqg Þ @ðaqg v m Þ @ aqg qf þ þ V gj ¼ Cg @t @x @x qm
ð2Þ
@v m @v m 1 @p f þ vm ¼% % g % m v jv j @t @x qm @x x 2D m m # $ aqg qf 1 @ % V gj 2 qm @x ð1 % aÞqm # $ @ðqm em Þ @ðqm hm v m Þ @ aqg qf þ þ Dhgf V gj @t @x @x qm # $ a ð q % qg Þ @p f V gj ¼ q00w aw þ v m þ @x qm
ð3Þ
ð4Þ
in which the subscripts m, g and f denote the mixture, gas phase, and liquid phase, respectively. V gj is the mean drift velocity of the gas phase. Comparing to the original equations in Hibiki and Ishii’s 2003 journal article (Hibiki and Ishii, 2003) and Ishii’s 2011 book (Ishii and Hibiki, 2011), there are several noticeable changes that need explanations: (1) the mixture momentum equation has been rewritten in the primitive form, which was done in a similar way to obtain the primitive momentum equation for the single-phase Euler equations; (2) in the mixture energy equation,
709
L. Zou et al. / Annals of Nuclear Energy 87 (2016) 707–719
the two transient terms of enthalpy and pressure were combined to obtain the transient term of the internal energy; (3) the stress tensor and covariance terms were ignored; and (4) the drift terms in the gas phase mass equation and the mixture energy equation have been moved to the left-hand side of the equations, which will be numerically treated as advection terms in the numerical implementations (discussed later). The primary variables to be solved from this set of equations are p, a, vm, and T, which are pressure, void fraction (volume fraction of the gas phase), mixture velocity, and temperature, respectively. It is noted that the phasic temperatures, Tl and Tg, have not been properly defined yet. There are two possible choices for defining the phasic temperatures. For one choice, it is assumed that the phasic temperatures are the same, such that, Tf = Tg = T. For the other choice, the vapor phase is always at the saturation condition, such that Tg = Tsat(p) and the liquid phase temperature can deviate from the saturation temperature (e.g., subcooled liquid) and Tf = T. More discussion can be found in Section 2 of Ref. (Hirt et al., 1979). According to that report, there is only little difference between these two choices. However, for flow boiling problems, it is obvious that the later choice is more appropriate. For example, under subcooled flow boiling conditions, it is incorrect to assume that the vapor temperature is the same as the (subcooled) liquid temperature. Hibiki and Ishii’s works (Ishii and Hibiki, 2011; Hibiki and Ishii, 2003) provide a framework for the drift flux model, along with kinematic closure models for different flow regimes. However, other key constitutive models are absent. These include the criteria for the transition of the flow regimes, two-phase pressure drop coefficients, wall boiling model, and interfacial heat transfer coefficients, etc. To obtain a complete system of equations for numerical implementation into a computer code, the water/steam properties and additional constitutive correlations are needed. These are summarized in the following subsections. 2.2. Water/steam properties The water/steam properties (such as phasic density and phasic specific internal energy) are provided as functions of mixture pressure and phasic temperature. For example, the liquid phase density is obtained as:
qf ¼ qf ðp; T f Þ
ð5Þ
The water/steam properties used in this work is calculated by fast and accurate bilinear interpolations of the water/steam properties provided by the International Association for the Properties of Water and Steam (IAPWS) (The International Association for the Properties of Water and Steam). Water/steam properties are prepared in tables from the highly accurate yet expensive IAPWS function calls. When water/steam properties are needed, they are interpolated from the pre-prepared tables. Implementation details are documented in Zou et al.’s 2014 report (Zou et al., 2014). 2.3. Drift flux model constitutive correlations and flow regimes In this work, only the vertical flow regimes are considered. Implementation of the vertical flow regime map is based on that used in the RELAP5-3D code (RELAP5-3D, 2012a; RELAP5-3D, 2012b) (see Section 3.2 of Ref. (RELAP5-3D, 2012b) for more details). It is noted that, in RELAP5-3D, the slug flow regime and churn flow regime are combined as a single a single flow regime called slug flow. To maintain consistency with RELAP5-3D, the same strategy is adopted in this work. Consequently, the vertical flow regimes considered include single-phase liquid flow, bubbly flow, slug flow, transition region between slug and annular mist
flow, and annular mist flow. The derivations of V gj and corresponding closure correlations for the two-phase flow regimes are summarized below. As suggested by Hibiki and Ishii (Hibiki and Ishii, 2003), the V gj term used in Eqs. (2–4) have to be expressed as a function of other known variables and constitutive correlations. For bubbly and slug flow regimes, this can be done by combing Eqs. (9) and (15) in Hibiki and Ishii’s 2003 journal article (Hibiki and Ishii, 2003) to obtain the following useful correlation:
V gj ¼
qm V gj þ qm ðC 0 % 1Þv m qm % ðC 0 % 1Þaðqf % qg Þ
ð6Þ
in which, Vgj and C0 are the weighted mean drift velocity of the gas phase and the distribution parameter, respectively. A complete set of constitutive correlations for the weighted mean drift velocity of the gas phase (Vgj) and distribution parameter (C0) are provided in Hibiki and Ishii (2003) work for all flow regimes. Eq. (6) has also been obtained in Talebi et al. (2012) work. For bubbly and slug flow regimes, the weighted mean drift velocity Vgj is the following: Bubbly flow:
!1=4 pffiffiffi Dqg r V gj ¼ 2 ð1 % aÞ1:75 2
qf
ð7Þ
Slug flow:
V gj ¼ 0:35
Dqg r
qf
!1=2
ð8Þ
The simplified version of the distribution parameter (C0) for round tube is used for both the bubbly and slug flow regimes:
qffiffiffiffiffiffiffiffiffiffiffiffiffi C 0 ¼ 1:2 % 0:2 qg =qf
ð9Þ
For the annular mist two-phase flow regime, the mean drift velocity of the gas phase, V gj , is given as a function of the two-phase volumetric flux, hji,
ð1 % aÞð1 % Ed Þ qffiffiffiffiffiffiffiffiffiffiffiffiffi hji þ V gj & a þ 4 qg =qf
sffiffiffiffiffiffiffiffiffiffiffiffiffiffiffiffiffiffiffiffiffiffiffiffiffiffiffiffiffiffiffiffiffiffiffiffiffiffiffiffiffiffiffiffiffi! DqgDð1 % aÞð1 % Ed Þ 0:015qf
ð10Þ
Where hji is an unknown as well. In this case, the value of V gj can be obtained by combining Eqs. (10) and (15) in Hibiki and Ishii’s 2003 journal article (Hibiki and Ishii, 2003) to cancel hji:
V gj ¼
C1v m þ C1C2
1 % C1
aðqf %qg Þ qm
ð11Þ
where, the two constants C1 and C2 are terms in the Eq. (64) of Hibiki and Ishii’s 2003 journal article (Hibiki and Ishii, 2003), defined as:
C1 ¼
ð1 % aÞð1 % Ed Þ qffiffiffiffiffiffiffiffiffiffiffiffiffi a þ 4 qg =qf
sffiffiffiffiffiffiffiffiffiffiffiffiffiffiffiffiffiffiffiffiffiffiffiffiffiffiffiffiffiffiffiffiffiffiffiffiffiffiffiffiffiffiffiffiffi DqgDð1 % aÞð1 % Ed Þ C2 ¼ 0:015qf
ð12Þ
ð13Þ
It is noted that, in the annular mist flow regime, the entrainment rate of liquid droplet in the vapor core region is needed. The model to predict the entrainment rate is based on the model proposed by Wallis (U.S. Nuclear Regulatory Commission, 2010). More details and discussions can be found in Section 1.2.1 of Chapter 14 in Ishii and Hibiki’s 2011 book (Ishii and Hibiki,
710
L. Zou et al. / Annals of Nuclear Energy 87 (2016) 707–719
2011). For the value of V gj at the slug-annual mist transition region, linear interpolation based on void fraction is used. 2.4. Frictional pressure drop Constitutive correlations for the pressure drop due to friction are needed for both the single- and two-phase flows. The correlations used in this work are mainly based on those used in RELAP5-3D (RELAP5-3D, 2012a). The single-phase flow frictional factor is calculated in three flow regimes, laminar flow, turbulent flow and a transition region between these two. The two-phase flow frictional pressure drop is based on a two-phase multiplier approach:
! " dp dx two
phase
¼ /2f
! " ! " dp dp ¼ /2g dx f dx g
ð14Þ
In the context of the drift flux model, the wall friction term in the momentum equation becomes:
! " fm 1 dp v m jv m j ¼ 2D qm dx two
phase
ð15Þ
in which, /f and /g are the liquid-alone and vapor/gas-alone two-phase Darcy-Weisbach friction multipliers, respectively. More details of the implementations of frictional pressure drop can be found in Section 3.3.8 of Ref. (RELAP5-3D, 2012a).
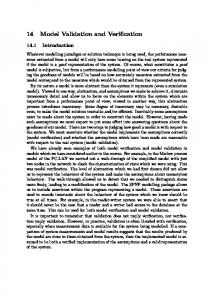
3. Numerical and solution methods Numerical and solution methods include: (1) the finite volume discretization scheme based on the staggered grid mesh arrangement; (2) first-order fully implicit backward Euler time integration scheme; and (3) JFNK method to solve the nonlinear equation system. 3.1. Finite volume method using staggered grid mesh In this work, the finite volume method based on the staggered grid mesh has been used for the spatial discretization of the equation system. For the staggered grid mesh arrangement, scalar variables (such as pressure, void fraction, and temperature) are arranged at the cell centers, while vector variables (such as mixture velocity) are arranged at the cell edges, which are schematically shown in Fig. 1. With pressure, void fraction, and temperatures being defined at the cell centers, phasic thermodynamic quantities are also defined at the cell centers and calculated from the water/steam properties functions. For example, the liquid density at the ith volume is calculated as:
qf ;i ¼ qf ðpi ; T f ;i Þ
ð20Þ
Similarly, the mixture thermodynamic properties are also defined at the cell centers and calculated from their definitions, for example:
2.5. Vapor generation rate
qm;i ¼ ai qg;i þ ð1 % ai Þqf ;i
Additional constitutive correlations are needed to determine the vapor generation rate, Cg term, in the gas phase continuity Eq. (2). In RELAP5-3D RELAP5-3D, 2012a, this term is modeled in two regions: the near wall region and bulk region. A similar concept is used here,
It is worth noting that the weighted mean drift velocity of the gas phase (Vgj) and the distribution parameter (C0) are generally correlated with local phasic thermodynamic properties and void fraction, etc., and therefore both have been defined at the cell centers:
Cg ¼ Cw þ Cig
V gj;i ¼ V gj ðai ; qf ;i ; qg;i ; . . .Þ
ð22Þ
C 0;i ¼ C 0 ðai ; qf ;i ; qg;i ; . . .Þ
ð23Þ
ð16Þ
in which, Cw and Cig are the volumetric vapor generation rate in the near wall region and bulk region, respectively. The near wall region volumetric vapor generation rate is determined by the method proposed by Lahey, combining with the Saha-Zuber correlation to determine the necessary conditions for net void generation (see Section 4.7.1.1 of Ref. (RELAP5-3D, 2012b):
Cw ¼
8 0 > > >
> 00 > :qw aw hfg
hf < hcr hcr 6 hf 6 hl;sat hf > hl;sat
ð17Þ
ep ¼
qf ½hf ;sat % minðhf ; hf ;sat Þ( qg hfg
ð18Þ
The vapor generation rate in the bulk region is determined by the heat transfer between the two phases and interface, which is assumed to be at the saturation condition. In the drift flux model, the gas phase is assumed to be always at the saturation condition in the boiling region, and thus the volumetric vapor generation in the bulk region is reduced to:
Cig ¼
Hil ðT l % T sat Þ hfg
Consequently, the mean drift velocity of the gas phase, V gj , is also defined at the cell centers. When the value of a variable is required at the cell centers (or cell edges), but the variable is not defined there, an arithmetic average is used, for example,
1 2
qm;iþ1=2 ¼ ðqm;iþ1 þ qm;i%1 Þ
ð24Þ
1 ðv m;i%1=2 þ v m;iþ1=2 Þ 2
ð25Þ
v m;i ¼
in which, ep is the pumping term, defined as:
ð19Þ
in which, Hil is the volumetric interfacial heat transfer coefficient for the liquid phase. This parameter is also flow regime dependent, and the RELAP5-3D constitutive correlations are used (see Section 4.1 of Ref. (RELAP5-3D, 2012b).
ð21Þ
In this work, all advection terms (including those due to drift) in the equations are treated similarly using the classic donor cell concept. It is a first-order but very stable spatial discretization scheme. Using the gas phase mass equation as an example, the mixture advection term on the left-hand side of the equation is discretized as:
& h i @ðaqg v m Þ& ) & ¼ 1 ðv m aq Þ) g iþ1=2 % ðv m aqg Þi%1=2 & @x D x i
ð26Þ
and
ðv m aqg Þ)iþ1=2 ¼ v m;iþ1=2
(
ai qg;i if v m;iþ1=2 > 0 aiþ1 qg;iþ1 otherwise
ð27Þ
The drift term is also numerically treated as an advection term, and thus:
L. Zou et al. / Annals of Nuclear Energy 87 (2016) 707–719
711
3.3. Time integration schemes In this work, a fully implicit backward Euler time integration scheme is used. Using the mixture phase continuity equation as an example, the semi-discretized form is expressed as: n qnþ1 m % qm
Dt
þ
@ðqm v m Þnþ1 ¼0 @x
ð34Þ
in which, Dt is the time step size, and superscripts n and n + 1 denote the old time step and current time step, respectively. 3.4. Jacobian-free Newton–Krylov method
Fig. 1. Schematic drawing of the staggered grid mesh arrangement.
"! ! " ") ! ") # aqg qf aqg qf @ aqg qf 1 V gj ¼ V gj % V gj @x qm Dx qm qm i iþ1=2 i%1=2
ð28Þ
and
!
aqg qf V qm gj
")
iþ1=2
8aq q < i qg;i f ;i
& ¼ V gj &
m;i
iþ1=2 : aiþ1 qg;iþ1 qf ;iþ1
qm;iþ1
if V gj jiþ1=2 > 0 otherwise
ð29Þ
The advection term and drift term in the energy equation can be treated similarly. The advection term of the mixture momentum equation is treated slightly differently as it is expressed in the primitive form, for example,
vm
( & v m;iþ1=2 % v m;i%1=2 @ v m && 1 ¼ v m;iþ1=2 @x &iþ1=2 Dx v m;iþ3=2 % v m;iþ1=2
if v m;iþ1=2 > 0 otherwise
ð30Þ
For all other source terms appearing in the equation, the central differencing scheme is used when a gradient appears. 3.2. Boundary conditions This subsection is not intended to provide a complete set of boundary conditions for the drift flux model. However, it is focused on describing the mass flux inlet and pressure outlet boundary conditions generally found in many applications. Given the liquid phase inlet mass flux Gf,inlet, and vapor phase inlet mass flux, Gg,inlet, the inlet boundary condition for the mixture mass equation is computed as:
ðqm v m Þinlet ¼ Gf ;inlet þ Gg;inlet
ð31Þ
For the vapor mass equation, the inlet boundary condition is given by:
!
aqg v m þ
aqg qf V qm gj
"
inlet
¼ Gg;inlet
ð32Þ
For the mixture energy equation, the inlet boundary condition is given by:
!
q m hm v m þ
aqg qf Dhgf V gj qm
"
inlet
¼ Gf ;inlet hf ;inlet þ Gg;inlet hg;inlet
ð33Þ
where, hf,inlet and hg,inlet are the specific enthalpy for the liquid and gas phase evaluated at the inlet, respectively. When evaluating these two parameters, the inlet temperatures are normally given and the inlet pressure comes from the numerical iterations (i.e., the inlet pressure is part of the unknowns of the system). For the outlet, an outlet pressure boundary is normally used for the momentum equation.
The resulted discretized nonlinear equation from the implicit backward Euler time integration scheme requires an iterative method to solve. In this work, the JFNK method is used, which has proved its capability in many disciplines (Knoll and Keyes, 2004) and has been used in our previous works in solving two-phase flow problems (Zou et al., 2015a,b). This subsection briefly discusses the JFNK method to solve nonlinear system. For a discretized nonlinear system, such as the discretized drift flux model equations, one solves:
FðUÞ ¼ 0
ð35Þ
for the unknown vector, U = [p, a, vm, T]T. The solution to the nonlinear system is obtained by iteratively solving a series of Newton’s linear correction equations:
J k dU k ¼ %FðU k Þ
ð36Þ
where, Jk is the Jacobian matrix; Uk is the kth nonlinear step solution; and dUk is the correction vector. In the JFNK frame, the linear system, Eq. (36), could be effectively solved with a Krylov’s method. In the Krylov’s method, only a matrix–vector product is required and can be approximated as:
Jkv &
FðU k þ 2 v Þ % FðU k Þ 2
ð37Þ
in which, v is the Krylov vector. After the correction vector, dUk, is solved from the linear system, the (k + 1)th nonlinear step solution could be updated as:
U kþ1 ¼ U k þ dU k
ð38Þ
One of the advantages of using the JFNK method is that the explicit formation of the Jacobian matrix could be avoided. The derivation and code implementations of the analytical Jacobian matrix could be a cumbersome and error-prone task for two-phase flow problems, since many thermal–hydraulics correlations have quite complicated forms. In our implementation of the JFNK method, the scientific computational toolkit PETSc (Balay et al., 2013) is used to solve the discretized nonlinear fluid equations. It is important to point out that, the JFNK method generally needs a good preconditioning scheme to be effective and efficient. There are different ways to precondition the JFNK method, which were reviewed in Knoll and Keyes’ 2004 journal article (Knoll and Keyes, 2004). In our work, the preconditioning matrix is obtained by using the default finite differencing method provided in the PETSc package, which showed a satisfactory performance. Convergence difficulties are sometimes observed in the simulations when a discontinuous solution space (jumping from one flow regime to another one) first appears, which could normally be resolved by reducing the time step size temporarily for several time steps.
712
L. Zou et al. / Annals of Nuclear Energy 87 (2016) 707–719
4. Results and discussions This section presents the numerical verification on the numerical method in Section 4.1, extensive code validation by comparing the numerical results with the experimental data in Section 4.2, and additional code-to-code comparison with the RELAP5-3D code in Section 4.3. 4.1. Numerical verification Numerical verification is an essential part of the modern verification and validation (V&V) process. In general, numerical verification can be performed by the investigation on the convergence rates of the time integration and spatial discretization schemes. Rigorous numerical verification is a very good process to verify the correctness of code implementation. Ideally, convergence rates are obtained by comparing the numerical results with known analytical solutions. However, for the drift flux model and those very complicated constitutive correlations used in this work, it is difficult to find such analytical solutions. In such situations, numerical
results obtained from fine meshes and small time steps are normally used as the reference solutions. This subsection focuses on the numerical verification of the spatial discretization scheme, which is a first-order upwind scheme as described in the previous sections. For a simulation case (Case 6, described in Section 4.2), steady-state solutions were obtained using 320 finite volume cells, which serve as the reference solutions for convergence study. Additional simulations, using finite volume cells from 5 to 80, were then obtained. Following the recommendation given in LeVeque’s 2004 book (LeVeque, 2004), the L-1 numerical error norm is used, which is defined as:
kE1 k ¼ Dx
N X ~ i % uref ðxi Þj ju
ð39Þ
i¼1
The convergence rates of the mesh refinement results are summarized in Table 1, for two main parameters in two-phase flow simulations, equilibrium quality (xe) and void fraction (a). For both parameters, convergence rates of approximately 1 were obtained, which are expected for the first-order spatial scheme. 4.2. Code validation and error analysis
Table 1 Spatial convergence rate of the Case 6 problem. Ncell
Dx (=L/Ncell)
L-1 norm (xe)
Rate
L-1 norm (a)
Rate
80 40 20 10 5
0.01875 0.0375 0.075 0.15 0.3
5.4228E%03 1.2670E%02 2.7365E%02 5.6538E%02 1.1394E%01
– 1.22 1.11 1.05 1.01
1.8873E%03 4.4086E%03 9.4696E%03 1.9661E%02 4.0188E%02
– 1.22 1.10 1.05 1.03
The code validation work is performed comparing the numerical results to the experimental data. The Bartolomei experimental data (Bartolomei et al., 1982; Bartolomei and Chanturiya, 1967) of subcooled flow boiling in vertical pipes have been chosen for the purpose of validation. These experiments covered a wide range of conditions: (1) pressure from 1.5 to 15 MPa, (2) mass flux from 405 to 2123 kg/(m2s), (3) wall heat flux from 0.38 to 2.21 MW/m2,
Table 2 Simulation cases based on experimental conditions (Bartolomei et al., 1982; Bartolomei and Chanturiya, 1967). Case**
P (MPa)
Mass flux (kg/m2-s)
Wall heat flux (MW/m2)
Tinlet (K)
DTsub,inlet (K)!
Notes
1 2 3 4 5 6 7 8 9 10 11 12 13 14 15 16 17 18 19 20 21 22 23 24 25 26 27 28 29 30 31
6.89 6.78 6.84 6.84 6.81 6.89 6.84 6.74 7.01 14.79 14.74 14.75 14.7 14.99 6.89 6.89 6.79 11.02 10.81 10.81 10.84 3.01 4.41 14.68 6.81 1.5 3.0 4.5 1.5 3.0 4.5
985 1071 961 995 998 965 961 988 996 1878 1847 2123 2014 2012 405 1467 2024 503 966 1554 1959 990 994 1000 2037 900 900 900 900 900 900
1.13 1.13 1.13 1.15 0.44 0.78 1.13 1.7 1.98 0.42 0.77 1.13 1.72 2.21 0.79 0.77 0.78 0.99 1.13 1.16 1.13 0.98 0.9 1.13 1.13 0.38 0.38 0.38 0.78 0.78 0.78
464 465 465 466 521 493 466 416 434 603 598 583 545 563 421 519 520 494 502 563 563 445 463 533 504 448.47* 481.55* 506.14* 419.07* 452.98* 476.16*
94.04 91.96 92.55 91.55 36.25 65.04 91.55 140.58 125.24 11.26 16.00 31.06 68.79 52.37 137.01 39.06 37.10 97.43 88.01 27.05 27.26 62.49 66.55 80.65 53.30 23.47 25.75 24.66 52.89 54.32 54.64
Fig. Fig. Fig. Fig. Fig. Fig. Fig. Fig. Fig. Fig. Fig. Fig. Fig. Fig. Fig. Fig. Fig. Fig. Fig. Fig. Fig. Fig. Fig. Fig. Fig. Fig. Fig. Fig. Fig. Fig. Fig.
1, row 1, Bartolomei et al. (1982) 1, row 2, Bartolomei et al. (1982) 1, row 3, Bartolomei et al. (1982) 1, row 4, Bartolomei et al. (1982) 2(a), row 1, Bartolomei et al. (1982) 2(a), row 2, Bartolomei et al. (1982) 2(a), row 3, Bartolomei et al. (1982) 2(a), row 4, Bartolomei et al. (1982) 2(a), row 5, Bartolomei et al. (1982) 2(b), row 1, Bartolomei et al. (1982) 2(b), row 2, Bartolomei et al. (1982) 2(b), row 3, Bartolomei et al., 1982 2(b), row 4, Bartolomei et al., 1982 2(b), row 5, Bartolomei et al. (1982) 3(a), row 1, Bartolomei et al. (1982) 3(a), row 3, Bartolomei et al. (1982) 3(a), row 4, Bartolomei et al. (1982) 3(b), row 1, Bartolomei et al. (1982) 3(b), row 2, Bartolomei et al. (1982) 3(b), row 3, Bartolomei et al. (1982) 3(b), row 4, Bartolomei et al. (1982) 4(a), row 1, Bartolomei et al. (1982) 4(a), row 2, Bartolomei et al. (1982) 4(a), row 5, Bartolomei et al. (1982) 4(b) row 1, Bartolomei et al. (1982) 5(a), row 1, Bartolomei and Chanturiya (1967) 5(a), row 2, Bartolomei and Chanturiya (1967) 5(a), row 3, Bartolomei and Chanturiya (1967) 5(b), row 1, Bartolomei and Chanturiya (1967) 5(b), row 2, Bartolomei and Chanturiya (1967) 5(b), row 3, Bartolomei and Chanturiya (1967)
Based on the inlet quality data from Larsen and Tong, 1969. Case 1–25, vertical round pipe, pipe length = 1.5 m, pipe I.D. = 0.012 m Case 26–31, vertical round pipe, pipe length = 2.0 m, pipe I.D. = 0.024 m. ! The inlet subcooling levels are calculated from the inlet pressure, which is not available in the references and were obtained from numerical results. These values are presented for purpose of references only, and they should not be used as ‘known’ experimental conditions. *
**
L. Zou et al. / Annals of Nuclear Energy 87 (2016) 707–719
713
Table 3 Mean absolute error (MAE) of void fraction, ea, between numerical results and experimental data. Case
ea
Case
ea
Case
ea
Case
ea
1 2 3 4 5 6 7 8
0.020 0.069 0.048 0.040 0.011 0.050 0.045 0.030
9 10 11 12 13 14 15 16
0.015 0.023 0.014 0.022 0.021 0.032 0.096 0.037
17 18 19 20 21 22 23 24
0.032 0.062 0.041 0.056 0.027 0.012 0.036 0.072
25 26 27 28 29 30 31 –
0.032 0.053 0.030 0.020 0.093 0.042 0.041 –
(4) inlet subcooling level from 11 to 137 K!, and (5) maximum outlet void fraction up to 0.6. A summary of all experimental conditions of the Bartolomei experimental data is presented in Table 2. It is noted that the Bartolomei experimental data (Bartolomei et al., 1982; Bartolomei and Chanturiya, 1967) only provide experimental measurements on void fraction distribution along the pipe length. All experimental data of void fraction were plotted against the local equilibrium quality. Measured void fraction data uncertainties were also discussed in Bartolomei and et al. (1982), in which it was stated that the maximum absolute errors of the void fraction measurements do not exceed ±0.04. For all the simulation cases, 20 finite volume cells are used. A typical time step of 10%1 s, and 40 time steps are used in transient simulations, at the end of which the steady-state solutions could be obtained. Steady-state results are obtained in the order of 1 s of computer (wall) time (with 2.5 GHz Intel Core i7 CPU). In this work, experimental data of void fraction are used for code validation. Numerical results of void fraction are plotted against local equilibrium quality, and they are compared with experimental data. In order to quantitatively estimate the error between numerical results and experimental data, the mean absolute error (MAE) is used. The mean absolute error of the void fraction between the numerical results and experimental measurements is defined as,
ea ¼
N 1X janum;i % aexp;i j N i¼0
ð40Þ
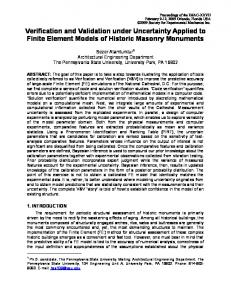
in which, subscripts ‘num’ and ‘exp’ denote for numerical results and experimental data, respectively. Interpolation of numerical results is used when necessary. N is the total data number in the two-phase region. It is noted that the single-phase region data are excluded from the error analysis for two reasons. Firstly, only trivial errors of void fraction exist in this region. If these trivial errors were to be considered, the mean absolute error would be underestimated with bias. Secondly, many of the nonphysical measurement data, i.e., negative void fraction values should not be used for error analysis. Mean absolute errors for all cases are summarized in Table 3. Overall, a good agreement was found between numerical results and experimental data. For most of cases, the MAE is within or close to the maximum absolute measurement error, 0.04. The discrepancies of other cases will be discussed later in this subsection. The comparisons are also visually presented in Fig. 2 through Fig. 10. Fig. 2 shows four cases with similar pressure, mass flux, wall heat flux, and subcooling. As explained in the original paper (Bartolomei et al., 1982), the scattering of the experimental data could be resulted from the measurement errors of operational parameters, as well as the inaccuracy of maintaining them. This could also be due to the stochastic nature of the two-phase flow phenomenon. As it can be seen in Fig. 2, the spreading of the !
See the footnote of Table 2.
Fig. 2. Comparisons between numerical results and experimental measurements, Group 1. EXP denotes for experiments; NUM denotes for numerical results. (The same for all the following figures.)
Fig. 3. Comparisons between numerical results and experimental measurements, Group 2.
experimental results for the four cases is much larger than the spreading of simulation results. Such a difference, scattering in data vs. non-scattering in simulation results, suggests the drawback of the commonly used deterministic thermal–hydraulics codes, which do not normally consider the uncertainties of the phenomenon. Detailed discussions on the remaining groups of data are provided as following. Fig. 3 shows cases with similar pressure (around 7 MPa) and mass flux but with increasing wall heat flux
714
L. Zou et al. / Annals of Nuclear Energy 87 (2016) 707–719
Fig. 4. Comparisons between numerical results and experimental measurements, Group 3.
Fig. 6. Comparisons between numerical results and experimental measurements, Group 5.
Fig. 5. Comparisons between numerical results and experimental measurements, Group 4.
Fig. 7. Comparisons between numerical results and experimental measurements, Group 6.
and inlet subcooling. The model simulation correctly captured the effects of varying wall heat flux and subcooling. Fig. 4 shows cases with similar pressure (around 15 MPa) and mass flux but with increasing wall heat flux and inlet subcooling. Fig. 5 shows cases with similar pressure (around 7 MPa) but with different mass flux and inlet subcooling. Fig. 6 shows cases with similar pressure (around 11 MPa) but with different mass flux and inlet subcooling. Fig. 7 shows cases with similar mass flux (around 1000 kg/m2-s) but with different pressure. Fig. 8 shows cases with the same wall
heat flux (1.13 MW/m2) and mass flux (around 2000 kg/m2-s) but with different pressure and inlet subcooling. Figs. 9 and 10 show two groups of low pressure (1.5–4.5 MPa) cases with the same mass flux (900 kg/m2-s). Cases in Fig. 9 have lower wall heat flux (0.38 MW/m2) and inlet subcooling than cases in Fig. 10 (0.78 MW/m2). It can be observed that the numerical results agree very well with the experimental data in general, with a few exceptions (Cases 15, 18, 24, 26, and 29 for example). The cases showing larger discrepancy between the experimental data and the
L. Zou et al. / Annals of Nuclear Energy 87 (2016) 707–719
715
simulation results can be categorized into two groups. Cases 15, 18, and 24 have large sub cooling and low mass flux. Cases 26 and 29 have very low pressure. For Cases 15, 18, and 24, although the model predicts that the inception of subcooled boiling is lagged compared to experimental data, the slope of the void fraction still agrees well with experimental data. This suggests that the model predictions could be further improved by using a better model to capture the onset of nucleate boiling (e.g., a modified Saha-Zuber model as used in Talebi’s work (Talebi et al., 2012). However, for Cases 26 and 29, the possible sources of discrepancies between model predictions and experimental results are not clear. 4.3. Comparison to RELAP5-3D
Fig. 8. Comparisons between numerical results and experimental measurements, Group 7.
The RELAP5-3D (RELAP5-3D, 2012a) code has been developed as a best-estimate reactor system analysis code. It has gained worldwide success in supporting reactor safety analyses, as well as design and licensing of new reactors. It employs a two-fluid two-phase flow six-equation system, including one continuity, one momentum and one energy equation for each phase (liquid and gas). In terms of spatial discretization, the RELAP5-3D code uses the similar staggered grid upwind method as that used in this work. In terms of time integration scheme, the RELAP5-3D code employs a semi-implicit method. As discussed in Section 2, the drift flux model itself is not a complete system, and many constitutive correlations have been adapted from the existing system
Fig. 9. Comparisons between numerical results and experimental measurements, Group 8.
Fig. 10. Comparisons between numerical results and experimental measurements, Group 9.
716
L. Zou et al. / Annals of Nuclear Energy 87 (2016) 707–719
Fig. 11. Comparisons between numerical results and RELAP5 results, Cases 5, 7, and 9. RELAP5 denotes for the numerical results obtained from RELAP5-3D. (The same for the following figures.)
Fig. 12. Comparisons between numerical results and RELAP5 results, Cases 6 and 8.
analysis code (such as RELAP5-3D) to close the system. In this subsection, the numerical results from this work and from RELAP5-3D are compared for several cases, as shown in Figs. 11–14. It can be observed that the RELAP5-3D code gives slightly better results in the low void fraction region; however, it tends to over-predict at the larger void region. Nevertheless, the numerical results obtained in this work are fairly close to those obtained from the RELAP5-3D code. This is somewhat expected as several key constitutive correlations used in this work, such as the Saha-Zuber model and flow
Fig. 13. Comparisons between numerical results and RELAP5 results, Cases 18 and 20.
regime maps, are identical to those used in RELAP5-3D. The good agreements between this work and the RELAP5-3D results further validate the correct implementation of the physical models and numerical methods used in this work. It is also worth pointing out that, in RELAP5-3D, for the purpose of numerical stability, a width of 0.05 in void fraction is used for the transition between the slug and annular mist flow regimes. In this work, this transition region was reduced to 0.01, and the JFNK method still showed very good numerical stability. As pointed out by Levy (Levy, 1999), p. 131], ‘‘to avoid sudden changes in flow regime that may be deleterious to numerical stability, transition regions covering a span Da of at least 0.1 are included in computer system codes and that required computational flexibility overshadows any accuracy that might be derived from more exact flow regime maps.’’ The excellent numerical stability demonstrated in this work, even with a much smaller transition region (0.01 compared to 0.05), shows that the JFNK method is a promising numerical method to reduce numerical errors related to the flow regime transitions. It is expected that similar treatment could be used to solve the two fluid six-equation two-phase flow equations, which will be investigated in our future work. Additional numerical results comparisons between this work and the RELAP5-3D code are also provided in terms of phasic velocities and flow regimes, for two representative cases, Case 9 and 19. Figs. 15 and 17 show the flow regimes along the pipe length predicted in this work and from RELAP5-3D. In both cases, predicted flow regimes agree with each other pretty well with only one mismatch. For case 9, onset of nucleate boiling lag one cell predicted in this work compared to that predicted using RELAP5-3D. For case 19, flow regime in the last cell is predicted as transition between slug and annular mist flow, while annular mist flow is predicted in RELAP5-3D. Figs. 16 and 18 show the phasic velocities between numerical results obtained in this work and those from RELAP5-3D predictions. The overall trends are similar, however a major noticeable difference can be found in the region where boiling starts, between numerical results obtained using drift flux model and from RELAP5-3D. In this region, local vapor phase velocities
L. Zou et al. / Annals of Nuclear Energy 87 (2016) 707–719
717
Fig. 16. Phasic velocities, comparisons between numerical results and RELAP5 results, Case 9. Fig. 14. Comparisons between numerical results and RELAP5 results, Cases 19 and 21.
predicted using Ishii’s model (this work) are larger than local liquid phase velocities. On the contrary, RELAP5-3D code predicts that the local vapor phase velocities are smaller than the local liquid phase velocities. Such a difference is mainly due to the different drift flux models used in RELAP5-3D and in this work, i.e., Ishii’s model. In RELAP5-3D, EPRI drift flux model (RELAP5-3D, 2012a; Chexal and Lellouche, 1986) is used to estimate the interfacial drag in the vertical bubbly and slug flow regimes. EPRI drift flux model considers conditions when void concentrates near the wall as nucleate boiling takes place, and such that C0 < 1 (see Discussion on page 2–2 of
Chexal and Lellouche (1986)). Thus the vapor velocity is greatly affected by the liquid velocity near the wall region, which is much smaller than the liquid phase average velocity. This agrees well with Zuber’s original analysis (Zuber and Findlay, 1965), and the model gives reasonable prediction on vapor phase velocity (smaller than the liquid phase average velocity) in this region. However, for Ishii’s drift flux model used in this work, the value of C0 is *1.2, which is larger than 1. This seems to violate Zuber’s original concept. As a result, RELAP5-3D using EPRI drift flux model gives better results in almost all cases in this region. Another difference in the phase velocities profiles can be observed in regions where flow regime transits from one to another, which could be due to several
Fig. 15. Flow regimes, comparisons between numerical results and RELAP5 results, Case 9.
718
L. Zou et al. / Annals of Nuclear Energy 87 (2016) 707–719
Fig. 17. Flow regimes, comparisons between numerical results and RELAP5 results, Cases 19.
Fig. 18. Phasic velocities, comparisons between numerical results and RELAP5 results, Case 19.
possible reasons, e.g., a different drift flux model is used in RELAP5-3D code, different numerical treatments when flow regime transits, and different width of void fraction used for the slug to annular mist transition as discussed in the previous paragraph.
5. Conclusions We have successfully demonstrated the capability of applying the JFNK method to solve the two -phase four-equation drift flux model with the full coverage of all the flow regimes for vertical upward channels. To our best knowledge, this work represents
the first successful application of the JFNK method to solve two-phase flow models with realistic closure models. The staggered grid finite volume method and fully implicit backward Euler method was used for the spatial discretization and time integration schemes, respectively. Numerical verification was performed in the form of convergence study on mesh refinement, from which the expected order of convergence was obtained. Extensive code validation was performed comparing the numerical results to subcooled flow boiling experimental data in vertical pipes. For most simulation cases, the numerical results agree well with experimental data. Code-to-code comparison was also performed to verify the code implementation. Numerical results were compared to those obtained using RELAP5-3D, and good agreement between them was obtained. Differences of the numerical results using drift flux model and RELAP5-3D were also identified and discussed. The JFNK method is robust and efficient even without implementing the analytical Jacobian matrix, which is typically required for traditional Newton’s methods (Frepoli et al., 2003). The Jacobian-free feature yields significant savings in developing a fully implicit system analysis code. The work also demonstrates that flow regime transition is not a critical issue for convergence, although it was observed that time step size reduces for better convergence when flow regime transits. The required transition span for the new method can be much narrower than that required in traditional system codes. This can potentially result in improved simulation accuracy by using more exact flow regime maps. This work only represents the first attempt to apply the JFNK method in realistic two-phase flow simulations. Additional work on downward flow regimes and horizontal flow regimes is needed to complete the capability of the four-equation drift flux model to cover a wide range of applications. Extending this method to the six-equation two-fluid model will be performed in the near future. Acknowledgements This work is supported by the United States (U.S.) Department of Energy, under Department of Energy Idaho Operations Office
L. Zou et al. / Annals of Nuclear Energy 87 (2016) 707–719
Contract DE-AC07-05ID14517. Accordingly, the U.S. Government retains a nonexclusive, royalty-free license to publish or reproduce the published form of this contribution, or allow others to do so, for U.S. Government purposes. References Balay, S., et al., ‘‘PETSc Users Manual, Reversion 3.4’’, ANL-95/11 (2013). Bartolomei, G.G., Chanturiya, V.M., 1967. Experimental study of true void fraction when boiling subcooled water in vertical tubes. Therm. Eng. 14, 123–128. Bartolomei, G.G. et al., 1982. An experimental investigation of true volumetric vapor content with sub-cooled boiling in tubes. Therm. Eng. 29 (3), 132–135. Chexal, B. and Lellouche, G. A Full-Range Drift-Flux Correlation for Vertical Flows (Revision 1), EPRI NP-3989-SR, Electric Power Research Institute, September 1986. Chung, Y.J. et al., 2012. Development and assessment of system analysis code, TASS/ SMR for integral reactor, SMART. Nucl. Eng. Des. 244, 52–60. Chung, Y.J. et al., 2013. Applicability of TASS/SMR using drift flux model for SMART LOCA analysis. Nucl. Eng. Des. 262, 228–234. Frepoli, C., Mahaffy, J.H., Ohkawa, K., 2003. Notes on the implementation of a fullyimplicit numerical scheme for a two-phase three-field flow model. Nucl. Eng. Des. 225, 191–217. Galloway, J. D. 2010. Boiling Water Reactor Core Simulation with Generalized Isotopic Inventory Tracking for Actinide Management, PhD Dissertation, University of Tennessee, Knoxville. Gaston, D.R. et al., 2015. Physics-based multiscale coupling for full core nuclear reactor simulation. Ann. Nucl. Energy 84, 45–54. Hashemi-Tilehnoee, M., Rahgoshay, M., 2013a. Benchmarking a sub-channel program based on a drift-flux model with 8+8 NUPEC BWR rod bundle. Ann. Nucl. Energy 58, 202–212. Hashemi-Tilehnoee, M., Rahgoshay, M., 2013b. Sub-channel analysis of 8+8 and 9+9 BWR fuel assemblies with different two-phase flow model. Ann. Nucl. Energy 62, 264–268. Hibiki, T., Ishii, M., 2003. One-dimensional drift-flux model and constitutive equations for relative motion between phases in various two-phase flow regimes. Int. J. Heat Mass Transf. 46, 4935–4948. Hibiki, T., Ishii, M., 2005. Erratum to: One-dimensional drift-flux model and constitutive equations for relative motion between phases in various two-phase flow regimes. Int. J. Heat Mass Transf. 48, 1222–1223. Hirt C. W. et al., SOLA-LOOP: A Nonequillibrium, Drift-Flux Code for Two-Phase Flow in Networks, LA-7659, June (1979). Ishii, M., 1977. One-dimensional drift-flux model and constitutive equations for relative motion between phases in various two-phase flow regimes, ANL-77-47, USA. Ishii, M., Hibiki, T., 2011. Thermo-Fluid Dynamics of Two-Phase Flow, Second Edition. Springer. Khan, H.J., Yi, H.C., 1985. Subchannel analysis in BWR fuel bundles. Ann. Nucl. Energy 12 (10), 559–572.
719
Knoll, D.A., Keyes, D.E., 2004. Jacobian-free Newton–Krylov methods: a survey of approaches and applications. J. Comp. Phys. 193, 357–397. Larsen, P.S., Tong, L.S., 1969. Void fraction in subcooled flow boiling. J. Heat Transfer, 471–476. LeVeque, R.J., 2004. Finite-Volume Methods for Hyperbolic Problems. Cambridge University Press. Levy, S., 1999. Two-Phase Flow in Complex Systems. John Wiley & Sons, ISBN 0-47132967-3. Mousseau, V.A., 2004. Implicitly balanced solution of the two-phase flow equations coupled to nonlinear heat conduction. J. Comp. Phys. 200, 104–132. Mousseau, V.A., 2005. A fully implicit hybrid solution method for a two-phase thermal–hydraulic model. J. Heat Transfer 127, 531–539. Nayak, A.K., 2007. Study on the stability behaviour of two-phase natural circulation systems using a four-equation drift flux model. Nucl. Eng. Des. 237, 386–398. ‘‘RELAP5/MOD3.3 Code Manual Volume I’’, NUREG/CR-5535 ed., U.S. Nuclear Regulatory Commission, December, (2001). ‘‘RELAP5-3D Code Manual Volume I: Code Structure, System Models and Solution Methods’’, INEEL-EXT-98-00834, Revision 4.0, June (2012a). ‘‘RELAP5-3D Code Manual Volume IV: Models and Correlations’’, INEEL-EXT-9800834, Revision 4.0, June (2012b). RELAP-7 Level 2 Milestone Report: Demonstration of a Steady State Single Phase PWR Simulation with RELAP-7, INL/EXT-12-25924, May 2012, Idaho National Laboratory. RELAP-7 Theory Manual, INL/EXT-14-31366, February 2014, Idaho National Laboratory. ‘‘RETRAN-3D – A Program for Transient Thermal-Hydraulic Analysis of Complex Fluid Flow Systems: Volume 1: Theory and Numerics (Revision 3)’’, NP-7450V1R3, Electric Power Research Institute, October, (1998). Talebi, S., Kazeminejad, H., Davilu, H., 2012. A numerical technique for analysis of transient two-phase flow in a vertical tube using the drift flux model. Nucl. Eng. Des. 242, 316–322. The International Association for the Properties of Water and Steam, http://www. iapws.org. ‘‘TRACE V5.0 Theory Manual’’, ML120060218, U.S. Nuclear Regulatory Commission, June 4, (2010). Wang, J. et al., 2011. Numerical study of nuclear coupled two-phase flow instability in natural circulation system under low pressure and low quality. Nucl. Eng. Des. 241, 4972–4977. Zou L., et al., ‘‘C++ Implementation of IAPWS Water/Steam Properties’’, INL/EXT-1431502, February (2014). Zou, L., Zhao, H., Zhang, H., 2015a. Applications of high-resolution spatial discretization scheme and Jacobian-free Newton–Krylov method in two-phase flow problems. Ann. Nucl. Energy 83, 101–107. Zou, L., Zhao, H., Zhang, H., 2015b. On the analytical solutions and numerical verifications of the two-phase water faucet problem. In: 16th International Topical Meeting on Nuclear Reactor Thermalhydraulics, Augst 30 – September 4, Chicago, Illinois, USA. Zuber, N., Findlay, J.A., 1965. Average volumetric concentration in two-phase flow systems. J. Heat Transfer, 453–468.