12. The linearity of the results, when plotted on a semilogarithmic scale, suggest that the intensity decreases .... J. C. Hebden and R. A. Kruger, "Transillumination imaging .... Physics, Chemistry, Engineering, and Medicine, R. R. Alfano,.
Numerical method for studying the detectability of inclusions hidden in optically turbid tissue S. Haviin, J. E. Kiefer, B. Trus, G. H. Weiss, and R. Nossal
We introduce an efficient numerical method for studying the detectability of absorptive inclusions in a multiple-scattering optical medium. Use of the method is demonstrated by the forward calculation of integrated and time-gated photon intensities. Schemes for positioning the light source above an inclusion and otherwise determining the location of a hidden object, involving either reflected or transmitted reemissions, are discussed as examples. They are investigated for several illustrative models, and images are calculated as a function of the size and shape of the inclusion.
1. Introduction
Several research groups currently are developing methods that use low-energy photons to image biological tissues.1- 15 In this respect new optical and electronic technologies-particularly those involving timeresolved6 8-' 0 or frequency-domainl2 14 15 spectrophotometry-afford promising approaches to the problem of detecting inclusions that are hidden within optically turbid media. One goal is to create an imaging system to screen for breast tumors by using nonionizing visible or near-IR radiation. 2 '6 '8'0 "16-19 When a tissue sample is thin, time-resolved techniques can detect photons that travel through the tissue in straight, or nearly straight, paths. In this case tomographic methods can be used for image reconstruction. However, most biological samples of real interest are so thick that the number of such ballistic photons that reach a detector is small. Consequently practical imaging with optical sources probably will involve the detection of multiply scattered photons. Photon migration (random walk)2 0'21 or diffusion 2 2 -2 4 models are appropriate for describing the propagation of radiation in such cases. Mathematical difficulties encountered when the transport of light through optically turbid media is analyzed have inhibited the development of algorithms for solving the inverse problem of optical imaging in tissue, whereby measured intensities of reemitted photons would be used to infer unknown distributions of scatterers and absorbers. Alternative
schemes for obtaining information about complex tissue probably will involve sophisticated iterative comparisons of measured and computed intensities of reemitted photons. 3 25 26 One would obtain the computed values by solving the direct problem of determining intensities, given that the optical characteristics of the scattering medium are specified. Analytical solutions for tissue optics have been obtained in a limited number of cases involving simplified boundary conditions and idealized geometries,2 0 23 25 27 but investigations of spatially heterogeneous biological structures generally require the use of numerical methods. This paper illustrates the use of an efficient numerical algorithm for investigating questions related to the detection of absorptive inclusions hidden within a multiply scattering medium. The formalism, which we refer to as exact enumeration, has been applied previously to an examination of the effects of a superficial absorbing layer on photons reemitted from an underlying bulk material. 2 8 Here we consider a target of relatively small dimensions that is assumed to be buried beneath a surface on which photons are incident and whose absorption properties differ from those of the bulk medium. The calculation involves representing the media by a discrete lattice and evaluating site occupation probabilities as photons diffuse with time. The spacings between lattice sites can be interpreted as being integer multiples of the inverse of a transport-corrected scattering cross sec21 29 30
tion.
The authors are with the Division of Computer Research and Technology, National Institutes of Health, Bethesda, Maryland 20892.
Received 5 February 1992.
,
,
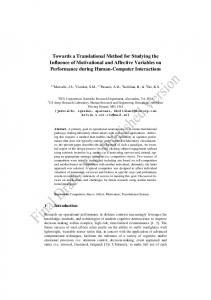
We have studied the system shown schematically in Fig. 1. Photons are injected through the upper face of an infinite slab of width 2 and are collected either at the upper or at the lower surface. A single inclusion, whose midplane is located at a distance h 1 February 1993 / Vol. 32, No. 4 / APPLIED OPTICS
617
Detector
t~
~~ ,ij' X.u.N,
Source
t
Xd Detector
Fig. 1. Cross-sectional view of an infinite slab of thickness Y containing a cubic inclusion of size 13. The absorption per unit scattering length in the slab is pLl,and in the inclusion it is .2. Both surfaces are considered to be totally absorbing. (Al photons escape from the slab at the boundaries.)
units below the top of the slab, lies with its center displaced by (-x, -ys) units from the point where the photons are inserted. The absorption coefficient per unit scattering length of the medium constituting the slab is p, while that of the inclusion is 112. Since here we are primarily interested in studying the effects of absorptive inclusions, the scattering lengths in both regions are considered to be identical. For illustration Fig. 1 specifically shows the inclusion to be an x 1 x I cube. However, we also discuss inclusions that have the form of cylindrical rings of inner radius R1, outer radius R 2, and length W; in several cases we set R, = 0, in which case the object is a simple cylinder. (Note that, when the axis of such an object and the direction of injection of the photons are collinear, the analysis essentially becomes that of a two-dimensional problem.) We also examine a structure that mimics an optically porous target, which we model in terms of a percolation lattice.3 ' We do so because the anomalous optical profiles of breast tumors are believed to arise from excess vascularization,16-' 9 which, for present purposes, we assume to be adequately represented by an amorphous, statistically disordered structure. Because detected photons frequently constitute only a small fraction of the number of incident photons, Monte Carlo simulations often prove to be of limited utility when photon-imaging problems are analyzed. In such cases the computing time needed to obtain statistically meaningful Monte Carlo results can become prohibitively long, so that the exact enumeration method is particularly advantageous. In Section 2 we describe the algorithm used for such exact enumeration, which yields the probability that a photon will occupy a given site on a discrete lattice after n steps. This method of enumerating probabilities is equivalent to performing Monte Carlo calculations for movement on the lattice, but, by use of this algorithm, all random-walk configurations are taken into account properly. Thus, even when only a few
photons would reach a site as realizations of Monte 618
APPLIED OPTICS / Vol. 32, No. 4 / 1 February 1993
Carlo experiments (for example, if the photons moved over long paths), the procedure of exact enumeration yields their expected site occupation probability exactly. Admittedly one advantage of Monte Carlo methods over exact enumeration is that the simulations in general do not constrain motion to a discrete set of fixed points. Hence they can account for randomscattering lengths and anisotropic-angular-scattering probability in a straightforward manner. However, recently it has been explicitly demonstrated that, by the use of appropriate scaling relations, results obtained for an equivalent isotropic-scattering lattice can be expressed in terms of parameters related to anisotropic scattering in a continuum. 3 0 A short commentary on the relationships between lattice and continuum models and a discussion of the particular physical parameters used in this investigation are presented in Section 3. Section 4 contains results related to the possibility of enhancing the detection of an inclusion by the time-gating photons emerging from a tissue when an instantaneous pulse is applied. Various modalities involving either backreflected or transmitted photons are discussed. We find, for example, that when an assembly containing a closely spaced source and detector is moved across an object that contains an inclusion, a pronounced dip in the backreflected signal may be detectable depending on the difference in absorptivities. In Section 5 several calculations are discussed in which the symmetry of cylindrical objects is used to reduce the amount of computation. These are applied to studies that indicate how intensities vary with the size, shape, and depth of the inclusion, and we also show that the mean transit time (t), (or the average path length) for photons reemitted at a point can be readily calculated. In Section 6 we present results obtained from inclusions that are representative of disordered structures, and Section 7 contains a short discussion. Mathematical analyses of tissue scattering usually emphasize either the time-resolved intensity at a given point on a surface or the total integrated intensity as a function of optical fiber (optode) spacing. One novel aspect of our calculations is that the time-resolved behavior of extended spatial intensity patterns is shown, where the latter are calculated as the fraction of reemitted photons obtained within a defined time window encompassing a given delay time. We find, for example, that an optimum delay time exists for visualizing the shape of an object, which may be different from the shortest gating time associated with quasiballistic photons. Another interesting result is that computations for both uniform and disordered objects indicate qualitatively similar exponential dependences between transmitted intensities and the total absorptive mass. However, the principal purpose of this paper is to demonstrate the utility of the exact enumeration method; various specific applications await further development, which will be discussed in later publications.
2.
Method of Exact Enumeration
The procedure of exact enumeration employed in this paper is an iterative method that accounts for the spatial and temporal distribution of photons after a discrete pulse is applied to a scattering medium. By using this scheme,3 2 one can easily calculate by recursion from the probability at step n - 1 the probability p(r, n) that a photon is at site r at time step n. The method replaces the optical continuum by a discrete lattice of scattering sites and permits one to evaluate the photon density that results when transitions occur at integer time steps. We determine p(r, n) in terms of the probabilities prior to a transition according to
p(r, n) = p(r, n
-
)exp[- I(r)]
+ Y Wr+,ibrp(r + a, n - 1)exp[-
(r + a)]
(a)
-Wr-r+ap(r,
n -
)exp[- (r)]},
(1)
where Wrir' represents the probability that a photon moves from site r to site r' in one transition step, and pgr) is the absorption per unit step. The sum {al is over all z nearest-neighbor sites (which for the case of present interest, a cubic lattice, totals six). In the calculations discussed here, Wr-r and J1(r) are assumed to be equal to the constant values wl and pl, if r signifies a point within the slab other than at the inclusion, and are taken to be the constant values w2 and 112 for sites lying within the inclusion (see Fig. 1). Here we set w, = W2 = 1/z, which corresponds to the assumption that the scattering lengths in both regions are identical. (In certain cases one can account for unequal scattering lengths by adding a waiting state to the transitions in one of the regions by choosing zwi to be < 1 in that region.) The probability that a photon, traveling solely within medium i between two sites, reaches the neighboring site during a transition is taken by Beer's law to be exp(- ,ui). We have ignored possible complications at the boundaries by adopting the convention that the probabilities are multiplied by the factors appropriate to the regions {i }occupied by the photons before the transitions. We take the interfaces (top and bottom surfaces) between the scattering medium and the external milieu to be totally absorbing, which we account for by assuming p(r, n) to be zero for sites at those boundaries. We can account for refraction at the external surfaces, or at the boundaries of the inclusion, by modifying the transition probabilities at those points. The numerical technique can be applied to inclusions of arbitrary geometry, but some structural details might be lost if the mesh size is too large. Hence in this paper we consider a subset of problems that are particularly amenable to our computational methodology and that can serve as examples for qualitative investigations. In a similar spirit the diameter of the incident beam is considered to be small compared with the mean scattering length, and
the first scattering of photons after they are injected into the tissue is taken to occur at a site lying one unit below the surface. (Generalizations of both of these conditions are incorporated easily.) Note that in the following we often use the symbol t to signify the number of steps (time transitions) of the random walk; i.e., for convenience t and n are used interchangeably. As discussed in Section 3, there is a simple proportionality between the number of steps and the elapsed physical time. 3. Physical Parameters Scattering in tissue is strongly directed in the forward angular direction18 33 [g (cos 0) 0.90-0.985]. However, if appropriately modified cross sections are used, scattering can be taken as being isotropically directed with equal probabilities in all directions.3 0 Hence, for a spatially homogeneous scattering medium, each lattice point can be thought of as being separated from its neighbor by an equivalent distance L' = 1/ I,% where Z,' is a transport-corrected bulkscattering coefficient (in inverse centimeters). Although actual scattering lengths (the inverse of the intrinsic scattering cross sections) probably are of the order of 100 pm or less in tissue, transport-corrected scattering lengths L' typically are measured to be of the order of a few millimeters. 8 3 3 3 4 An ability to define such equivalent transport coefficients underlies the use of isotropic diffusion theories in tissue optics. 2 0- 24 The value of ES' depends on tissue type and the wavelength of the probe radiation. In the calculations described in this paper the thickness of the slab (Y in Fig. 1) is taken to be 30 (Section 4) or 50 (Sections 5 and 6) scattering lengths. Hence the model tissue is of the order of several centimeters thick. To a first approximation the time spent by a photon as it traverses a tissue is directly proportional to its path length. In terms of the number of steps n on the equivalent lattice, the elapsed time can be expressed at t = KnL'/CT where CT = 0.23 mm/ps is taken to be the speed of light within the tissue and K is a function of g whose value is close to one.30 For example, when n = 100 and L 1 mm, we find that t 400 ps. Typical measured transit times of photons that cross3 1035 or are backscattered from 4 36 complex tissue structures, when the source and detector are separated by distances of the order of a few centimeters, are between 0.2 and 10 ns. It is quite difficult to establish accurate values of transport coefficients for intact tissues, and the characteristics of excised samples can differ markedly from in situ properties. In terms of equivalent scattering and absorption coefficients, the equivalent absorption coefficient per unit equivalent scattering length p. can be expressed as3 0 p. = Ka'/s', where K is the factor mentioned in the previous paragraph. Values of p. for both noncancerous and cancerous tissues vary strongly with wavelength.18 For normal breast adipose and glandular tissues, p seems to lie within the range of 0.0025-0.01 when Xis between 1 February 1993 / Vol. 32, No. 4 / APPLIED OPTICS
619
500 and 1100 nm.18 Ductal carcinoma also seems to have values of ,u lying between 0.0025 and 0.01 but with a different dependence on wavelength; for example, at X = 550 nm, p. in cancerous tissue is approximately twice that of normal tissue. Additionally fibrocytic tissue is characterized by values of p. in the range of - 0.0003-0.002, and, at wavelengths in the near-IR, the ratio of p. in cancerous and fibrocytic tissue seems to be 8. In accordance with Fig. 1 the dimensionless absorption coefficient of the material within the inclusion is taken to be P.2 and that elsewhere within the slab as pu1. For illustrative purposes we usually take the ratio of the absorption coefficients to be 5, with the individual values taken as P.2 = 0.05 and p, = 0.01.
1.0
620
APPLIED OPTICS / Vol. 32, No. 4 / 1 February 1993
& a
0
0.9
n A
,1R
0
A
o
0
o
a
a
0
0.8
0.7 0 ,:tc a
a
0.6 a 0.5 I -20
-10
0
I 20
10
x
(a)
4. Time-Gated Intensities
The easiest and least costly way to use light to probe the optical properties of tissue is to measure the total, time-integrated intensity of the radiation that is reemitted at a surface. Unfortunately, although information about hidden optical inclusions is contained in the spatial distributions of such light, the high degree of multiple scattering destroys the correlation between incident and detected light intensities. Recently it has been demonstrated experimentally that images of optically absorptive phantoms can be sharpened by time gating the photons that emerge from transilluminated objects. 6 9.10 A streak camera has been used to integrate, for variable periods of time, the populations of photons that are emitted after a picosecond pulse of laser light is applied to a scattering medium containing an absorbing target. 6 9 Shortening the period over which photons are detected improves the spatial resolution of the images formed from transmitted light. Similarly, when an ultrafast optical Kerr gate is used to isolate a portion of a time-resolved transmitted pulse, images of absorptive phantoms hidden behind, or within, highly scattering materials are enhanced.1 0 The opening of the Kerr gate can be delayed so that the range of time over which light is detected is changed; thus the relative amounts of near-ballistic and diffusely scattered photons can be varied. Measurements indicate that images are sharpened when short delay times and small time windows are used, i.e., when the number of near-ballistic photons as a portion of the total signal is increased. In this section we show the results of calculations performed on the model shown in Fig. 1. The object to be detected is a cube of size 13, hidden within a slab of thickness Y, which here is taken to be 30 scattering lengths. The center of the cube lies h units below the upper surface of the slab, and the projection of the center of the cube onto the surfaces is taken as the origin (0, 0) of the surface coordinates. The positions of the source (x, ys) and detector (Xd, yd) are computed with respect to that origin. The detector can be located either on the same side or on the opposite side as the source, and the horizontal distance between the source and detector is designated
t
1.0 0
0.8
A
A
a
a
0
0
0
0
0.6 -
0
A
A
a
a
0
0
0.4 C 0.2 -20
-10
0
10
20
Xs
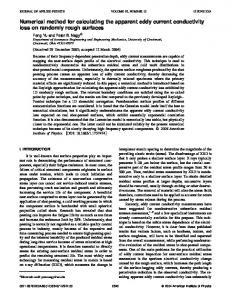
(b) Fig. 2. Normalized time-gated intensities as a function of the distance x8 between the source and the projected center of a 9 x 9 x 9 cubic inclusion. The source is moved along the axis ye = 0, and the detector is assumed to be always located near the source (i.e., p = 0). The time-gated intensity here is the total number of photons captured by the detector within an interval At about t,where At = -50 andt= 200 (A), 300(0), and 500 (E) steps. The ordinate shows the intensity I(0, t-) at x, divided by the corresponding time-gated intensity at x = , I°(0, T). The cube is positioned at the center of the slab. (a) Reflected intensities IR (, T)/IRO(O, ) detected at the top surface. (b) Transmitted intensities IT(O, t)/II 0 (O,T)detected at the bottom surface. as p = [(xs - Xd) 2 + (
- yd)2 ]1/ 2 .
We calculate vari-
ous quantities related to the function I(p, t), which is proportional to the number of photons detected at distance p at time t. In these calculations the x, y dimensions of the slab were taken to be ±30, which is twice the thickness of the slab. We mitigated the effects of this finite size approximation by imposing periodic boundary conditions, so that photons that exit at one end during the calculation were distributed into the slab at the other end. For the computation results shown in Figs. 2-4, the cube had dimensions of 9 x 9 x 9 and was positioned in the center of the slab (h = 15). When the calculations resulting in Fig. 2 were performed, the source and detector were situated close to each other while they were moved along the axis ys = 0. We calculated a quantity, referred to as (0, t), that represents the number of photons arriving at the detector during a time window ± At. Both the re-
1 e-
8e-
4
the reflected signal IR(O, t)/IRO(0, t) appears to increase as t increases. [The symbols I(0, t), I(0, ), IR(0, t), IT(, t), ... are defined again in Appendix A.] The detector and source do not-need to be moved simultaneously for us to obtain evidence of the inclu-
_-
5
0 a
0 U,
03
a
6e-5]
sion. a
a
a
A
A
2e-5! -20
A A
-1 0
0
10
20
Xs
Fig. 3. I(t), the time-gated intensities ( = 500) summed over the upper (O) or lower (A) surface as a function of the position of the sourcex 8 (Y 8 = 0).
flected [Fig. 2(a)] and transmitted [Fig. 2(b)] intensities [IR(O, t) and IT(O, t), respectively] were computed for values of t and At taken as t = 200, 300, and 500 and At = ±50. Note that for each a pronounced dip can be seen as the source-detector assembly is moved over the inclusion. (In transmission the source and detector can be thought of as being coaxial.) We normalized the data shown in Fig. 2 by dividing the time-gated intensity at point x, by the corresponding signal I(0, ) detected far from the inclusion (that which would be discerned if the inclusion were absent). When represented in this way, the relative change in
a
0 U)-1
-30
-20
-10
0
10
20
(a)
(b) Fig. 4. Reflected time-gated intensities when the source is fixed but the detector position xd is variable ( = 500, At = +50, x = 10). (a) Intensity profile IR(P, t= 500) as the detector is moved along the line Yd = 0. (The source position x8 = 10, y = 0). (b) Detected intensities summed over the entire top plane IR(t = 500) (source positions x, = 10, y, = 0).
Figure 3 shows results for t = 500 (At =
50)
for the case where the time-gated signal is integrated over all positions on a surface. We refer to such data as I(i). Note that dips in the reflected and transmitted intensities still are quite prominent. Figure 4 shows the spatial distribution IR(P, t) for a case where the source is fixed and the detector position is varied. In this case one observes shape anisotropy in the intensity because the source is situated away from the projected center of the cube (where the inclusion is located). 5.
Cylindrical Inclusions
We now discuss several situations where the source is taken to be collinear with the axis of a cylindrically symmetric inclusion (xs = 0, y, = 0). Because of the radial symmetry, the dimensionality of the calculations is decreased to D = 2, which makes it possible for us to implement a scheme that accelerates the computations. 2 8 Various questions regarding the way that the depth and size of the hidden object might affect its detectability are considered. The objects studied in this section are cylinders of rotation. We first consider a circular cylinder of radius R and length W, whose center is located h units below the surface at which the photons are inserted (the top surface; see Fig. 1). Figure 5 shows how the time-integrated transmitted intensity (that detected at the bottom of the slab) varies with the depth h of the inclusion. In Fig. 5(a) we show the intensity summed over the entire surface I7tot as a function of h. The pronounced break in the line as the center of the object passes through the midpoint of the slab is even clearer in the data shown in Fig. 5(b), where IT(O), which is the intensity opposite the source [at the point p = (Xd 2 + yd2 )1/2 = 0; see Fig. 1], is indicated. The near symmetry of the latter curve can be explained by the fact that the object partially shields both the source and the detector in an equivalent manner, so that the maximum intensity occurs when the inclusion is positioned at the center of the slab at h = Y/2, where the shielding is minimal. That IT(O) is greatest when the object is located at the midplane seems to confirm a result obtained from Monte Carlo simulations, which implies that the resolution is poorest when the object is so situated.3 7 Figure 6(a) shows IT(p), the time-integrated intensity as a function of the radial position of the detector p. If data are taken in this manner, the shape discrimination may be achieved with transmitted photons when objects are located close to the bottom face, whereas objects located above the midplane are not as readily defined. The hump in IT(p) that is seen when the object is positioned close to the detector at the bottom surface (h = 42.5) is not visible in the other images. Figure 6(b) is a plot of the value p* at which 1 February 1993 / Vol. 32, No. 4 / APPLIED OPTICS
621
-
0
10
20
h
30
p
(a)
(a)
35e-9!-
.0e'9r
I-
0
!.5e-91 I'
.
13 0
0 .5e-1~~~~~~~
I
0
10
20
30
40
50
h (b) Fig. 5. Time-integrated intensity as the depth h of a cylindrical inclusion (R = 10, W = 5) is varied. (Here as well as for Figs. 6-10 we take 5 = 50 and the outer boundary of the slab to be a ring whose radius is 50 units of mean-free-scattering length.) The source is positioned collinearly with the axis of the hidden object, i.e., x5 = 0, ya = 0 (see Fig. 1). (a) Total intensity summed over the entire bottom plane I7TPt. (The intensity without inclusion is 1.86 x 10⁻⁶.) (b) Intensity IT(O) at the point opposite that of the source (i.e., Xd = 0, iyd = 0; see Fig. 1). [Without inclusion, IT(O) = 1.06 x 10⁻⁸].
equals 95% of the value of the corresponding curve when the inclusion is absent [i.e., Iy(p*)/ITO(p*) = 0.95; see the Fig. 6(b) caption]. Note that the function p*(h) varies inversely with the depth of the inclusion (i.e., P*0.95 1/h), which is consistent with the notion that the inclusion casts a shadow given by the relationship p*/IR/h. Figure 7(a) shows IT(P) calculated for various values of radius R for a cylinder of constant length (W = 5) whose center is located at the midplane (h = 25). Figure 7(b) shows analogous curves when the radius is kept constant (R = 10) but the cylinder length W is changed. No distinctive features, from which one might estimate shape, are apparent in the plotted curves of IT(p). However, there may be parameters that can be derived from these curves that bear a simple relationship to the mass of the inclusion. Figure 8(a) shows how the transmitted time-integrated intensity at the axis IT(O) varies with W, and Fig. 8(b) shows analogous behavior of the time-gated signal IT(t) that has been summed over the entire bottom plane (for t = 100, At = +50). In both cases there is an exponential, or near-exponential, dependence on W, given as I exp(-aW) where the IT(P)
622
APPLIED OPTICS / Vol. 32, No. 4 / 1 February 1993
,
0.02
0
0.03
0
0.04
0
0.05
.
0.06
.
0.07
.
0.08
1/h (b) Fig. 6. Dependence of the transmitted time-integrated intensity IT(p) on the detector position p as a function of the depth at which a cylindrical inclusion (R = 10, W =5) is situated. (a)IT(p) versus p for h = 7.5, 22.5, 42.5. The dashed curve ITO(p) is the corresponding curve obtained in the absence of an inclusion. (b) The source-detector distance p at which the curve IT(p) equals 95% of the value of ITO(p) is plotted as a function of 1/h. (The source is positioned collinearly with the axis of the object.)
dependence of a on the parameters of the system are yet to be determined. The sensitivity of the detected signals to the shape of the inclusion can be enhanced by time gating the emitted signals. Figure 9(a) shows as an example the spatial dependence of the transmitted intensity measured over the period t ± At when the inclusion is positioned near the bottom of the slab. A comparison with the data shown in Fig. 6(a) indicates that the features in the time-integrated intensity that relate to the shape of the inclusion arise from intermediate and long path-length photons rather than from the early time, or near-ballistic, photons. This at first may seem to be at variance with the results of experimental studies performed on absorbing phantoms, 9"l0 but the latter utilized almost totally absorbing targets (embedded in a weakly absorbing scattering medium), whereas here the inclusion transmits a significant fraction of the incident photons. Figure 9(b) shows for reflected photons the dependence on h of the signal reemitted at the top plane at p = 10. In this case we need long pathway signals to exhibit the presence of the inclusion, and intensities measured with different time delays are sensitive to targets lying at different depths; deeper inclusions are
1.2e- -8
10
.
-8
8
1.0e- -
8.0e-'6.0e-9 i
ao 10
EF
4.0e-9!-
10
1,
2.0e-9r
I
0.0
inv
10
20
.10
0
30
10
p ,-8_
1.Oe -8 8.0e 2-
2.0e
0 6*
-9,
1
I =1
6.0e 4.0e
30
(a)
(a) 1.2e
20 W
W-3 -9 -9
"
0
5
I i F-
9
-9
13
0.1
0. 0
10
20
0
30
10
20
30
w p
(b) Fig. 7. Time-integrated intensities as a function of the detector location for a cylinder located at the midplane of the slab. (a) The variation of IT(p) as the radius R of the inclusion is changed (W= 5). (b) The variation of IT(p) as the length W is changed (R = 10). The dashed curves show Ir(p)[see the Fig. 6(a) caption]. (The source is positioned collinearly with the axis of the object.)
detectable only when time gates with longer delays are employed. The mean transit time required to reach a surface at point p, (t )p,which can be a sensitive measure of the change in absorptivity 21' 38 and which in certain limits is detected by frequency-modulated instrumentation,3 9'40 can be obtained according to
(t), =It ti(p, t I Et i(p, t).
(2)
The signal (t)p often contains many of the features seen in other measures of the intensity. In Fig. 10(a), for example, we show the mean time of photon reemission for reflection measurements from the same object, made at the point p = 10; we see that the dependence on h resembles that shown by the data in Fig. 9(b). Similarly, in Fig. 10(b) we show (t), for photons transmitted across the slab to a coaxial detector, and a strong resemblance to the behavior seen in Fig. 5(b) is noted. Recent experimental studies indeed indicate that measurements of (t), are sensitively dependent on absorber positions.4 1 The image from an inhomogeneous, partially transmitting object also can be enhanced by time gating. In Fig. 11 we show the intensities obtained from a hollow cylinder (inside radius R, = 5, outside radius
(b) Fig. 8. Dependence of integrated transmitted intensities on changes in the length of the inclusion W (R = 10, Y = 50, h = 25). (a) Time-integrated intensity IT(O) measured at a point that is collinear with the source (p = 0). (b) Time-grated intensity IT(t = 100) summed over the bottom face of the slab (At = +50). [Here the intensity has been divided by ITO(i = 100), which is the corresponding signal detected in the absence of the inclusion.]
10, length W = 5), positioned with its center at 42.5 [see Figs. 6(a) and 9(a)]. Here too the structural features that are evident in the timeintegrated signal [Fig. 11(a)] are much more pronounced at intermediate and long times [Figs. 11(c) and 11(d)]. R2= h =
6. Disordered Targets The vascular elements of a tumor, which may contribute disproportionally to an image that depends on hemoglobin absorptivity, are hard to describe with precision. Also a heterogeneous spatial distribution of the blood vessels can make the target appear to be somewhat porous to photons. For these reasons it may be appropriate and useful to characterize the inclusion in terms of a noncompact structure whose properties are statistical rather than deterministic. Therefore we introduce here the use of percolation clusters 3 ' to represent the hidden entity. The density of occupied sites contained within the cluster and its overall mass can be specified. For these studies we grew the clusters in three dimensions from a seed located at the center of the slab. A nearest-neighbor site was added to the cluster with probability p and blocked (left with the properties of the background slab) with probability (1 - p). We chose a value of 1 February 1993 / Vol. 32, No. 4 / APPLIED OPTICS
623
10 "11
Z1u-al 0
10-12 10 .13
a
0
03
80 t - 1200
10
.14
10
15
10
.16
A
I.
V
t-200
in -17
60-
.H
0
10
20
30
70-
40
0
10
20
30
p
(a) 530A
50
(a)
1.2
1.0
40
h
A 6
0
E
0
a
.
a
0
a
5208
0.8
A
E3
A
0.6 -
E 0
1
510-
V
0.4 5000.2A
0
0.0
490
I
0
10
20
30
40
0
50
h (b) Fig. 9. Effects of time gating on detectability (solid cylindrical inclusion: R = 10, W = 5). (a) Transmitted intensity IT(P, t) for = 200, 600, 1200, At =
50 for h = 42.5.
(b) Normalized
reflected intensity IR(p, ) measured at the top face (the data divided by the values at large h are equivalent to detection at large p) at p = 10 for = 200 (A), 600 (0), 1200 (), At = +50, shown as a function of the depth of the hidden object. (The source is positioned coaxially with the inclusion.)
p = 0.6, which is well above the critical value p = pc =
0.311. (This percolation structure certainly is not to be taken literally as a model of a tumor, which, among other things, most likely is more heavily vascularized at its periphery than at its center.) The time-integrated transmitted intensity summed over the bottom surface ITtot and the time-integrated intensity at p = 0 opposite the source IT(O) were calculated as a function of the number of sites incorporated into the cluster s The averaged data from 10 random clusters of each size are shown in Fig. 12. The linearity of the results, when plotted on a semilogarithmic scale, suggest that the intensity decreases exponentially with the number of sites in the inclusion, i.e., ITtt=
A exp(-as),
IT(O) = B exp(-bs),
b > a.
(3)
We see that the intensity at p = 0 [Fig. 12(a)] more sensitively depends on the size of the inclusion than does the total intensity [Fig. 12(b)]. This can be explained by the fact that, to reach the center, many photons pass through the absorbing cluster; however, the total summed intensity also includes a large number of photons whose paths are peripheral to the 624
o
0
APPLIED OPTICS / Vol. 32, No. 4 / 1 February 1993
10
20
30
40
50
h (b) Fig. 10. Mean transit time (t)p for photon reemission. (a) Photons reflected to the top plane, p = 10 [see Fig. 9(b)]. (b) Transmitted photons, p = 0 [see Fig. 5(b)]. Abscissa h is the distance from the top of the slab to the center of the inclusion.
inclusion. The interesting point is that, like the results shown in Fig. 8(b), both quantities depend exponentially on the cluster size. 7.
Discussion
The work described in this paper was motivated by a desire to develop efficient ways to analyze photon propagation in multiple-scattering media. We found that the method of exact enumeration is a good way to investigate qualitatively the distributions resulting from photon transport in complex systems that contain absorptive inclusions. Time-resolved and static distributions can be calculated with equal facility. Despite the preliminary nature of this investigation, some intrinsically interesting conclusions can be drawn. For example, Fig. 2 indicates that the particular choice of a time-gated interval strongly affects the pattern of detected backreflected intensities. The latter depend sensitively on the depth of the hidden object, and the results shown in Fig. 2(a) demonstrate that deep inclusions are best shown up by appropriate time-delayed diffusive photons rather than prompt, almost ballistic signals. We also see that the approximate position of the center of the inclusion can be determined from symmetry considerations of the reflected or the transmitted signal. Although the detection of an inclusion might be enhanced by the use of a protocol in which various delay times and time gates are tried in succession, it is
10 4 10 10 6-
10 '11
10-13 13
100
S
200
300
p
400
500
600
400
500
600
S
(a)
(a) l o -67 10 '
0
104
-
10 0
10
20
30
N100
200
300 S
p
(b) Fig. 12. Time-integrated transmitted intensities through a slab containing a disordered target modeled by a percolation cluster, given as a function of the cluster size (mass) s. (a) Intensity IT(O) at p = 0. (b) Intensity ITtot summed over the entire bottom surface.
(b) 1.2e-11
0 0 CD
0
10
20
S.L1 Z:,
30
40
p
(c
0
II I.
20
40
p (d) Fig. 11. Transmitted intensities of photons passing through a scattering medium containing a hollow cylinder (R1 = 5, R2 = 10) of length W = 5 located h = 42.5 units below the surface. The input beam is collinear with the axis of the cylinder. (a) Timeintegrated intensity IT(p) as a function of the detector position p. (b) Time-gated intensity IT(P, t = 200). (c)Time-gated intensity IT(P, = 600). (d) Time-gated intensity IT(p, 7 = 1200). For (b)-(d) the time window was taken to be At = +50.
clear that it will probably be difficult to resolve the precise structure of a hidden object. Yet, if the photon source can be positioned above the center of the inclusion, time gating may increase one's ability to discern detail. However, the data in Fig. 11 imply that, when choosing a time gate for the purposes of enhancing resolution, one needs to pay careful attention to obtaining a sufficient number of detectable photons; too few photons may make it impossible to extract a meaningful signal from instrumental and background noise (note the scales on the ordinates in Figs. 11). Questions of this nature, e.g., the optimization of the time window At, can be investigated by the use of an exact enumeration for calculating transmitted and backscattered intensities. As indicated in Fig. 10, related computations yield the mean time of flight (t)p, a quantity that has attributes that are similar to those of time-gated intensities. One advantage of these computational methods is that they are adapted easily to investigations of the properties of media that contain irregularly shaped structures. The objects may be statistical, rather than deterministic, entities. Such an object might be the vascular bed of a tissue. We have illustrated this case by examining an inclusion represented by a percolation cluster and have shown that the transmission of photons through media containing such a body depends primarily on the mass of the inclusion 1 February 1993 / Vol. 32, No. 4 / APPLIED OPTICS
625
(see Figs. 8 and 12). Hence the light seemingly can be used to monitor changes in vascularization, even if one has only incomplete knowledge of tissue morphology. The expressions in Eq. (3) can be the starting point to an understanding of how the coefficients appearing in those empirical relationships depend on the optical parameters of the tissue. We still must systematically examine how the contrast between the inclusion and the background (the ratio p2/ [1) affects one's ability to discern tissue inhomogeneities. Similarly we also need to investigate how the absolute values of the bulk-tissue parameters, Ya and (1 - g)Y5 , might limit one's ability to register a meaningful number of photons and how the detection and characterization of specific targets might be made more difficult if other objects and heterogeneities are present in the scattering medium. (A combination of deterministic and statistical inclusions might constitute a good model for the latter study.) Finally we note that direct enumeration can be used to investigate algorithms that profitably employ various combinations of scattered signals, each providing complementary information about the size and density of a hidden object. Appendix A IR(P, t), IT(p, t) are the time-resolved (time-gated) intensities, where p is the horizontal distance between the source and detector and t is the time. (The subscripts R and T refer, respectively, to reflected and transmitted intensities.) IR(P, ), IT(p, t) are the time-resolved intensities, summed over the time interval t + At, where At is generally taken to be 50 steps. IRO(P, 0), ITO(P, t) are the time-resolved intensities that would be observed if the inclusion were absent. IR(P), IT(P) are the diffuse spatial (time-integrated) intensities, which we obtained from the time-resolved intensities by summing over all time. IR(O), IT(O) are the time-integrated intensities when p = 0. IR(t), IT(i) are the time-dependent diffuse intensities, which we obtain from time-resolved intensities by summing over all values of p and summing over the time interval t ± At. IRO(P), ITO(P), IRO(t), ITO) are spatial or timedependent intensities that would be observed if the inclusion were absent. IRt0t, ITt1t are total diffuse intensities (summed over the area and integrated over all time). (t)pR, (t)pT are the mean transit time for photons reemerging at a point whose horizontal distance between the source and detector is p units. Superscripts R and T refer, respectively, to the reflected and transmitted photons. References 1. S. R. Arridge, M. Cope P. van der Zee, P. J. Hillson, and D. T. Delpy, "Visualization of the oxygenation state of brain and muscle in newborn infants by near infra-red transillumination," in Information Processing in Medical Imaging, S. L. Bacharach, ed. (Nijhoff, Boston, Mass., 1986), pp. 155-176. 626
APPLIED OPTICS / Vol. 32, No. 4 / 1 February 1993
2. P. C. Jackson, P. H. Stevens, J. H. Smith, D. Kear, H. Key, and P. N. T. Wells, "The development of a system for transillumination computer tomography," Br. J. Radiol. 60, 375-380 (1987). 3. D. T. Delpy, M. Cope, P. van de Zee, S. Arridge, S. Wray, and J. Wyatt, "Estimation of optical pathlength through tissue from direct time of flight measurement," Phys. Med. Biol. 33, 1433-1442 (1988). 4. B. Chance, J. S. Leigh, H. Miyake, D. S. Smith, S. Nioka, R. Greenfeld, M. Finander, K. Kaufmann, W. Levy, M. Yound, P. Cohen, H. Yoshioka, and R. Boretsky, "Comparison of timeresolved and -unresolved measurements of deoxyhemoglobin in brain," Proc. Natl. Acad. Sci. USA 85, 4971-4975 (1988). 5. K. G. Spears, J. Serafin, N. H. Abramson, X. Zhu, and H. Bjelkhagen, "Chrono-coherent imaging for medicine," IEEE Trans. Biomed. Eng. 36, 1210-1221 (1989). 6. J. C. Hebden and R. A. Kruger, "Transillumination imaging performance: a time-of-flight imaging system," Med. Phys. 17,351-356 (1990). 7. J. R. Singer, F. A. GrUnbaum, P. Kohn, and J. P. Zubelli, "Image reconstruction of the interior of bodies that diffuse radiation," Science 248, 990-993 (1990). 8. S. Andersson-Eagles, R. Berg, S. Svanberg, and 0. Jarlman, "Time-resolved transillumination for medical diagnostics," Opt. Lett, 15, 1179-1181 (1990). 9. J. C. Hebden, R. A. Kruger, and K. S. Wong, "Time resolved imaging through a highly scattering medium," Appl. Opt. 30, 788-794(1991). 10. L. Wang, P. P. Ho, C. Liu, G. Zhang, and R. R. Alfano, "Ballistic 2-D imaging through scattering walls using an ultrafast optical Kerr gate," Science 253, 769-771 (1991). 11. Y. Yamada and Y. Hasegawa, "Simulation of time-resolved optical-CT imaging," in Time-Resolved Spectroscopy and Imaging of Tissues, B. Chance, ed., Proc. Soc. Photo-Opt. Instrum. Eng. 1431, 73-82 (1991). 12. K. W. Berndt and J. R. Lakowicz, "Detection and localization of absorbers in scattering media using frequency-domain principles," in Time-Resolved Spectroscopy and Imaging of Tissues, B. Chance, ed., Proc. Soc. Photo-Opt Instrum. Eng. 1431, 149-160 (1991). 13. R. L. Barbour, H. L. Graber, R. Aronson, and J. Lubowsky, "Imaging of subsurface regions of random media by remote sensing," in Time-Resolved Spectrocopy and Imaging of Tissues, B. Chance, ed., Proc. Soc. Photo-Opt. Instrum. Eng. 1431, 192-203 (1991). 14. J. B. Fishkin and E. Gratton, "Propagation of photon density waves in strongly scattering media containing an absorbing semi-infinite plane bounded by a straight edge," J. Opt. Soc. Am. A 9, in press. 15. A. Knfittle, J. M. Schmitt, and J. R. Knutson, "Spatial localization of absorbing bodies by interfering diffusive photon density waves," Appl. Opt. 32, 381-410 (1993). 16. D. J. Watmough, "Transillumination of breast tissues: factors governing optimal imaging of tissues," Radiology 147, 89-92 (1983). 17. A. E. Profio, G. A. Navarro, and 0. W. Satorius, "Scientific basis of breast diaphanography," Med. Phys. 16, 60-65 (1989). 18. V. G. Peters, D. R. Wyman, M. S. Patterson, and G. L. Frank, "Optical properties of normal and diseased human breast tissues in the visible and near infrared," Phys. Med. Biol. 35, 1317-1334(1990). 19. H. Key, E. R. Davies, P. C. Hackson, and P. T. Wells, "Optical attenuation characteristics of breast tissues at visible and near-infrared wavelengths," Phys. Med. Biol. 36, 579-590 (1991). 20. R. Bonner, R. Nossal, S. Havlin, and G. H. Weiss, "Model for photon migration in turbid biological tissue," J. Opt. Soc. Am. A 4, 423-432 (1987).
21. R. Nossal, R. F. Bonner, and G. H. Weiss, "The influence of path length on remote optical sensing of properties of biological tissue," Appl. Opt. 28, 2238-2244 (1989). 22. A. Ishimaru, "Theory and application of wave propagation and scattering in random media," Proc. IEEE 65, 1030-1061 (1977). 23. J. M. Steinke and A. P. Shepherd, "Diffusion model of the optical absorbance of whole blood," J. Opt. Soc. Am. 5, 813-822 (1988). 24. M. Patterson, B. Chance, and B. C. Wilson, "Time resolved reflectance and transmittance for the noninvasive measurement of tissue optical properties," Appl. Opt. 28, 2331-2336 (1989). 25. S. R. Arridge, P. van der Zee, M. Cope, and D. T. Delpy, "Reconstruction methods for infra-red absorption imaging," in Time-Resolved Spectroscopy and Imaging of Tissues, B. Chance, ed., Proc. Soc. Photo-Opt. Instrum. Eng. 1431, 204215 (1991) 26. F. A. Grfinbaum, P. Kohn, G. A. Latham, J. R. Singer, and J. P. Zubelli, "Diffuse tomography," in Time-Resolved Spectroscopy and Imaging of Tissues, B. Chance, ed., Proc. Soc. Photo-Opt. Instrum. Eng. 1431, 232-238 (1991). 27. H. Taitelbaum, S. Havlin, and G. H. Weiss, "An approximate theory of photon migration in a two-layer medium," Appl. Opt. 28, 2245-2249 (1989); D. Ben-Avraham, H. Taitelbaum, and G. H. Weiss, "Boundary conditions for a model of photon migration in a turbid medium," Lasers Life Sci. 4, 29-36 (1991). 28. R. Nossal, J. Kiefer, G. H. Weiss, R. Bonner, H. Taitelbaum, and S. Havlin, "Photon migration in layered media," Appl. Opt. 27,3382-3391 (1988). 29. A. H. Gandjbakhche, R. F. Bonner, and R. Nossal, "Scaling relationships for anisotropic random walks," J. Stat. Phys. 69, 35-53 (1992). 30. A. H. Gandjbakhche, R. Nossal, and R. F. Bonner, "Scaling relationships for theories of anisotropic random walks applied to tissue optics," Appl. Opt. 32, 504-516 (1993). 31. D. Stauffer, Introduction to Percolation Theory (Taylor & Francis, London, 1985). 32. S. Havlin and D. Ben Avraham, "Diffusion in disordered media," Adv. Phys. 36, 695-798 (1987); A. Bunde and S.
Havlin, eds., Fractals and Disordered Systems (SpringerVerlag, Berlin, 1991), Vol. 1. 33. S. T. Flock, B. C. Wilson, and M. S. Patterson, "Total attenuation coefficients and scattering phase functions of tissues and phantom materials at 633 nm," Med. Phys. 14, 835-841 (1987). 34. I. Driver, C. P. Lowdell, and D. V. Ash, "In vivo measurement of the optical interaction coefficients of human tumors at 630 nm," Phys. Med. Biol. 36, 805-813 (1991). 35. R. Berg, S. Andersson-Engels, 0. Jarlman, and S. Svanberg, "Time-resolved transillumination for medical diagnostics," in Time-Resolved Spectroscopy and Imaging of Tissues, B. Chance, ed., Proc. Soc. Photo-Opt Instrum. Eng. 1431, 110119 (1991). 36. M. Ferrari, R. A. De Blasi, P. Bruscaglioni, M. Barilli, L. Carraresi, M. Gurioli, E. Quaglia, and G. Zaccanti, "Near infrared time-resolved spectroscopy and fast scanning spectrophotometry in ischemic human forearm," in Time-Resolved Spectroscopy and Imaging of Tissues, B. Chance, ed., Proc. Soc. Photo-Opt. Instrum. Eng. 1431, 276-283 (1991). 37. J. C. Hebden and R. A. Kruger, "Transillumination imaging performance: spatial resolution simulation studies," Med Phys. 17, 41-47 (1990). 38. R. Nossal and R. F. Bonner, "Differential time-resolved detection of absorbance changes in composite structures, in TimeResolved Spectroscopy andImaging of Tissues, B. Chance, ed., Proc. Soc. Photo-Opt. Instrum. Eng. 1431, 21-28 (1991). 39. J. R. Lakowicz and K. Berndt, "Frequency-domain measurements of photon migration in tissues," Chem. Phys. Lett. 166, 246-252 (1990). 40. J. Fishkin, E. Gratton, M. J. vandeVen and W. W. Mantulin, "Diffusion of intensity modulated near-infrared light in turbid media," in Time-Resolved Spectrocopy and Imaging of Tissues, B. Chance, ed., Proc. Soc. Photo-Opt. Instrum. Eng. 1431, 122-135 (1991). 41. E. M. Sevick, N. G. Wang, and B. Chance, "Time-dependent photon imaging," in Recent Advances in the Uses of Light in Physics, Chemistry, Engineering,and Medicine, R. R. Alfano, ed., Proc. Soc. Photo-Opt. Instrum. Eng. 1599, 273-283 (1991).
1 February 1993 / Vol. 32, No. 4 / APPLIED OPTICS
627