Numerical Modeling of Stress in Stenotic Arteries With Microcalcifications: A Micromechanical Approximation Jonathan F. Wenk1 e-mail:
[email protected]
Panayiotis Papadopoulos Tarek I. Zohdi Department of Mechanical Engineering, University of California, Berkeley, 6141 Etcheverry Hall, Mail Code 1740, Berkeley, CA 94720-1740
Most finite element models of atherosclerotic arteries do not account for the heterogeneity of the plaque constituents at the microscale. Failure of plaque lesions has been shown to be a local event, linked to stress concentrations caused by cap thinning, inflammation, macroscopic heterogeneity, and recently, the presence of microcalcifications. There is growing evidence that microcalcifications exist in the fibrous cap of plaque lesions. However, their role is not yet fully understood. The goal of the present work is to investigate the effects of localized regions of microcalcifications on the stress field of atherosclerotic plaque caps in a section of carotid artery. This is achieved by performing finite element simulations of three-dimensional fluid-structure interaction models. The material response in the region of microcalcification is modeled using a combination of finite elements, homogenization theory, and a stress concentration function that approximates the average local stresses in the fibrous tissue and microcalcification phases. The results indicate that the circumferential stress in the fibrous tissue phase increases as the volume fraction of microcalcifications is increased, and that the stress exceeds a critical threshold when the fibrous cap thickness is decreased. Furthermore, the presence of the microcalcifications significantly influences the distribution of stress by shifting the maximum circumferential stress away from the cap shoulders, where failure is most common when the effective region of microcalcification is located at the center of the cap. This is a possible explanation of why 40% of plaque ruptures occur away from the shoulder region of the cap. 关DOI: 10.1115/1.4001351兴 Keywords: fibrous cap, microcalcifications, stress concentration, finite elements
1
Introduction
Atherosclerosis is one of the most prevalent forms of vascular disease. Vulnerable regions of atherosclerotic plaque may rupture without warning, leading to potentially fatal results, such as myocardial infarction or stroke. In fact, atherosclerosis is the leading cause of death in the United States and could become the leading cause of death in the industrialized world by the year 2020 关1兴. Although the mechanisms that cause atherosclerotic plaques to rupture are not fully understood, there has been much focus in the literature on the role of high stress concentration. Factors such as reduced structural integrity due to material degradation or heterogeneities could play a key role in the initiation of failure. As plaque expands into the lumen, causing the artery to become occluded by forming the characteristic lipid pool, the shear stress on the proximal side of the lesion increases. This can lead to a high concentration of inflammatory cells in the proximal region 关2,3兴. The degradation of extracellular matrix components, such as collagen and smooth muscle cells, has been linked to the family of metalloproteinases and can lead to thinning of the fibrous cap 关4,5兴. According to several case studies, failure of the fibrous cap occurs most frequently on the proximal side of the plaque lesion as well as at the shoulders 关2,3,6兴. It has been stated in the literature that roughly 60% of plaques rupture near the shoulder region of the fibrous cap 关7兴. The remaining 40% of failures occur at other regions, including the center of the cap 关8,9兴. 1 Corresponding author. Contributed by the Bioengineering Division of ASME for publication in the JOURNAL OF BIOMECHANICAL ENGINEERING. Manuscript received October 30, 2009; final manuscript received January 24, 2010; accepted manuscript posted February 25, 2010; published online September 1, 2010. Editor: Michael Sacks.
Journal of Biomechanical Engineering
The presence of calcium also appears to have an important role in the evolution of atherosclerosis. There is evidence that inflammation may be linked to the development of calcification 关10,7兴. Studies have also shown that the calcium permeability of the arterial wall increases in the presence of lipid particles 关11–13兴. Initially, calcium develops in the form of both intracellular and extracellular granules. Over time, these granules can either coalesce into large deposits or remain as dispersed collections of microcalcifications that form in the arterial wall 关14兴. Due to the low-resolution of imaging techniques in the past, there were no reliable means of viewing these microcalcifications 关15,16兴. Only recently have new imaging techniques been able to detect the presence of microcalcifications in and around the fibrous cap of plaque lesions 关9,17,18兴. Chemical analysis has shown that the microcalcifications possess a chemical composition that consists primarily of hydroxyapatite 共calcium phosphate兲 关19,18兴, which is a crystalline mineral deposit. In the last few years, more attention has been given to the presence of microcalcifications in the fibrous cap. Vengrenyuk et al. 关9兴 used high-resolution micro-CT to view cellular size microcalcifications 共5 – 10 m兲 in the fibrous cap of coronary arteries. The authors suggest that the microcalcifications form from macrophages that have calcified within the fibrous cap. In addition, an analytical formulation for the stress concentration around a single calcified inclusion was developed using linear elasticity theory. Bobryshev et al. 关18兴 used electron microscopy along with X-ray elemental analysis to view calcified matrix vesicles 共90–300 nm兲 in the fibrous cap of diseased carotid arteries. Their analysis was conducted on both stable and vulnerable plaque caps. Plaque caps that were less than 100 m thick were considered vulnerable.
Copyright © 2010 by ASME
SEPTEMBER 2010, Vol. 132 / 091011-1
Downloaded 07 Jan 2011 to 128.32.164.52. Redistribution subject to ASME license or copyright; see http://www.asme.org/terms/Terms_Use.cfm
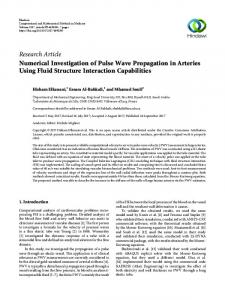
Fig. 1 Three-dimensional view of the full section of stenotic artery with a close-up view of the effective region of microcalcification and lipid pool, which are outlined and indicated with the arrows
Calcified matrix vesicles have also been considered as initiators of microcalcification in atherosclerotic plaques 关18,20兴. In general, stress concentrations are dependent on both the geometry and the material properties of the lesion and surrounding tissue. Humphrey 关21兴 provided an extensive review of constitutive laws and material parameters for several types of arteries. Holzapfel et al. 关22兴 performed experiments on samples of diseased tissue in order to assess the failure stress of the tissue components in the circumferential and longitudinal directions. In this study, the circumferential stress in fibrous tissue was predicted to be critical to plaque rupture. Loree et al. 关23兴 performed uniaxial tests on strips of atherosclerotic tissue, including “calcified” tissue, which was classified by Lee et al. 关24兴 as fibrous tissue containing granules of calcium. The study by Loree et al. revealed the stiffening effect of calcifications in tissue. The use of fluid-structure interaction 共FSI兲 modeling has become more prevalent in recent years in an attempt to better understand the role of blood flow in the failure of plaque lesions. Tang and co-workers 关25–27兴 used MRI to generate threedimensional patient-specific FSI models in order to locate the maximum stress in a diseased carotid artery. Some of these models included large calcium deposits near the plaque, which were found to have little effect on plaque vulnerability. Bluestein et al. 关28兴 used simplified three-dimensional geometry and FSI finite element models to analyze the influence of a single microcalcification embedded in the center of the fibrous cap. This was done for two model configurations, both with a thin fibrous cap but different levels of stenosis. The stress around the embedded inclusion was found to increase relative to the noncalcified case. Li et al. 关29兴 performed a sensitivity study on a simple two-dimensional longitudinal cross-section model using FSI simulations. In this case, the focus was on the effects of cap thickness and stenosis severity on the magnitude of stress in the plaque cap itself with the artery walls modeled as rigid. As a follow up to their original work, Vengrenyuk et al. 关30兴 performed a finite element analysis on a model of patient-specific 091011-2 / Vol. 132, SEPTEMBER 2010
geometry with three microcalcifications in the cap. The analysis was performed using a linearly elastic material model and a uniform pressure applied to the lumenal wall of the artery. The stress around the inclusions was found to increase significantly when the cap thickness was decreased while the position of the three inclusions was fixed. Two-dimensional cross-section models have also been used to study the effects of lipid pools and large calcium deposits on the stress in the artery wall 关31–33兴, using several imaging techniques. The goal of the present work is to assess the influence of microcalcifications on the state of stress in the fibrous cap of atherosclerotic plaque lesions. This is accomplished by using a one-way multiscale approach. Three-dimensional FSI finite element models are employed to estimate the stress field in the region of microcalcifications. The presence of microcalcifications is modeled as a local region represented with a “homogenized” effective material response, rather than geometrically modeling individual cellular sized inclusions.2 Stress concentration functions, derived from the micromechanical Hashin–Shtrikman bounds 关36,37兴, are used to find the average circumferential stress in each of the constituent phases at a point of interest in the microcalcified region. The average circumferential stress is then compared with a critical failure stress in order to assess the potential of debonding.
2
Methods
2.1 Model Geometry. The geometry of a stenotic section of carotid artery was generated based on measurements taken from Refs. 关38,39兴. According to Virmani et al. 关40兴, the majority of vulnerable plaques are eccentric and contain a diameter stenosis greater than 50%. Therefore, the baseline model of the artery contained an eccentric occlusion with a 50% diameter stenosis 共Fig. 2 Effective material responses have been used in the modeling of various biological materials, see Refs. 关34,35兴.
Transactions of the ASME
Downloaded 07 Jan 2011 to 128.32.164.52. Redistribution subject to ASME license or copyright; see http://www.asme.org/terms/Terms_Use.cfm
Fig. 2 Circumferential cross-section view of the stenosis with: „a… center region of microcalcification and „b… shoulder region of microcalcification. Asterisk indicates the region of microcalcification.
1兲.The geometry was assumed to be symmetric in order to reduce the memory requirements during simulation. It was shown in Refs. 关2,6兴 that factors such as cell migration and macrophage concentration can influence the development of the plaque, producing a thin cap on the proximal side of the stenosis and a thicker cap on the distal side. The shape of the lipid pool and longitudinal variation in cap thickness were based on these observations 共Figs. 2 and 3兲. In the current study, fibrous cap thicknesses of 83 m and 150 m were analyzed in two separate models. The basic dimensions of the occluded artery model are given in Table 1. Rather than geometrically modeling the microcalcified particles, which are 5 – 10 m in size, a specific region of the fibrous cap was described by an effective material response, using micromechanical homogenization theory. The effective region of microcalcification was generated by intersecting a cylinder of radius
0.45 mm with the geometry of the fibrous cap. A conceptual schematic of the intersection is shown in Fig. 4. This cylindrical intersection region was parallel to the Y-axis and embedded in the fibrous cap, as shown in Fig. 2. The longitudinal position of the cylindrical region was 26 mm from the inlet on the proximal side of the cap, as indicated by the asterisk in Fig. 3. Two regions of microcalcification were examined in this study, one in the center of the cap 共Fig. 2共a兲兲 and the other was shifted 0.7 mm 共XS兲 from the center to the shoulder of the cap 共Fig. 2共b兲兲. 2.2 Governing Equations and Boundary Conditions. The deformation of the artery wall was modeled using the equilibrium equations.
Fig. 3 Close-up view of the longitudinal cross-section of the stenosis. Asterisk indicates the region of microcalcification. Table 1 Dimensions of the key geometric features of the occluded artery model Geometric Feature Inlet diameter 共ID兲 Stenosis throat diameter 共STD兲 Wall thickness 共WT兲 Lipid pool length 共LPL兲 Lipid pool height 共LPH兲 Lipid pool angle 共LPA兲 Total vessel length Vessel length proximal to stenosis Stenosis length Vessel length distal to stenosis
Journal of Biomechanical Engineering
Dimension 5 mm 2.5 mm 1.2 mm 5.0 mm 2.65 mm 60 deg 85 mm 20 mm 15 mm 50 mm
Fig. 4 „a… Cylinder intersecting with thin plate and „b… final intersection region embedded in the middle of the thin plate
SEPTEMBER 2010, Vol. 132 / 091011-3
Downloaded 07 Jan 2011 to 128.32.164.52. Redistribution subject to ASME license or copyright; see http://www.asme.org/terms/Terms_Use.cfm
Div P = 0
共1兲
Table 2 Material properties of the fibrous tissue and lipid pool
The first Piola–Kirchhoff stress P can be written in terms of a strain energy function W = W共C兲 per unit reference volume P = 2F
W C
共2兲
where F is the deformation gradient and C is the right Cauchy– Green deformation tensor. The strain energy function and material parameters of the solid model are discussed in the next section. The blood flow was modeled using the arbitrary Lagrangian– Eulerian 共ALE兲 formulation of the Navier–Stokes equations for an incompressible, Newtonian, homogeneous, viscous fluid undergoing steady flow. The ALE formulation was necessary to capture shape changes to the flow field due to the deformation of the artery wall and plaque cap. The governing equations are given as
共共v − vg兲 · ⵜ兲v = ⵜ · 共− pI + 共ⵜv + 共ⵜv兲T兲兲
共3a兲
ⵜ·v=0
共3b兲
where v is the velocity of the blood, vg is the velocity of the mesh, and p is the pressure. The density of the blood was = 1060 kg/ m3 and the dynamic viscosity was = 0.0035 Pa s 关41兴. In each simulation, the steady-state solution was computed for nominal physiological conditions using the commercial finite element software COMSOL® 共COMSOL 3.4, COMSOL Inc., Stockholm, Sweden兲. The inlet boundary of the fluid field was assumed to be fully developed laminar flow. This was enforced with a parabolic profile and a centerline velocity of vc = 0.3 m / s. The outlet pressure was taken to be po = 100 mm Hg, which is the mean of a normal cardiac cycle. The pressure was assigned such that p = p o,
共ⵜv + 共ⵜv兲T兲nout = 0
共4兲
where nout was the unit normal to the outlet boundary crosssection. The second part of the condition assumes that the viscous effects vanish normal to the outlet boundary, which allowed the pressure to be assigned directly. This was a fair assumption given that the length of the vessel, after the stenosis, was 10 times the inlet diameter. The symmetry condition of the fluid field was enforced with a slip boundary condition given by v · nsym = 0,
tisym · 共− pI + 共ⵜv + 共ⵜv兲T兲兲nsym = 0
共5兲
where nsym was the unit normal and tsym 共i = 1 , 2兲 were the tangent i vectors to the symmetry plane. The constraints on the boundaries of the artery wall 共solid domain兲 allowed it to expand freely in the radial and circumferential directions but restrict it from expanding in the longitudinal direction. This was accomplished by fixing the displacement in the Z-direction at the inlet and outlet, fixing the displacement in the X-direction at the symmetry plane, and fixing the displacement at two points in the Y-direction on the outer surface of the artery. The FSI methodology used in COMSOL® employs a two-way 共strong兲 coupling scheme at the interface of the fluid and solid domains. The fluid exerts a force on the solid domain while the deformation of the solid affects the geometry of the fluid domain. The interface boundary condition was implemented by adding Lagrange multipliers as additional dependent variables in the finite element formulation on the constrained domain. This ensured that there was no penetration of the fluid into the wall and that there was no slip of the fluid relative to the wall. The global system of equations was then solved monolithically. 2.3 Material Representation. The material response of the fibrous tissue and lipid pool were modeled using the isotropic hyperelastic strain energy function 091011-4 / Vol. 132, SEPTEMBER 2010
Fibrous tissue Lipid pool
D1 共Pa兲
D2
共kPa兲
5105.3 50
13 5
3300.0 12.5
共6兲
where ¯IC = ICJ−2/3 is the deviatoric first invariant of C and J = det共F兲 is the Jacobian of the deformation gradient. The deviatoric contribution includes a Fung-like exponential term for which the material properties are given in Table 2 关33兴. Since all nonlinearly elastic constitutive laws must reduce to a Hookean material in the infinitesimal limit, the shear modulus of the fibrous tissue was found to be = 2D1D2. The bulk moduli of the fibrous tissue and lipid pool were based on a nearly incompressible response and are given in Table 2. The second Piola–Kirchhoff stress S is related to the first Piola– Kirchhoff stress by P = FS and can be written as S=2
Wdev Wvol −1 + JC = S⬘ + pJC−1 C J
共7兲
where S⬘ is the deviatoric stress and p is the pressure. p=
Wvol = 共J − 1兲 J
共8兲
The volume fraction of microcalcifications was estimated from experimental observations of calcified matrix vesicles in thick and thin fibrous caps. In the work by Bobryshev et al. 关18兴, the number of matrix vesicles was found to be roughly 8.9⫾ 0.544 per 1.92 m2 in the thin fibrous cap. The percentage of calcified matrix vesicles in the thin fibrous cap was roughly 6.705⫾ 0.436. Using a calcified matrix vesicle diameter of 300 nm, the crosssectional area of the calcified matrix vesicles was calculated and divided by the total cross-sectional area. This yielded a nominal area fraction of 0.022, which means that 2.2% of the total area is covered by calcified matrix vesicles. Assuming that the vesicles are spherical the volume fraction was estimated, similar to Ref. 关42兴, and found to be 0.011 共1.1%兲. In the current study, a volume fraction of 0.01 and 0.03 were used in each set of the simulations. The region of microcalcification was modeled using an effective material response, which was based on homogenization theory of particulate composites. Classical approaches have sought to approximate or bound effective responses. This motivated the use of bounds on the effective properties. A widely used set of estimates for the effective properties are the Hashin– Shtrikman bounds 关36,37兴 for isotropic materials with isotropic effective responses. These provide bounds on the parameters and , which enter the nonlinearly elastic constitutive equation. Indeed, since the nonlinear material response reduces to a Hookean material in the infinitesimal limit, the effective material properties provide an estimate of the parameters used in the nonlinear model. The effective bulk modulus, with respect to the referential volume, was bounded by def
ⴱ,− o = m +
+
v po ⱕ ⴱo ⱕ p 1 3共1 − v po兲 + p − m 3m + 4m
def 1 − v po = ⴱ,+ o 1 3v po + m − p 3 p + 4 p
共9兲
Transactions of the ASME
Downloaded 07 Jan 2011 to 128.32.164.52. Redistribution subject to ASME license or copyright; see http://www.asme.org/terms/Terms_Use.cfm
where m and m are the material properties of the fibrous tissue 共matrix兲 and p, p, and v po are the material properties and referential volume fraction of the microcalcifications 共particles兲. The properties of the microcalcifications are based on those of hydroxyapatite, where p = 44.5 GPa and p = 89.0 GPa 关43兴. In addition to the bounds on the effective bulk modulus, the effective shear modulus was also bounded using the Hashin–Shtrikman bounds as def
ⴱ,− o = m +
+
v po ⱕ ⴱo ⱕ p 1 6共1 − v po兲共m + 2m兲 + p − m 5m共3m + 4m兲
def 共1 − v po兲 = ⴱ,+ o 6v po共 p + 2 p兲 1 + m − p 5 p共3 p + 4 p兲
共10兲
It is worth noting that no further geometric information, such as the shape of the asperities, etc., contributed to these bounds. A straightforward estimate of the effective properties is to take a convex combination of the bounds, for example, ⴱ,− ⴱo ⬇ ⴱ,+ o + 共1 − 兲o
and
ⴱ,− ⴱo ⬇ ⴱ,+ o + 共1 − 兲o
共11兲 where 0 ⱕ ⱕ 1. Finite element simulations of representative volume elements 共RVE兲 were conducted in order to estimate . A quasi-static homogeneous deformation was incrementally applied to the boundary of the RVE. The effective moduli were then calculated and compared with the Hashin–Shtrikman bounds, using Eq. 共11兲 in order to determine the linear combination parameter . Employing the concept of sample averaging, see Refs. 关42,44兴, the number of particles used in the RVE was varied. Several simulations were conducted with 5, 10, 20, and 30 particles in the RVE, keeping the volume fraction fixed. The simulations verified that the effective moduli fall within the preceding bounds. Since there was a large disparity between the material properties of each phase, i.e., the particles were much stiffer than the matrix, the effective moduli tended toward the lower bound of the Hashin–Shtrikman bounds. The value of was determined to be approximately 0.004. It should be noted that due to the low volume fraction, the interaction between particles was negligible with respect to the stress field. Since the volume fraction of the particle phase was low, less than 0.03, it was assumed that while the effective material properties were stiffened, the fundamental form of the constitutive equation was unaffected. This motivated the use of an effective strain energy function to model the region of microcalcification ⴱ ¯
Fig. 5 Spatial distribution of the volume fraction vpo within the effective region of the cap for a peak volume fraction of 0.03
Wⴱ = Dⴱ1o共eD2o共IC−3兲 − 1兲 +
ⴱo 共J − 1兲2 2
2.4 Stress Concentration Functions. In classical infinitesimal deformation analyses, macroscopic responses of materials that are heterogeneous on the mesoscale are described using a relation between averages, 具典⍀o = IEⴱo具⑀典⍀o, where 具 · 典⍀ 1 = 兩⍀o兩 兰⍀ · d⍀o, and where and ⑀ are the stress and infinitesimal strain tensor fields within an RVE of 共referential兲 volume 兩⍀o兩. If the effective property 共IEⴱo兲 is assumed isotropic, then one may write 具典⍀o = 3ⴱo共tr共具⑀典⍀o兲 / 3兲1 + 2ⴱo具⑀⬘典⍀o, where ⑀⬘ = ⑀ − 共tr共⑀兲 / 3兲1. For finite deformations of isotropic materials, the relation between volume averages may also be written in terms of a deviatoric and volumetric contribution. In this case, the effective property depends on whether the averaging volume is taken to be the referential 共undeformed兲 volume or the deformed configuration volume. For the case of finite deformations, defining the referential matrix space volume fraction by vmo = 兩⍀mo兩 / 兩⍀o兩 = 1 − v po = 1 − 共兩⍀ po兩 / 兩⍀o兩兲, and by averaging over the referential configuration the pressure within an RVE can be written as
共12兲
where Dⴱ1o共=ⴱo / 2Dⴱ2o兲 and ⴱo were computed from the convex combination of the Hashin–Shtrikman bounds in Eq. 共11兲 and Dⴱ2o 共=D2兲 was treated as a constant using the values from Table 2. The material properties in the calcified region did not vary through the thickness of the cap. However, the material properties did vary radially with respect to the center of the cylindrical calcified region. The volume fraction within the calcified region was varied using a modified normal distribution 共Fig. 5兲, rather than using a uniform distribution, which can potentially cause an artificial stress concentration at the interface between the fibrous tissue and region of microcalcification. The distribution implies that the volume fraction of particles present in the fibrous cap increases toward the center of the calcified region. The volume fraction was zero at the edge of the effective region so the properties match those of the surrounding fibrous tissue. Once the volume fraction v po was determined from the spatial distribution, the local effective properties in the microcalcified material ⴱo and ⴱo were Journal of Biomechanical Engineering
calculated using Eqs. 共9兲 and 共10兲, which were substituted into Eq. 共11兲.
共13兲 where ⴱo is the effective bulk modulus of the RVE and the referential finite strain concentration function Ko is given as 关45兴
共14兲
ⴱo
is known, the other can be determined Once either Ko or using Eq. 共13兲 or Eq. 共14兲. The stress concentration is given by ¯ ¯ pKoⴱ−1 o 具p典⍀o = Ko具p典⍀o = 具p典⍀ po, where Ko is known as the stress concentration function and it relates the average pressure in the particle phase to that in the whole RVE. Thus, the stress concentration is defined as SEPTEMBER 2010, Vol. 132 / 091011-5
Downloaded 07 Jan 2011 to 128.32.164.52. Redistribution subject to ASME license or copyright; see http://www.asme.org/terms/Terms_Use.cfm
Fig. 6 Far field loading of a single inclusion with an initial debonded region at the pole ⴱ ¯ = 1 p o − m K o v po ⴱo p − m
共15兲
¯ 具p典 = 具p典 . Clearly, the micropressure fields are where K o ⍀o ⍀ po ¯ = 1; there are no stress concentraminimally distorted when K o tions in a homogeneous material. For the matrix phase, 具p典⍀mo =
具p典⍀o − v po具p典⍀po vmo
=
¯ 具p典 具p典⍀o − v poK o ⍀ vmo
¯ = Ko具p典⍀o 共16兲
¯ where Ko is the stress concentration function that relates the average pressure in the matrix phase to the whole RVE. Therefore, in the case of isotropy, 1 ¯ ¯ 兲 共1 − v poK K o = o vmo
共17兲
The stress concentration functions derived in this section were used to relate the stress in the fibrous tissue to the stress computed in the effective region of microcalcification of the FSI simulations. 2.5 Estimates of Debonding. The study by Gent 关46兴 provided a framework for quantifying the stress required to cause debonding between a hard spherical inclusion and soft elastomeric matrix material. The theory is based on the Griffith fracture criterion and assumes that there is a small initially debonded region near the pole of the inclusion, as shown in Fig. 6. The debonded region is in the same direction as the loading due to the nature in which the surfaces peel away from one another. The debonding mechanism is similar to the opening of a mode I crack. The analytical formulation is based on a uniaxial loading of the matrix material away from the inclusion and is given by
2a =
4 G aE 3r sin共2兲
共18兲
where a is the applied far field stress, Ga is the bond fracture energy per unit surface area, E is the Young’s modulus of the matrix material, r is the radius of the inclusion, and is the initial debonding zone angle. 091011-6 / Vol. 132, SEPTEMBER 2010
Microcalcification particles are primarily hydroxyapatite, which is composed of calcium, phosphate, and hydroxide ions, and forms a crystalline molecular structure 关47兴. One of the main constituents of the fibrous tissue is collagen fibers, which are constructed from numerous cross-linked fibrils. These fibrils are also composed of hydroxide molecules 关48兴. Once the hydroxyapatite is released from a calcified matrix vesicle, crystal growth can continue due to the presence of calcium and phosphate ions in the extracellular environment 关18兴. In addition, it is possible that the microcalcifications can bond to the surrounding fibrous tissue due to the presence of hydroxide ions. Using the bond spacing of the hydroxyapatite and number of bonds per unit surface area, the bond fracture energy was estimated for two types of bonding. The edge lengths along the two primary axes on the surface of a unit cell of hydroxyapatite are approximately 6.8 Å and 9.4 Å 关47兴. The average of these two lengths was used to estimate the distance between the hydroxide molecules in the hydroxyapatite structure. Using an average bond spacing of 8.1 Å, the number of bonds per unit surface area was determined to be roughly 1.5656⫻ 1018 bonds/ m2. For a strong bond interaction between the microcalcification and fibrous tissue, such as an ionic bond 关49兴, the bond energy was assumed to be approximately 7.47 ⫻ 10−19 J / bond. Thus the fracture energy was calculated to be Ga = 1.2 J / m2. For a weaker bond, such as an intermolecular bond 关49兴, the bond energy was assumed to be approximately 1.66 ⫻ 10−21 J / bond. This corresponded to a bond fracture energy of Ga = 0.005 J / m2. It is possible that the bonding is also related to protein interaction but currently there is no experimental data to verify the true bond interaction type or strength between these materials. Thus, the computed estimates for Ga only provide theoretical upper and lower bounds on the bond interaction. Using the Gent approximation, the stress required to debond a microcalcification embedded in fibrous tissue was calculated for the values of E = 400 kPa, r = 5 m, and = 5 deg. In the case of a strong bond, the stress was found to be 1.52 MPa. For a weak bond, the stress was found to be 98.2 kPa. In the case of microcalcifications, it was assumed that the mode of failure is debonding at the interface, rather than cavitation away from the interface. This implies that the bond strength will tend toward the lower bound 关50兴. The applied stress values computed above support the possibility that the stress levels in a plaque lesion can cause debonding of microcalcifications embedded in fibrous tissue. In the current work, the critical stress at which debonding occurs was taken to be the failure stress of the fibrous tissue in the circumferential direction. This value has been noted in the literature as being approximately 300 kPa, see Refs. 关22,9兴. This is a conservative estimate but falls within the estimated bounds. The goal of the preceding sections was to highlight the key pieces needed for the proposed one-way multiscale approach, which was used to estimate the average circumferential stress in the fibrous tissue phase of the effective region of microcalcification. The average stress values were attained using the following procedure. 1. FSI simulations were conducted with various cap thicknesses, volume fractions, and positions of the effective region of microcalcification. 2. The location and magnitude of maximum circumferential stress was acquired within the effective region. 3. Using the local volume fraction defined at that point, the stress concentration functions were applied to the effective stress to retrieve the average stress in the fibrous tissue phase. 4. Assuming that the interaction between particles is minimal, the average circumferential stress in the fibrous tissue was compared with the critical debonding stress. Since debonding is dominated by volumetric stresses, which produce a load normal to the particle/matrix interface, the stress concentration function that is related to the volumetric response in Transactions of the ASME
Downloaded 07 Jan 2011 to 128.32.164.52. Redistribution subject to ASME license or copyright; see http://www.asme.org/terms/Terms_Use.cfm
Fig. 7 Close-up view of the fluid solution in the lumen for „a… the pressure field „Pa… and „b… the velocity field „m/s…. The length of the velocity vectors are proportional to the magnitude and are not color coded.
an RVE was applied to the effective first principal 共circumferential兲 stress computed from the FSI simulations. The average cirⴱ cumferential stress in the fibrous tissue 共matrix phase兲 1,⍀ is m then written as ⴱ ¯ ⴱ 1,⍀ =K o 1 m
共19兲
¯ is the volumetric stress concentration function from Eq. where K o 共17兲 and ⴱ1 is the effective 共homogenized兲 first principal stress at the point of interest in the microcalcified region.
3
Results
FSI simulations were conducted in order to investigate the influence of an effective region of microcalcification on the stress in fibrous plaque caps. Several combinations of cap thickness, volume fraction, and location of microcalcifications were chosen for this preliminary study. Ten simulations were conducted in total. The cap thickness was assigned to be 83 m or 150 m. The volume fraction of the microcalcifications was assigned to be 0.01 or 0.03, as well as 0.0 for two noncalcified cases. Finally, the region of microcalcification was located at either the center of the plaque cap or at the shoulder. In order to capture high stress gradients and velocity gradients the mesh was refined throughout the stenosis and region of microcalcification in both the solid and fluid fields. The mesh was refined until the stress in the fibrous cap and the velocity at the throat of the stenosis changed by less than 5%. The mesh remained coarse away from the critical areas and did not affect the solution. Each model was discretized into roughly 60,000 tetrahedral elements with quadratic interpolation functions for the displacement 共solid domain兲 and velocity 共fluid domain兲 and linear interpolation functions for the pressure. Journal of Biomechanical Engineering
The results in the fluid field did not vary significantly between simulations. A representative example of the lumenal pressure and velocity fields are shown in Fig. 7. A recirculation zone can be seen on the distal side of the stenosis. The pressure was minimum, where the flow separated from the wall, just distal to the throat of the stenosis. When there was no region of microcalcifications, the maximum circumferential stress was located at the shoulder region of the plaque cap nearest to the lipid pool for both cap thickness cases. A cross-section view of the 150 m case is shown in Fig. 8. As noted previously, the majority of plaque ruptures occur at the shoulder of the cap 关7兴. For a cap thickness of 150 m the maximum circumferential stress was 216 kPa while for a cap thickness of 83 m the maximum circumferential stress was 374 kPa. 3.1 Center Calcification Case. The circumferential stress distribution for a cap thickness of 150 m and a volume fraction of 0.03 is shown as a representative example in Fig. 9. The stress was high throughout the fibrous cap relative to the surrounding wall 共Fig. 9共b兲兲 but the highest stresses were concentrated in the region of microcalcification on the lumenal side of the cap, as indicated by the arrow in Fig. 9共e兲. The localization of high stress in the region of microcalcification was seen for all center calcification cases, which meant the maximum stress shifted away from the shoulder. It was determined that the stress gradient through the thickness of the cap was highest when the volume fraction was 0.03 for both values of cap thickness. This becomes clear when directly comparing Figs. 8 and 9共e兲. The average circumferential stress in the fibrous tissue phase, at the point of maximum stress in the calcified region, is reported in Table 3 for each of the cases. When the cap thickness was 150 m, the stress did not change much due to variations in the volume fraction. However, when the cap thickness was 83 m SEPTEMBER 2010, Vol. 132 / 091011-7
Downloaded 07 Jan 2011 to 128.32.164.52. Redistribution subject to ASME license or copyright; see http://www.asme.org/terms/Terms_Use.cfm
0.03 and the cap thickness was 150 m, the average circumferential stress increased by 32.6% relative the center calcification case and 37.5% relative to the noncalcified case. When the volume fraction was 0.03 and the cap thickness was 83 m, the stress increased by 19% relative to the center calcification case and 30.5% relative to the noncalcified case.
4
Discussion
In the current study, the presence of microcalcifications in fibrous plaque caps was investigated using FSI modeling and micromechanical homogenization theory. It has been shown in the literature that microcalcifications can have a significant effect on the stress in fibrous caps 关30,28,51兴. However, the main difference between the current work and previous literature is an additional focus on the effects of both the quantity and location of microcalcifications. By using a spatially varying effective material response to represent the microcalcifications the computational requirements were greatly reduced, compared with resolving individual inclusions with elements 关30,28兴. It is apparent from the results that the region of microcalcification had a significant influence on the magnitude of stress in the plaque cap. In some cases the average circumferential stress in the fibrous tissue increased by 37.5% relative to the noncalcified case. In addition to understanding how the magnitude of stress changes with respect to the microcalcifications, it is also important to explore how the location of maximum stress is affected as well. It was found that when there is a region of microcalcification in the central portion of the cap, the maximum circumferential stress shifts to this region. This could help explain why 40% of cap ruptures occur away from the shoulder. The shift in the stress distribution from the lipid surface of the cap 共Fig. 9共e兲兲 to the lumenal surface of the cap 共Fig. 10共e兲兲 is most likely due to the complex loading from the spatially varying pressure distribution in the flow field, which causes a multiaxial bending-like load. It is unclear from the literature whether rupture initiates near the lumen or near the lipid pool 关52,8兴 but the results of the current study indicate that rupture could potentially initiate near the lipid pool when failure occurs at the shoulder and near the lumen when it occurs at the center of the cap.
Fig. 8 Circumferential cross-section view of the circumferential stress distribution, cap thickness of 150 m and vp = 0.0. The arrow indicates the point, where the maximum circumferential stress occurs.
the stress increased more significantly as the volume fraction was increased. When the cap was thinner, there was an increased sensitivity to changes in the local material properties in the region of microcalcification. 3.2 Shoulder Calcification Case. The circumferential stress distribution for a cap thickness of 150 m and a volume fraction of 0.03 is shown in Fig. 10. The highest stresses were concentrated at the region of microcalcification, which amplified the already high stress at the shoulder. The stress increased through the thickness of the cap compared with the noncalcified case. However, the maximum stress still occurred on the lipid pool side of the fibrous cap, as indicated by the arrow in Fig. 10共e兲, just like the noncalcified case. The average circumferential stress in the fibrous tissue phase, at the point of maximum stress in the calcified region, is reported in Table 4 for each of the cases. When the calcified region was located at the shoulder, there was a more significant effect on increasing the magnitude of stress in both the 83 m and 150 m thick caps. For the case when the volume fraction was 091011-8 / Vol. 132, SEPTEMBER 2010
Table 3 Average circumferential stress in the fibrous tissue phase when the region of microcalcification is located at the center of the plaque cap. The corresponding location is indicated by the arrow in Fig. 8 for the noncalcified cases and Fig. 9„e… for the calcified cases. Cap thickness 共m兲
v po
ⴱ 1,⍀ 共kPa兲
150
0.00 0.01 0.03 0.00 0.01 0.03
216 217 224 374 389 410
83
m
Table 4 Average circumferential stress in the fibrous tissue phase when the region of microcalcification is located at the shoulder of the plaque cap. The corresponding location is indicated by the arrow in Fig. 8 for the noncalcified cases and Fig. 10„e… for the calcified cases. Cap thickness 共m兲
v po
ⴱ 1,⍀ 共kPa兲
150
0.00 0.01 0.03 0.00 0.01 0.03
216 226 297 374 394 488
83
m
Transactions of the ASME
Downloaded 07 Jan 2011 to 128.32.164.52. Redistribution subject to ASME license or copyright; see http://www.asme.org/terms/Terms_Use.cfm
Fig. 9 Circumferential stress „Pa… distribution when the region of microcalcification is located at the center of the cap with a thickness of 150 m and a volume fraction of 0.03: „a… full three-dimensional view of the artery model, „b… close-up three-dimensional view of the stenosis, „c… longitudinal cross-section view of the stenosis, „d… full circumferential crosssection view through the point of maximum stress, and „e… close-up circumferential view. The arrows indicate the point, where the maximum circumferential stress occurs.
It has been observed in the literature that cap thickness is one of the primary factors that influences the stress in plaque lesions 关27,30,53兴. The results of the present work also captured a significant increase in stress due to variations in the cap thickness. As the fibrous cap thickness deteriorates, a point can be reached, where the lesion becomes “vulnerable” to rupture. The vulnerable cap thickness of the carotid artery is not as established as the coronary artery but has been reported to be roughly 100 m 关17,18兴. When comparing the average circumferential stress in the fibrous tissue to the critical value of 300 kPa it can be seen that the thickness when debonding can begin to occur, varies with the volume fraction of microcalcifications. In the case when the cap thickness was 150 m and the region of microcalcification was Journal of Biomechanical Engineering
located at the center of the cap the stress stayed below the critical value but when the region was located at the shoulder the stress nearly exceeded the critical value, reaching 297 kPa. This indicates that rupture could actually occur in a cap thicker than 100 m, if microcalcifications are present. As expected the stress exceeded the critical value when the cap thickness was 83 m in both the shoulder and center microcalcification cases. There are several limitations to the present study. The use of idealized geometry does not fully capture the complexity of the plaque lesion. Also, the distribution of microcalcifications is still under investigation and is not fully understood. In addition, the interaction between the microcalcifications and fibrous tissue is only an estimate based on two possible types of bonding. It is SEPTEMBER 2010, Vol. 132 / 091011-9
Downloaded 07 Jan 2011 to 128.32.164.52. Redistribution subject to ASME license or copyright; see http://www.asme.org/terms/Terms_Use.cfm
Fig. 10 Circumferential stress „Pa… distribution when the region of microcalcification is located at the shoulder of the cap with a thickness of 150 m and a volume fraction of 0.03: „a… full three-dimensional view of the artery model, „b… close-up three-dimensional view of the stenosis, „c… longitudinal cross-section view of the stenosis, „d… full circumferential crosssection view through the point of maximum stress, and „e… close-up circumferential view. The arrows indicate the point, where the maximum circumferential stress occurs.
necessary to perform further experiments and measurements to determine an accurate range of characteristics for the microcalcifications in terms of their spatial distribution and bonding before a more comprehensive mathematical model can be constructed.
5
Conclusions
It was found that for the set of parameters used in this study, the maximum circumferential stress always shifted to the region of microcalcification. The amplification of the stress was more significant in the shoulder region of the cap due to the naturally 091011-10 / Vol. 132, SEPTEMBER 2010
higher stress that occurs there. However, the fact that the stress was shifted and amplified when the calcification was in the center of the cap is an important observation. This could support the findings that 40% of plaque failures occur away from the shoulder of the cap. Typically, caps that are thicker than 100 m are considered stable but the stress computed in the simulations indicate that caps as thick as 150 m could begin to debond in the presence of microcalcifications. Assuming that debonding can lead to further failure, and possible rupture, the presence of these microcalcifications should be addressed when assessing the state of a plaque lesion. Transactions of the ASME
Downloaded 07 Jan 2011 to 128.32.164.52. Redistribution subject to ASME license or copyright; see http://www.asme.org/terms/Terms_Use.cfm
Future work will investigate the interaction of the microcalcifications with the surrounding fibrous tissue. In addition, modeling the growth of a void, caused by a debonded particle, should be investigated. This could shed light on the actual mode of failure in the cap. Sensitivity studies will be conducted in order to investigate the coupled interactions that might occur between parameters. Finally, the model for debonding should be applied to patient-specific geometry and compared with actual failed plaques.
References 关1兴 Mach, F., 2005, “Inflammation is a Crucial Feature of Atherosclerosis and a Potential Target to Reduce Cardiovascular Events,” Atherosclerosis: Diet and Drugs, A. v. Eckardstein, ed., Springer-Verlag, Berlin, pp. 697–722. 关2兴 Dirksen, M. T., van der Wal, A. C., van den Berg, F. M., van der Loos, C. M., and Becker, A. E., 1998, “Distribution of Inflammatory Cells in Atherosclerotic Plaques Relates to the Direction of Flow,” Circulation, 98, pp. 2000– 2003. 关3兴 Lovett, J. K., and Rothwell, P. M., 2003, “Site of Carotid Plaque Ulceration in Relation to Direction of Blood Flow: An Angiographic and Pathological Study,” Cerebrovasc Dis., 16, pp. 369–375. 关4兴 Newby, A. C., 2005, “Dual Role of Matrix Metalloproteinases 共Matrixins兲 in Intimal Thickening and Atherosclerotic Plaque Rupture,” Physiol. Rev., 85, pp. 1–31. 关5兴 Kilpatrick, D., Xu, C., Vito, R., and Glagov, S., 2002, “Correlation of Mechanical Behavior and MMP-1 Presence in Human Atherosclerotic Plaque,” J. Mech. Med. Biol., 2共1兲, pp. 1–7. 关6兴 Groen, H. C., Gijsen, J. H., van der Lugt, A., Ferguson, M. S., Hatsukami, T. S., van der Steen, A. F. W., Yuan, C., and Wentzel, J. J., 2007, “Plaque Rupture in the Carotid Artery is Localized at the High Shear Stress Region,” Stroke, 38, pp. 2379–2381. 关7兴 Shah, P. K., 2007, “Molecular Mechanisms of Plaque Instability,” Curr. Opin. Lipidol., 18, pp. 492–499. 关8兴 Richardson, P. D., Davies, M. J., and Born, G. V. R., 1989, “Influence of Plaque Configuration and Stress Distribution on Fissuring of Coronary Atherosclerotic Plaques,” Lancet, 334, pp. 941–944. 关9兴 Vengrenyuk, Y., Carlier, S., Xanthos, S., Cardoso, L., Ganatos, P., Virmani, R., Einav, S., Gilchrist, L., and Weinbaum, S., 2006, “A Hypothesis for Vulnerable Plaque Rupture Due To Stress-Induced Debonding Around Cellular Microcalcification in Thin Fibrous Caps,” Proc. Natl. Acad. Sci. U.S.A., 103, pp. 14678–14683. 关10兴 Shanahan, C. M., 2007, “Inflammation Ushers in Calcification, A Cycle of Damage and Protection?,” Circulation, 116, pp. 2782–2785. 关11兴 Phair, R. D., 1988, “Cellular Calcium and Atherosclerosis: A Brief Review,” Cell Calcium, 9, pp. 275–284. 关12兴 Massaeli, H., and Pierce, G. N., 1995, “Involvement of Lipoproteins, Free Radicals and Calcium in Cardiovascular Disease Processes,” Cardiovasc Res., 29, pp. 597–603. 关13兴 Tulenko, T. N., Laury-Kleintop, L., Walter, M. F., and Mason, R. P., 1997, “Cholesterol, Calcium and Atherosclerosis: Is There a Role for Calcium Channel Blockers in Atheroprotection,” Int. J. Cardiol., 62, pp. S55–S66. 关14兴 Roijers, R. B., Dutta, R. K., Cleutjens, J. P. M., Mutsaers, P. H. A., de Goeij, J. J. M., and van der Vusse, G. J., 2008, “Early Calcification in Human Coronary Arteries as Determined With a Proton Microprobe,” Anal. Chem., 80, pp. 55–61. 关15兴 Moore, M. P., Spencer, T., Salter, D. M., Dearney, P. P., Shaw, T. R. D., Starkey, I. R., Fitzgerald, P. J., Erbel, R., Lange, A., McDicken, N. W., Sutherland, G. R., and Fox, F. A. A., 1998, “Characterisation of Coronary Atherosclerotic Morphology by Spectral Analysis of Radiofrequency Signal: In Vitro Intravascular Ultrasound Study With Histological and Radiological Validation,” Heart, 79, pp. 459–467. 关16兴 Friedrich, G. J., Moes, N. Y., Mühlberger, V. A., Gabl, C., Mikuz, G., Hausmann, D., Fitzgerald, P. J., and Yock, P. G., 1994, “Detection of Intralesional Calcium by Intracoronary Ultrasound Depends on the Histologic Pattern,” Am. Heart J., 128, pp. 435–441. 关17兴 Kolodgie, F. D., Nakazawa, G., Sangiorgi, G., Ladich, E., Burke, A. P., and Virmani, R., 2007, “Pathology of Atherosclerosis and Stenting,” Neuroimaging Clin. N. Am., 17, pp. 285–301. 关18兴 Bobryshev, Y. V., Killingsworth, M. C., Lord, R. S. A., and Grabs, A. J., 2008, “Matrix Vesicles in the Fibrous Cap of Atherosclerotic Plaque: Possible Contribution to Plaque Rupture,” J. Cell. Mol. Med., 12, pp. 2073–2082. 关19兴 Stary, H. C., 2000, “Natural History of Calcium Deposits in Atherosclerosis Progression and Regression,” Z. Kardiol., 89, pp. SO28–SO35. 关20兴 Frink, R. J., 2002, Inflammatory Atherosclerosis: Characteristics of the Injurious Agent, Heart Research Foundation of Sacramento, Sacramento, Chap. 5. 关21兴 Humphrey, J. D., 2002, Cardiovascular Solid Mechanics: Cells, Tissues, and Organs, Springer-Verlag, New York, Chap. 7, pp. 319–335. 关22兴 Holzapfel, G. A., Sommer, G., and Regitnig, P., 2004, “Anisotropic Mechanical Properties of Tissue Components in Human Atherosclerotic Plaques,” ASME J. Biomech. Eng., 126, pp. 657–665. 关23兴 Loree, H. M., Grodzinsky, A. J., Park, S. Y., Gibson, L. J., and Lee, R. T., 1994, “Static Circumferential Tangential Modulus of Human Atherosclerotic Tissue,” J. Biomech., 27, pp. 195–204.
Journal of Biomechanical Engineering
关24兴 Lee, R. T., Grodzinsky, A. J., Frank, E. H., Kamm, R. D., and Schoen, F. J., 1991, “Structure-Dependent Dynamic Mechanical Behavior of Fibrous Caps From Human Atherosclerotic Plaques,” Circulation, 83, pp. 1764–1770. 关25兴 Tang, D., Yang, C., Zheng, J., Woodard, P. K., Sicard, G. A., Saffitz, J. E., and Yuan, C., 2004, “3D MRI-Based Multicomponent FSI Models for Atheroscerotic Plaques,” Ann. Biomed. Eng., 32, pp. 947–960. 关26兴 Tang, D., Yang, C., Zheng, J., Woodard, P. K., Saffitz, J. E., Petruccelli, J. D., Sicard, G. A., and Yuan, C., 2005, “Local Maximal Stress Hypothesis and Computational Plaque Vulnerability Index for Atherosclerotic Plaque Assessment,” Ann. Biomed. Eng., 33, pp. 1789–1801. 关27兴 Tang, D., Yang, C., Zheng, J., Woodard, P. K., Saffitz, J. E., Sicard, G. A., Pilgram, T. K., and Yuan, C., 2005, “Quantifying Effects of Plaque Structure and Material Properties on Stress Distributions in Human Atherosclerotic Plaques Using 3D FSI Models,” ASME J. Biomech. Eng., 127, pp. 1185– 1194. 关28兴 Bluestein, D., Alemu, Y., Avrahami, I., Gharib, M., Dumont, K., Ricotta, J. J., and Einav, S., 2008, “Influence of Microcalcifications on Vulnerable Plaque Mechanics Using FSI Modeling,” J. Biomech., 41, pp. 1111–1118. 关29兴 Li, Z., Howarth, S., Tang, T., and Gillard, J. H., 2006, “How Critical is Fibrous Cap Thickness on Carotid Plaque Stability?: A Flow-Plaque Interaction Model,” Stroke, 37, pp. 1195–1199. 关30兴 Vengrenyuk, Y., Cardoso, L., and Weinbaum, S., 2008, “Micro-CT Based Analysis of a New Paradigm for Vulnerable Plaque Rupture: Cellular Microcalcifications in Fibrous Cap,” Mol. Cell. Biomech., 5, pp. 37–47. 关31兴 Chau, A. H., Chan, R. C., Shishkov, M., MacNeill, B., Iftimia, N., Tearney, J. G., Kamm, R. D., Bouma, B. E., and Mofrad, M. R. K., 2004, “Mechanical Analysis of Atherosclerotic Plaques Based on Optical Coherence Tomography,” Ann. Biomed. Eng., 32, pp. 1494–1503. 关32兴 Li, Z., Howarth, S., Trivedi, R. A., U-King-Im, J. M., Graves, M. J., Brown, A., Wang, L., and Gillard, J. H., 2006, “Stress Analysis of Carotid Plaque Rupture Based on In Vivo High Resolution MRI,” J. Biomech., 39, pp. 2611– 2622. 关33兴 Huang, H., Virmani, R., Younis, H., Burke, A. P., Kamm, R. D., and Lee, R. T., 2001, “The Impact of Calcification on the Biomechanical Stability of Atherosclerotic Plaques,” Circulation, 103, pp. 1051–1056. 关34兴 Zohdi, T. I., and Szeri, A. J., 2005, “Fatigue of Kidney Stones With Heterogeneous Microstructure Subjected to Shock-Wave Lithotripsy,” J. Biomed. Mater. Res., Part B: Appl. Biomater., 75, pp. 351–358. 关35兴 Stylianopoulos, T., and Barocas, V. H., 2007, “Multiscale, Structure-Based Modeling for the Elastic Mechanical Behavior of Arterial Walls,” ASME J. Biomech. Eng., 129, pp. 611–618. 关36兴 Hashin, Z., and Shtrikman, S., 1962, “On Some Variational Principles in Anisotropic and Nonhomogeneous Elasticity,” J. Mech. Phys. Solids, 10, pp. 335–342. 关37兴 Hashin, Z., and Shtrikman, S., 1963, “A Variational Approach to the Theory of the Elastic Behaviour of Multiphase Materials,” J. Mech. Phys. Solids, 11, pp. 127–140. 关38兴 Wendelhag, I., Wiklund, O., and Wikstrand, J., 1996, “On Quantifying Plaque Size and Intima-Media Thickness in Carotid and Femoral Arteries,” Arterioscler. Thromb., Vasc. Biol., 16, pp. 843–850. 关39兴 Moreno, P. R., Lodder, R. A., Purushothaman, K. R., Charash, W. E., O’Connor, W. N., and Muller, J. E., 2002, “Detection of Lipid Pool, Thin Fibrous Cap, and Inflammatory Cells in Human Aortic Atherosclerotic Plaques by Near-Infrared Spectroscopy,” Circulation, 105, pp. 923–927. 关40兴 Virmani, R., Burke, A. P., Farb, A., and Kolodgie, F. D., 2006, “Pathology of the Vulnerable Plaque,” J. Am. Coll. Cardiol., 47, pp. C13–C18. 关41兴 Stroud, J. S., Berger, S. A., and Saloner, D., 2002, “Numerical Analysis of Slow Through a Severely Stenotic Carotid Artery Bifurcation,” ASME J. Biomech. Eng., 124, pp. 9–20. 关42兴 Zohdi, T. I., and Wriggers, P., 2005, Introduction to Computational Micromechanics, Springer-Verlag, Berlin, Chap. 6. 关43兴 Gilmore, R. S., and Katz, J. L., 1982, “Elastic Properties of Apetites,” J. Mater. Sci., 17, pp. 1131–1141. 关44兴 Temizer, I., and Zohdi, T. I., 2007, “A Numerical Method for Homogenization in Nonlinear Elasticity,” Comput. Mech., 40, pp. 281–298. 关45兴 Zohdi, T. I., 2003, “On the Compaction of Cohesive Hyperelastic Granules at Finite Strains,” Proc. R. Soc. London, Ser. A, 454共2034兲, pp. 1395–1401. 关46兴 Gent, A. N., 1980, “Detachment of an Elastic Matrix From a Rigid Spherical Inclusion,” J. Mater. Sci., 15, pp. 2884–2888. 关47兴 Lopes, M. A., Knowles, J. C., and Santos, J. D., 2000, “Structural Insights of Glass Reinforced Hydroxyapatite Composites by Rietveld Refinement,” Biomaterials, 21, pp. 1905–1910. 关48兴 Cowin, S. C., and Doty, S. B., 2007, Tissue Mechanics, Springer-Verlag, New York, Chap. 10, pp. 297–304. 关49兴 Flinn, R. A., and Trojan, P. K., 1995, Engineering Materials and Their Applications, Wiley, New York, Chap. 1, pp. 18–31. 关50兴 Gent, A. N., and Park, B., 1984, “Failure Processes in Elastomers at or Near a Rigid Spherical Inclusion,” J. Mater. Sci., 19, pp. 1947–1956. 关51兴 Li, Z., Howarth, S., Tang, T., U-King-Im, J., and Gillard, J. H., 2007, “Does Calcium Deposition Play a Role in the Stability of Atheroma? Location may be the key,” Cerebrovasc Dis., 24, pp. 452–459. 关52兴 Versluis, A., Bank, A. J., and Douglas, W. H., 2006, “Fatigue and Plaque Rupture in Myocardial Infarction,” J. Biomech., 39, pp. 339–347. 关53兴 Finet, G., Ohayon, J., and Rioufol, G., 2004, “Biomechanical Interaction Between Cap Thickness, Lipid Core Composition and Blood Pressure in Vulnerable Coronary Plaque: Impact on Stability or Instability,” Coron. Artery Dis., 15, pp. 13–20.
SEPTEMBER 2010, Vol. 132 / 091011-11
Downloaded 07 Jan 2011 to 128.32.164.52. Redistribution subject to ASME license or copyright; see http://www.asme.org/terms/Terms_Use.cfm