Hindawi Publishing Corporation The Scientific World Journal Volume 2013, Article ID 852864, 8 pages http://dx.doi.org/10.1155/2013/852864
Research Article Numerical Simulation and Comparison of Conventional and Sloped Solar Chimney Power Plants: The Case for Lanzhou Fei Cao,1,2 Huashan Li,3,4 Yang Zhang,2,5 and Liang Zhao2 1
College of Mechanical and Energy Engineering, Jimei University, Xiamen 361021, China State Key Laboratory of Multiphase Flow in Power Engineering, Xi’an Jiaotong University, Xi’an 710049, China 3 CAS Key Laboratory of Renewable Energy, Guangzhou Institute of Energy Conversion, Chinese Academy of Sciences, Guangzhou 510640, China 4 University of Chinese Academy of Sciences, Beijing 100049, China 5 Nuclear and Radiation Safety Center, Beijing 100082, China 2
Correspondence should be addressed to Fei Cao;
[email protected] Received 21 August 2013; Accepted 14 October 2013 Academic Editors: M. Cepin and G. H. Yeoh Copyright © 2013 Fei Cao et al. This is an open access article distributed under the Creative Commons Attribution License, which permits unrestricted use, distribution, and reproduction in any medium, provided the original work is properly cited. The solar chimney power plant (SCPP) generates updraft wind through the green house effect. In this paper, the performances of two SCPP styles, that is, the conventional solar chimney power plant (CSCPP) and the sloped solar chimney power plant (SSCPP), are compared through a numerical simulation. A simplified Computational Fluid Dynamics (CFD) model is built to predict the performances of the SCPP. The model is validated through a comparison with the reported results from the Manzanares prototype. The annual performances of the CSCPP and the SSCPP are compared by taking Lanzhou as a case study. Numerical results indicate that the SSCPP holds a higher efficiency and generates smoother power than those of the CSCPP, and the effective pressure in the SSCPP is relevant to both the chimney and the collector heights.
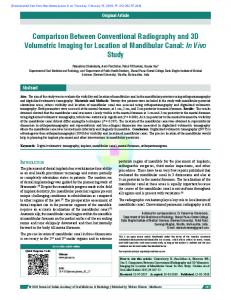
1. Introduction The solar chimney power plant (SCPP) offers interesting opportunities to use the clean solar radiation to satisfy the ever-increasing world energy demand. It is designed to produce electric power on a large-scale by first converting solar energy into thermal energy which is then converted into kinetic energy to drive the wind turbine for power generation. There are many styles of SCPPs reported in the literature, among which the conventional solar chimney power plant (CSCPP) and the sloped solar chimney power plant (SSCPP) are most suitable for Northwest China [1]. The schematics of the CSCPP and the SSCPP are shown in Figure 1. The solar chimney power plant concept was originally proposed in 1903 by Isidoro Cabanyes [2]. In 1931, a description of a solar chimney power plant was presented by G¨unther [3]. The basic study on the solar chimney concept was performed by Schlaich in the 1970s, and in 1981 he began the construction of a 50 kW pilot solar chimney power plant in Manzanares, Spain [4, 5]. The chimney tower is 194.6 m
in height, and the collector radius is 122 m. Many studies on the CSCPP have been presented in the literature on its analytical and experimental performances [6–9]. However, the high chimney reduces the feasibility of the SCPP because of its safety risks. In 2005, a sloped solar chimney power plant (SSCPP) was proposed by Bilgen and Rheault [10], whose solar collector is laid along the hillside. Further studies indicated that the SSCPP held higher thermal efficiency and could somehow reduce the chimney height [1, 11]. Numerical simulations of the CSCPP have been well documented in the literature. Ming et al. employed Computational Fluid Dynamics (CFD) software to evaluate the performance of a CSCPP, in which the effects of various parameters on the relative static pressure, the driving force, the power output, and the efficiency were further investigated with or without a turbine [12, 13]. Pastohr et al. simulated the temperature and velocity fields in the CSCPP using numerical solutions [14]. Dimensionless analyses of CSCPPs were carried out, using the finite volume method, to understand the flow through the solar collector and chimney [15]. Zhou et al.
2
The Scientific World Journal
Sun
Chimney Generator Collector Turbine Ground
Supports
(a)
Airflow outlet
Airflow outlet
Chimney
Mountain ground
Chimney
Turbine generator
Turbine generator Solar collector
Solar collector
Mountain ground Airflow inlet
Airflow inlet Front view
Left-side view (b)
Figure 1: Schematic of the solar chimney power system: (a) on horizontal surface, (b) on sloped surface.
built a mathematical model to simulate the compressible flow through the solar chimney [16]. These studies make clear the flow details in the CSCPP, through which the structures of the CSCPP are optimized. However, the numerical simulations on the SSCPP have rarely been reported. The case studies carried out by Cao et al. [1, 11] and Bilgen and Rheault [10] only estimated the monthly average performance of the SSCPPs. No further details of the flow, temperature, and pressure fields can be obtained in the literature. Considering this, a numerical simulation is carried out to analyze and compare the monthly average performance and inner details of the CSCPP and the SSCPP by taking Lanzhou, China, as a case study.
2. Mathematical Model 2.1. Basic Equations. The continuity equation, the 3D NavierStokes equations, the energy equation, and the 𝑘-𝜀 equations are described as follows. Continuity: 𝜕𝜌 𝜕 (𝜌𝑢𝑖 ) = 0. + 𝜕𝑡 𝜕𝑥𝑖
(1)
Navier-Stokes equations: 𝜕𝑝 𝜕𝜏𝑖𝑗 𝜕 𝜕 (𝜌𝑢𝑖 𝑢𝑗 ) = − + + 𝜌𝑔𝑖 . (𝜌𝑢𝑖 ) + 𝜕𝑡 𝜕𝑥𝑗 𝜕𝑥𝑖 𝜕𝑥𝑗
(2)
Energy equation: 𝜕 𝜕 (𝜌𝑐𝑝 𝑢𝑗 𝑇) (𝜌𝑐𝑝 𝑇) + 𝜕𝑡 𝜕𝑥𝑗 𝜕𝑝 𝜕𝑝 𝜕𝑢 𝜕 𝜕𝑇 = (𝑘 ) + 𝜏𝑖𝑗 𝑖 + 𝛽𝑇 ( + 𝑢𝑗 ). 𝜕𝑥𝑗 𝜕𝑥𝑗 𝜕𝑥𝑗 𝜕𝑡 𝜕𝑥𝑗
(3)
𝑘-𝜀 equations: 𝜌
𝜇 𝜕𝑘 𝜇 𝜕𝑇 𝐷𝑘 𝜕 [(𝜇 + 𝑡 ) ] + 𝐺𝑘 + 𝛽𝑔𝑖 𝑡 − 𝜌𝜀, = 𝐷𝑡 𝜕𝑥𝑖 𝜎𝑘 𝜕𝑥𝑖 Pr𝑡 𝜕𝑥𝑖 𝜌
𝜇 𝐷𝜀 𝜕𝜀 𝜕 [(𝜇 + 𝑡 ) ] = 𝐷𝑡 𝜕𝑥𝑖 𝜎𝜀 𝜕𝑥𝑖
(4)
𝜇 𝜕𝑇 𝜀 𝜀2 ) − 𝐶2𝜀 𝜌 , + 𝐶1𝜀 (𝐺𝑘 + 𝐶3𝜀 𝛽𝑔𝑖 𝑡 𝑘 Pr𝑡 𝜕𝑥𝑖 𝑘 where 𝜌 is the airflow density, 𝑡 is the time, 𝑢 denotes the airflow velocity at the three directions (namely, the 𝑖, 𝑗, and 𝑘 directions) in a Cartesian coordinate, 𝑐𝑝 is the airflow specific heat capacity, 𝑝 is the pressure, 𝛽 is the thermal expansion coefficient, 𝑇 is the airflow temperature, and 𝐺𝑘 represents the generation of turbulence kinetic energy. 2.2. Solar Collector. The solar collector of an SCPP can be basically treated as a solar air heater. The schematic of thermal
The Scientific World Journal
3 640 Solar radiation (W·m−2 )
620
Cover
S1
Absorb by glass
Solar radiation
Transmit through glass
Reflect by glass
600 580 560 540 520 500 480 460 0
S2
Ground
Air flow
Absorb by ground
Outlet
Reflect by ground Loss to the surrounding
Inlet
Figure 2: Thermal balance in the solar collector.
balance in the collector is shown in Figure 2. The sunlight is transmited through the collector glass cover and it heats the ground below. The hot ground transfers heat in the style of convection and radiation to the air above it. The solar radiation absorbed by the glass cover is S1 and the solar radiation transferred through the glass cover and absorbed by the ground is S2 . The cold air enters the collector and is heated by the hot ground. The ray tracing algorithm of the solar load model is used to calculate the illumination energy source of the solar collector and ground, which results from the incident solar radiation. The heat flux produced is then coupled with the ANSYS Fluent calculation via a source term in the energy equation. The heat sources are added directly to the computational cells bordering each face and are assigned to adjacent cells. As the steady state, the average sun position vector and illumination parameters are set monthly. As a turbulence model is necessary for the description of the turbulent flow conditions, the standard model and standard wall mode are selected to describe the fluid flow inside the collector and the chimney. 2.3. Power Generation and System Efficiency. The density of the hot air in the chimney is smaller than the ambient air, resulting in a low static pressure in the chimney. The pressure difference between the chimney base and the ambient, Δ𝑝𝑡 , is the system driving force to impel air to flow through the SCPP.
5 10 15 20 25 30 35 40 45 50 55 60 65 70 75 Surface tilted angle (∘ )
Figure 3: Annually average solar radiation for tilted surfaces.
The power generated by the turbine, 𝑃ele , and the overall efficiency, 𝜂, are, respectively, 𝑃ele = 𝜂𝑡 Δ𝑝𝑡 𝑉chi 𝐴 chi , 𝜂=
𝑃ele (𝐼ra 𝐴 gro )
,
(5) (6)
where 𝜂𝑡 is the efficiency of the turbine, 𝑉chi is the velocity of the air in the outlet of the chimney, 𝐴 chi is the area of the outlet of the chimney, 𝐼ra is the incident radiation of the sun, and 𝐴 gro is the area of ground.
3. Results and Discussion The numerical simulation based on (1)–(6) is developed on ANSYS Fluent to simulate the performances of a CSCPP and a SSCPP in Lanzhou, China. Lanzhou (103.50∘ E, 36.03∘ N) is a zonal basin city 1520 m above the sea level, with an area of 13085.6 km2 . It is the capital of Gansu Province and locates in the geographical central of Northwest China. Its annual global solar radiation is more than 5020 MJ/m2 , and sunshine duration is over 2600 hours per year. Its annually mean temperature is 9.8∘ C. As for the SSCPP, the solar collector tilted angle is an important parameter. Figure 3 shows the annually average received solar radiation by the solar collectors at different surface angles. Near 30∘ , there is a pink point, where the solar collectors receive the maximum solar radiation (MSR). On the basis of the existing meteorological data, we choose 31∘ , which is named as the MSR angle, as the solar collector angel for the SSCPP. The physical model for CSCPP is built based on the geometrical dimensions of the Manzanares prototype. To compare the performances between the SCPPs, the SSCPP has the same geometrical dimensions as the CSCPP. The main parameters used in the simulation process are summarized in Table 1. The SCPP is divided into five areas, namely, the collector, the collector inlet, the chimney, the ground, and the chimney outlet. The assumed boundary conditions are illustrated in
4
The Scientific World Journal 0
326
−20
323
325 322 326
Temperature
324
321
323
320
322 321
−100
−40 −50
−110
Pressure
−30
324
323
325 324
−10
−90
325
−90 −100
−90−120 −20 −10
320
−110 −120
0
(a)
(b)
15 14 13 12 11 10
14
8
13 12
Velocity-magnitude
15
6 4 10 64
2
2 (c)
Figure 4: Temperature, velocity, and pressure fields of the CSCPP when 𝐼ra = 1000 W/m2 (temperature unit: K, pressure unit: Pa, and velocity unit: m/s).
Table 2: Boundary condition assumptions for the SCPPs in Fluent.
Table 1: Main parameters of the SCPPs. Parameter Collector square Chimney height Chimney radius CSCPP collector radius SSCPP collector height
Value 46759.5 m2 194.6 m 5.08 m 122 m 193.5 m
Table 2. The heat transfer coefficient between the glass roof and the ambient air, ℎ𝑟 , is set as 4 W/(m2 ⋅K). The absorptivity and transmissivity of the glass are 0.1 and 0.8, respectively. The direct visible absorptivity and direct IR absorptivity of the ground surface are 0.8 and 0.92, respectively.
Location Glass roof Ground surface Chimney wall Collector inlet Chimney outlet
Type Wall Wall Wall Pressure inlet Pressure outlet
Description Mixed, semitransparent 𝑞 = 0 W/m2 , opaque 𝑞 = 0 W/m2 Δ𝑝 = 0 Pa Δ𝑝 = 0 Pa
3.1. Model Validation. To validate the numerical model, the temperature rise in the collector and the upwind velocity at the chimney inlet are compared with the experimental data from the Spanish prototype [4]. The Spanish prototype experimental results indicate that, when the solar radiation is
5
12
500
10
400
8 12
300
11
200
10
100
9 8 Dec
Nov
Sep
Oct
Jul
Aug
Jun
May
Apr
Feb
Mar
0
Airflow velocity (m·s−1 )
14
600
Temp. rise (∘ C)
16 700
Jan
Radiation into the solar collector (W·m−2 )
The Scientific World Journal
Month in the year SSCPP airflow temp. rise Solar radiation on horizontal Solar radiation on slope
CSCPP airflow velocity SSCPP airflow velocity CSCPP airflow temp. rise
0.3 0.2 0.1
Efficiency (%)
0.4
Dec
Nov
Oct
Sep
Jul
Aug
Jun
May
Apr
Mar
Feb
0 −20 −40 −60 −80 −100 −120
Pressure drop (Pa)
110 100 90 80 70 60 50 40 30 20 10 0 Jan
Power capacity (kW)
Figure 5: Monthly average energy input, temperature, and updraft flow velocities of the CSCPP and SSCPP.
Month in the year CSCPP-pressure SSCPP-efficiency SSCPP-pressure CSCPP-power CSCPP-efficiency SSCPP-power
Figure 6: Pressure, efficiency, and power capacity of the CSCPP and SSCPP in each month.
1000 W/m2 , the upwind velocity at the chimney base is 15 m/s and the temperature increase through the collector under noload conditions reaches 20 K. The temperature, velocity, and pressure fields of the simulated CSCPP are shown in Figure 4. And the comparison of the reported and simulated results is shown in Table 3. Through Figure 4 and Table 3, good quantitative agreements are observed between the experimental and the CFD results. Correspondingly, the built numerical model is ready to simulate the SCPP performance at other conditions. 3.2. Performance Comparison of SCPPs. The monthly average solar radiation on the horizontal and the slope, the CSCPP and SSCPP airflow temperature increase, and the updraft wind velocities are presented in Figure 5. It is
Table 3: The comparison of the numerical result and the experimental data. Source Experimental data Fluent result
Temperature increase 20 K 21.5 K
Upwind velocity 15 m/s 14.33 m/s
observed from the figure that the SSCPP solar collector with MSR angle receives much higher radiation from January to March and from September to December than the CSCPP’s does, leading to much higher energy absorption through the year (see Figure 3). Due to the different energy absorption, the temperature increases of the CSCPP and SSCPP also differ with each other. The solar radiation is found to be the major influence on the temperature, and the ambient temperature is the minor factor. The airflow velocities are observed to have similar tendency as the temperature increases for CSCPP and SSCPP, respectively. The tendencies of velocity and temperature fluctuation are similar to the solar radiation distribution in the year. The temperature rise and the airflow velocity of the SSCPP are much steadier than those of the CSCPP. The power, efficiency, and pressure of the CSCPP and the SSCPP are shown in Figure 6. The power and efficiency of the SSCPP are much higher than those of the CSCPP. Possible reason is that the SSCPP effective height is a result of the collector height and the chimney height. As for the SSCPP, its chimney height is the same as that of the CSCPP but it still holds the positive effect of the collector height, which we think generates a larger pressure difference and also contributes more to the updraft airflow. 3.3. CSCPPs and SSCPPs Inner Performance Comparison. Figure 7 shows the comparison of the temperature, pressure, and velocity distributions of the referred CSCPP and SSCPP in September. It is found from the figure that the solar radiation and airflow temperature of the CSCPP and the SSCPP are almost the same in September. Also, it can be observed that the velocity and pressure of the SSCPP are much higher than those of the CSCPP in the chimney at the same location. The temperature increase in the collectors of the CSCPP and SSCPP is similar because of the same input radiation (see Figure 5). An obvious eddy is found at the connection of the collector and chimney, where the turbine is practically constructed. Further optimization is needed for the SSCPP to weaken the airflow turbulence. 3.4. Effects of the Chimney Height on SSCPPs. In order to make the effective height of the SSCPP clear, three SSCPPs whose chimney heights are 60 m, 98 m and 194.6 m, respectively, are compared under the same boundary conditions. A CSCPP with the chimney height being 194.6 is set as the reference. The pressure fields of the four SCPPs are presented in Figure 8. The collector and chimney heights of the four referred SCPPs are summarized in Table 4. It is found from Figure 8 that the SSCPP with the chimney height of 98 m holds similar pressure field in the chimney and similar effective pressure to the reference CSCPP. By
6
The Scientific World Journal 316 312
300 304
300
306
302
304 302
308 312
300
300
300 302
302
304
Temperature
308
304
296 292
(a)
18 16 12 8
12
6 4
6 10 64
7
2 0
2
6
10 6
1817 16 14 12 11 3
Velocity-magnitude
14
−70
0 −10 −20 −30 −40 −50 −50 −60 −70 −80 −90 −100 −110 −120 −130
−60
−80 −90 −100 −110 −120 0 −70 −−1800 50 −40− −20 −10 −80 0 −60 −30 −10
0
Pressure
(b)
(c)
Figure 7: Comparison of the CSCPP and the SSCPP inner detail performance (temperature unit: K, velocity unit: m/s, and pressure unit: Pa).
analyzing Table 4, it is further observed that the SSCPP effective pressure is a function of (𝐻col /2+𝐻chi ), which agrees well with the analytical results reported by Bilgen and Rheault [10].
Table 4: Collector and chimney heights of the four SCPPs. 𝐻col (m) 0 193.5 193.5 193.5
𝐻chi (m) 194.6 60 98 194.6
𝐻col /2 + 𝐻chi (m) 194.6 156.75 194.75 261.35
Δ𝑃𝑡 (Pa) 68.5 42.8 62.1 112.7
4. Conclusions
No. c a b d
The inner detail performances of the CSCPP and SSCPP are compared through the numerical solution in this paper. Comparison analyses are also carried out to the SSCPPs with different chimney heights. Results indicate that the SSCPP holds much smoother performance than the CSCPP
throughout the year. The effective pressure in the SSCPPs is a function of (𝐻col /2 + 𝐻chi ). An obverse airflow eddy is observed at the connection of the solar collector and the
The Scientific World Journal
7
200
200
200 180
200 0 −10
−10
160 150
150
150 140 120
100
100
0
−10
−30
− 40 −50 −70 0
0
(a)
0
−30
−30 100 −40
−40
−50
−50
−20 −20
50
−30
0
80 60
−20 −50 0 −1
−20
100
−10
50
−20
0 (b)
50 40
−60 −70
−60
−80 −100 −120
20 0
−70 0 (c)
0
0
0 (d)
Figure 8: Inner pressure field comparison of four SCPPs with different chimney heights (pressure unit: Pa).
chimney in the SSCPP. Further optimization work is then suggested by the authors with the purpose of averaging the pressure distribution at the chimney section.
Acknowledgments This research was funded by the National Natural Science Foundation of China (no. 50506025) and Programme for New Century Excellent Talents in University (no. NCET-080440).
References [1] F. Cao, L. Zhao, H. S. Li, and L. J. Guo, “Performance analysis of conventional and sloped solar chimney power plants in China,” Applied Thermal Engineering, vol. 50, pp. 582–592, 2013. [2] J. Lorenzo, “Las Chimneas solares: de una propuesta espanola en 1903 a de Mansanares,” http://www.fotovoltaica.com/chimenea.pdf. [3] H. G¨unther, Hundred Years-Future Energy Supply of the World, Franckhsche Verlagshandlung, Stuttgart, Germany, 1931. [4] W. Haaf, “Solar chimneys, part II: preliminary test results from the Manzanares pilot plant,” International Journal of Solar Energy, vol. 2, no. 2, pp. 141–161, 1984.
[5] W. Haaf, K. Friedrich, G. Mayr, and J. Schlaich, “Solar chimneys, part I: principle and construction of the pilot plant in Manzanares,” International Journal of Solar Energy, vol. 2, no. 1, pp. 3–20, 1983. [6] N. Pasumarthi and S. A. Sherif, “Experimental and theoretical performance of a demonstration solar chimney model-part I: mathematical model development,” International Journal of Energy Research, vol. 22, no. 3, pp. 277–288, 1998. [7] N. Pasumarthi and S. A. Sherif, “Experimental and theoretical performance of a demonstration solar chimney model, part II: experimental and theoretical results and economic analysis,” International Journal of Energy Research, vol. 22, no. 5, pp. 443– 461, 1998. [8] J. P. Pretorius and D. G. Kr¨oger, “Critical evaluation of solar chimney power plant performance,” Solar Energy, vol. 80, no. 5, pp. 535–544, 2006. [9] X. Zhou, J. Yang, B. Xiao, and G. Hou, “Experimental study of temperature field in a solar chimney power setup,” Applied Thermal Engineering, vol. 27, no. 11-12, pp. 2044–2050, 2007. [10] E. Bilgen and J. Rheault, “Solar chimney power plants for high latitudes,” Solar Energy, vol. 79, no. 5, pp. 449–458, 2005. [11] F. Cao, L. Zhao, and L. Guo, “Simulation of a sloped solar chimney power plant in Lanzhou,” Energy Conversion and Management, vol. 52, no. 6, pp. 2360–2366, 2011. [12] T. Ming, W. Liu, and G. Xu, “Analytical and numerical investigation of the solar chimney power plant systems,” International Journal of Energy Research, vol. 30, no. 11, pp. 861–873, 2006.
8 [13] T. Z. Ming, W. Liu, G. Xu et al., “Numerical simulation of the solar chimney power plant systems coupled with turbine,” Renewable Energy, vol. 33, no. 5, pp. 897–905, 2008. [14] H. Pastohr, O. Kornadt, and K. G¨urlebeck, “Numerical and analytical calculations of the temperature and flow field in the upwind power plant,” International Journal of Energy Research, vol. 28, no. 6, pp. 495–510, 2004. [15] T. Chergui, S. Larbi, and A. Bouhdjar, “Thermo-hydrodynamic aspect analysis of flows in solar chimney power plants—a case study,” Renewable and Sustainable Energy Reviews, vol. 14, no. 5, pp. 1410–1418, 2010. [16] X. Zhou, J. Yang, B. Xiao, G. Hou, and Y. Wu, “Numerical investigation of a compressible flow through a solar chimney,” Heat Transfer Engineering, vol. 30, no. 8, pp. 670–676, 2009.
The Scientific World Journal