described by the conservation equations of mass and momentum for the ... impuls, voor zowel de vaste fase (het zand) als voor de fluïde fase (het water), is in.
NUMERICAL SIMULATION METHODS FOR DENSE‐PHASE DREDGING FLOWS
B.J. Konijn Universiteit Twente, Enschede, The Netherlands
Numerical simulation methods for dense‐phase dredging flows B.J. Konijn Printed by Thesis University of Twente, Enschede, The Netherlands ISBN 978‐90‐365‐4167‐1 DOI 10.3990/1.9789036541671 Copyright © 2016 by B.J. Konijn
NUMERICAL SIMULATION METHODS FOR DENSE‐PHASE DREDGING FLOWS PROEFSCHRIFT ter verkrijging van de graad van doctor aan de Universiteit Twente, op gezag van de rector magnificus, Prof. dr. H. Brinksma, volgens besluit van het College voor Promoties in het openbaar te verdedigen op woensdag 31 augustus 2016 om 14:45 uur door Bartholomeus Johannes Konijn Geboren op 4 september 1984 te Hoorn, Nederland
Dit proefschrift is goedgekeurd door de promotor: prof. dr. ir. H.W.M. Hoeijmakers en de co‐promotor: dr. ir. N.P. Kruyt
SUMMARY Dredging is the process of excavation of sediment, usually carried out underwater, with the purpose of the collection of the excavated sediment, such as sand, and subsequently its disposition at another location. Dredging is often carried out by ships, storing the sediment in a large hold called a hopper. A sand‐water mixture is taken from the bottom of the dredging site and pumped into the hopper. In order to be able to predict the performance of dredging equipment, such as dredging pumps and hoppers, a two‐phase numerical flow simulation method has been developed for conditions for which the volume fraction of the solid volume fraction (sand) is high. The method is based on the equations for the two‐fluid model. The flow field is described by the conservation equations of mass and momentum for the solid phase (sand) and for the fluid phase (water), in combination with constitutive relations that describe the behaviour of the sand‐water mixture. The parameters that need to be described by the constitutive relations are: the (dynamic) viscosity of the fluid and that of the solid phase. Furthermore, relations are required for the momentum transfer between the two phases, the inter‐ particulate stresses and a turbulence model. The present work focussed on the (dynamic) viscosity of the fluid phase and that of the solid phase as well as the inter‐ particulate stresses. The model for the interparticle stresses is especially important, as nearly static particle beds of sand may form inside dredging equipment. The viscosity of suspensions has been analysed experimentally, utilizing a concentric cylinder rheometer. In the experimental work, carried out with neutrally buoyant particles, parameters that determine the behaviour of the suspension have been varied, using the same particulate and liquid material for all experiments. The solid volume fraction, particle diameter, liquid viscosity, and shear rate, have been varied systematically. The numerical simulation method has been implemented in a commercial CFD code Ansys CFX 14.0 through user functions for the constitutive relations. An investigation has been carried out into a model for the particle pressure, required to model the formation of a particle bed when the volume fraction of the particles reaches its maximum obtainable value. Models for the particle pressure available in literature often result in instability of the numerical solution procedure. A systematic study has been carried out to enhance numerical stability of the model for the particle pressure. Numerical simulations on sedimentation in a sedimentation column have been performed, in order to assure that the constitutive relation for the momentum transfer predicts the correct sedimentation velocities and that the model for the particle pressure predicts the formation of a particle bed.
As an example of the application of the developed simulation method, the flow in a hopper during the filling process is considered. Because of the difference in density between sand and water, the sand sinks to the bottom of the hopper. Near the top of the hopper the water is spilled in an overflow and subsequently disposed overboard. The spillage through the overflow preferably contains a small amount of sand. Not only because it is a waste of energy to excavate particles first and discharge them overboard later, but also because a large amount of sand in the overflow can affect marine life adversely. The flow simulation method also provides estimates of the spillage through the overflow. Numerical simulations of the flow inside a geometry representative for a hopper have been performed. A parameter study has been carried out by varying the flow conditions at the inlet of the hopper: velocity at the inlet, solid volume fraction at the inlet and particle diameter of the incoming suspension. The results show how these parameters affect the filling curve of the hopper, defined as the total mass of sand present inside the hopper as function of time.
SAMENVATTING Baggeren omvat alle werkzaamheden die nodig zijn voor het opgraven van sediment, meestal onder water, met als doel het verzamelen van het opgegraven sediment (bijvoorbeeld zand), om dit vervolgens af te voeren naar een andere locatie. Het baggeren wordt vaak uitgevoerd door een schip, waarbij het zand wordt opgeslagen in een grote ruimte binnenin het schip, de zogenaamde beun. Een zand‐ watermengsel wordt van de bodem op de baggerlocatie opgezogen en door middel van een zuigbuis naar de beun gevoerd. Om de prestaties van de baggerapparatuur, zoals pompen en beunen, die tijdens het baggeren gebruikt wordt te voorspellen, is een numeriek twee‐fase stromingsmodel ontwikkeld. Dit model kan gebruikt worden voor situaties met hoge concentraties zand. Een numerieke simulatiemethode, gebaseerd op behoudswetten van massa en impuls, voor zowel de vaste fase (het zand) als voor de fluïde fase (het water), is in dit werk gebruikt voor het voorspellen van het gedrag van zand‐watermengsels met grote volumefracties zand. Zowel de behoudswetten als de constitutieve relaties, die het materiaalgedrag van zand‐watermengsels beschrijven, zijn geanalyseerd. De geschikte constitutieve relaties zijn geïmplementeerd in het twee‐fluïdum model. Deze constitutieve relaties beschrijven de (dynamische) viscositeit van de fluïde en die van de vaste fase. Verder zijn er relaties nodig voor de impulsoverdracht tussen beide fases, de deeltjesspanningen en het turbulentiemodel. In dit werk ligt de focus op het beschrijven van de dynamische viscositeit en de deeltjesspanningen. Het model voor de deeltjesspanningen is belangrijk, omdat dit model de vorming van een vast bed van deeltjes kan voorspellen, dat binnenin de baggerapparatuur kan ontstaan. De viscositeit van suspensies is experimenteel onderzocht, met behulp van een concentrische reometer. In de experimenten, die zijn uitgevoerd met zwevende deeltjes, is een parameterstudie uitgevoerd naar de viscositeit van de suspensie. Hierbij zijn het deeltjesmateriaal en de tussenliggende vloeistof telkens gelijk genomen, en zijn de volumefractie van de deeltjes, de viscositeit van de tussenliggende vloeistof, de deeltjesdiameter en de afschuifsnelheid op systematische wijze gevarieerd. De numerieke sedimentatiemethode is geïmplementeerd in een commercieel verkrijgbare CFD‐code Ansys CFX 14.0 door het gebruik van zogenaamde ‘user defined functions’. Het model voor de deeltjesdruk is onderzocht. Dit model is nodig om de formatie van een vast bed, dat ontstaat als de volumefractie van de deeltjes erg hoog wordt, te voorspellen. Modellen voor de deeltjesdruk die zijn gevonden in de literatuur resulteren vaak in numeriek instabiel gedrag tijdens de numerieke simulaties. Een systematische analyse naar de beschrijvende parameters binnen het
model voor de deeltjesdruk is uitgevoerd, met als doel de numerieke stabiliteit van de rekenmethode te vergroten. Ook zijn numerieke simulaties van sedimentatie in een sedimentatiekolom uitgevoerd om vast te stellen of de constitutieve relatie voor de impulsoverdracht de juiste sedimentatiesnelheid voorspelt en of het model voor de deeltjesdruk de formatie van een bed van deeltjes op de bodem van de sedimentatiekolom correct voorspelt. Numerieke simulaties van de stroming binnenin een geometrie, die representatief is voor een beun in een baggerschip, zijn uitgevoerd. Door het verschil in dichtheid van zand en water zinkt het zand naar de bodem van de beun. Bovenin de beun wordt het overtollige water afgevoerd via een overvloei, om het vervolgens overboord te storten. Het afgevoerde overtollige water bevat bij voorkeur zo min mogelijk zand, niet alleen omdat het inefficiënt is om het zand eerst van de zeebodem op te graven om het vervolgens weer overboord te storten, maar ook omdat het aanwezige zand in het afgevoerde water schadelijk kan zijn voor de flora en fauna op de baggerlocatie. Een parameterstudie is uitgevoerd, waarbij de geometrie steeds gelijk gehouden is en de stromingscondities bij de intrede van de beun, te weten de instroomsnelheid, de volumefractie van de deeltjes bij intrede en de diameter van de deeltjes in de suspensie, zijn gevarieerd. De resultaten geven de invloed van deze parameters op de vulkromme van de beun weer: de totale massa van het zand dat in de beun aanwezig is als functie van de tijd.
CONTENTS
1 INTRODUCTION
1
1.1 BACKGROUND 1.2 OBJECTIVES 1.3 OUTLINE OF THIS WORK
2 TWO‐PHASE FLOW THEORY 2.1 GOVERNING EQUATIONS 2.2 CONSTITUTIVE EQUATIONS 2.2.1 The stress tensor of the liquid phase 2.2.2 The stress tensor of the solid phase 2.2.3 Momentum transfer between the two phases 2.2.4 Turbulence modelling
3 VISCOSITY OF SUSPENSIONS
3.1 LITERATURE REVIEW 3.2 EXPERIMENTAL METHODS 3.2.1 Concentric‐cylinder rheometer 3.2.2 Materials 3.2.3 Measurement procedure 3.2.4 Gap width and wall roughness 3.3 RESULTS AND DISCUSSION 3.3.1 Effect of solid volume fraction 3.3.2 Effect of particle diameter 3.3.3 Effect of particle‐size distribution 3.3.4 Maximum solid volume fraction 3.3.5 Shear thinning behaviour 3.3.6 Discussion 3.4 CONCLUSIONS
4 NUMERICAL APPROACH
4.1 DISCRETIZATION METHOD 4.2 NUMERICAL PROCEDURE AND IMPLEMENTATION
5 RESULTS NUMERICAL SIMULATIONS
9
33
63 69
1 4 7 11 12 12 15 21 27 34 38 38 40 41 43 44 45 48 51 53 54 60 61 63 66
ix
5.1 SEDIMENTATION 5.1.1 Flow solution 5.1.2 Models for the static particle pressure 5.1.3 Numerical setup 5.1.4 Results 5.1.5 Concluding remarks 5.2 SIMULATIONS OF FLOW INSIDE A HOPPER 5.2.1 Geometry description and boundary conditions 5.2.2 Performance parameters 5.2.3 Parameter variations 5.2.4 Flow solution 5.2.5 Parameter variations 5.2.6 Flow modelling 5.2.7 Concluding remarks
69 70 72 75 76 97 98 99 101 103 107 125 138 148
6.1 CONCLUSIONS 6.1.1 Governing equations 6.1.2 Constitutive equations 6.1.3 Simulations of sedimentation 6.1.4 Simulations of flow inside a hopper 6.2 RECOMMENDATIONS 6.2.1 Governing equations and constitutive equations 6.2.2 Numerical implementation 6.2.3 Numerical simulations 6.2.4 Validation experiments
151 152 152 154 154 156 156 156 157 157
6 CONCLUDING REMARKS AND RECOMMENDATIONS 151
7 BIBLIOGRAPHY 8 APPENDICES
159 167
APPENDIX A THE AVERAGED EQUATIONS FOR TWO‐PHASE FLOW 168 Local instantaneous equations and jump conditions 168 Averaging procedure 169 Material derivative of the phase indicator function 170 Averaged equations 172 Alternative derivation 174 APPENDIX B CONSTITUTIVE MODELS FOR THE STRESS TENSORS AND THEIR VISCOSITIES 177 Derivation of the viscosities of the different phases for dilute suspensions 179 Alternative derivation 187 Summary 188
x
APPENDIX C IMPLEMENTATION OF THE USER DEFINED FUNCTIONS IN THE NUMERICAL 189 MODEL Momentum transfer due to drag 189 Momentum transfer due to virtual mass 190 Suspension viscosity 190 Solid particle pressure 190 Particle stresses 191
9 ACKNOWLEDGEMENTS
193
xi
1 INTRODUCTION 1.1 Background Dredging is the process of excavation of sediment, usually carried out underwater, with the purpose of the collection of the excavated sediment, such as sand, and subsequently its disposition at another location. Dredging is often carried out by ships, storing the sediment in a large hold called a hopper. Often, the sediment at the bottom of the sea or river is collected with a suction pipe, which is trailed behind the ship. Hence, these ships are called trailing suction hopper dredgers. Sometimes it is required to cut the material loose from the bottom by a cutting mechanism, before the sediment can be sucked up. Ships which employ this mechanism are called cutter suction hopper dredgers. Many types of dredging equipment exist, such as cutters, hoppers, pumps and pipes, and many of them involve fluid mechanics. In the present work a numerical simulation method has been developed for predicting flows in and around such equipment. A mixture of sediment and water enters the hopper. Because of the density difference between sand and water the sand sinks to the bottom of the hopper. Near
Introduction
1
the top of the hopper the water is spilled in an overflow and subsequently disposed overboard.
Figure 1.1: A hopper dredger during the filling process, picture taken from www.eshiptrading.com/ship/d/165/5998 (5‐5‐2016).
A useful test‐case for a numerical simulation method for dredging flows is the modelling of the filling process of a hopper. Figure 1.1 shows the hopper within the hull of the ship, where the sand‐water mixture is inserted into the hopper through inlets at the side walls. On the right‐hand side the overboard spillage through the overflow is visible. The spillage through the overflow preferably contains only a small amount of sand. Not only because it is a waste of energy to excavate particles first and discharge them overboard later, but also because a large amount of sand can affect marine life adversely. The sand inside the spillage can result in large volumes of water containing sand from the overflow (see Figure 1.2), surrounding the dredging ship. These volumes are known as overflow plumes which can cover large areas. A numerical simulation method for dense‐phase dredging flows that is able to predict the filling process and the spillage through the overflow can be used to improve the design of the hopper, resulting in smaller overflow losses.
2
Introduction
Figure 1.2: Two hopper dredgers operating in the port of Perth, Australia, picture taken from dredgingresearchcollaborative.com/works/dredge (5‐5‐2016).
A numerical simulation method for dense‐phase dredging flows should be able to describe the motion of water and sand during the filling process of a hopper and to predict the formation of a stationary bed of particles on the bottom of the hopper. Such a simulation method will also be applicable to the flow in other dredging equipment, such as pumps and pipes. With such a simulation method, detailed information on the flow inside such equipment is obtained. This information can be employed to improve the design of dredging equipment. For example, when the simulation method is applied to the flow inside a hopper geometry, the flow solution will provide the filling curve; the amount of sand that remains inside the hopper as a function of time. It can be investigated how the parameters that determine the flow, such as particle diameter, velocity at the inflow, and solid mass fraction at the inlet, influence the flow solution and hence the filling curve of the hopper.
Introduction
3
1.2 Objectives In order to develop a numerical simulation method that is able to model sand‐water mixtures with high sand volume concentrations, an appropriate set of governing equations that describes the flow has to be formulated. This method has to be able to model the flow of the sand‐water mixture correctly, which incorporates the prediction of the sedimentation of the particles and the formation of a stationary bed of particles at the bottom of a hopper. The appropriate constitutive equations, which describe the material behaviour, have to be based on information in literature, or have to be determined experimentally.
Governing equations
Constitutive equations
Numerical simulation method
Figure 1.3: General procedure to obtain a numerical simulation method.
A general procedure to obtain a numerical simulation method is shown in Figure 1.3. Firstly, appropriate governing equations have to be formulated, which can be obtained from the principles of conservation of mass and momentum. Subsequently, constitutive equations, which prescribe the material behaviour of the sand‐water mixture, have to be included in the governing equations. The governing equations and constitutive equations will be discretized and together with the appropriate boundary conditions and initial conditions, this will result in a numerical simulation method. With the resulting numerical method, simulations of the flow inside a hopper will be considered and the influence of the input parameters on the filling process of the hopper will be analysed. A global introduction on the treated subjects in this work is given here. The models and corresponding literature will be described in more detail in the corresponding chapters.
4
Introduction
Since the dimensions of a hopper are very large and there are billions of particles present inside the flow, both water and sand are described here as continua, with their own equations for conservation of mass and momentum; the so‐called two‐ fluid model. The literature on the governing equations of the two‐fluid model is vast. Derivations of averaged equations for two‐phase flows can be found, for example, in Anderson and Jackson (1967), Drew (1983), Zhang and Prosperetti (1994), Enwald et al. (1996), Drew and Passman (1999), Jackson (2000), Brennen (2005). The appropriate set of equations that can be used to describe sand‐water mixtures has been distilled from this literature. The two‐fluid model is widely used for the simulation of flow inside fluidized beds (see van der Hoef et al. (2008)); a gas‐solid flow in which the density of the particles is much higher than the density of the gas, and the (dynamic) viscosity of the gas is negligible. A closure model based on these properties that is extensively studied in literature is the so‐called ‘granular temperature’ closure, which makes use of these properties but is not (directly) applicable here, since the interstitial fluid between particles is a high‐density liquid instead of a low‐density gas, decreasing the velocity fluctuations of the particles. Therefore, alternative methods to close the system of equations have to be applied. The viscous regime of dilute suspensions has been addressed by Einstein (1906). It has been extended towards the regime of non‐dilute suspensions by many authors since, mainly by empirical relations based on experiments, for example by Eilers (1941) and Vand (1948), and more recently by Koos (2009). In the present work the dynamic viscosity of suspensions will be investigated experimentally as well. The aim of this investigation is to identify the causes of the differences between previous experimental work by variation of the properties of the suspension in a systematic way. The sedimentation of particles, caused by the density difference between fluid and solid phase, has been subject of investigation for a long time. The empirically determined sedimentation rates of Richardson and Zaki (1954) are still widely used. Recently, new drag relations between two phases have been formulated by Tenneti et al. (2011) and Beetstra et al. (2007), that are based on numerical flow simulations. These relations have been used in the present work. The formation of a particle bed is governed by particle‐particle contacts. Bagnold (1954) was one of the first to distinguish between a viscous flow regime, in which the flow behaviour is determined by the behaviour of the sand‐water mixture as a whole, and a granular flow regime, in which the behaviour of the sand‐water mixture is determined by particle‐particle contacts. Recent work still builds on these
Introduction
5
principles. Particle‐particle contacts result in normal stresses and shear stresses between the particles. Various relations, based on numerical or experimental work, for example Boyer et al. (2011), Jop et al. (2006) and Pouliquen et al. (2006), describe such relations. In a study of flows inside dredging pumps, Kolkman (2009) considered a largely "standard" two‐fluid model in the commercial CFD‐code CFX. The interphase drag is described by the Gidaspow model (Gidaspow (1994)). A standard k‐ turbulence model has been adopted. A model for interparticle stresses has not been included. The Kunitz relation (Kunitz (1926)) for the suspension viscosity was used. With this model the flow inside a single impeller channel of a dredging pump has been computed. Computational results have been compared with measurements by Ni et al. (1999). As only the flow in a single impeller channel (rather than in the complete pump) was simulated for computational reasons, only a qualitative comparison is possible. The performance of a pump is often expressed by the 'head', i.e. the elevation over which a liquid can be pumped up. The comparison between experiments and simulations by Kolkman (2009) focussed on the reduction factor for the head, i.e. the ratio between the head of the pump transporting a water‐sand mixture over the head of a pump transporting clean water. For low solid volume fractions (up to 0.15), the computed reduction factor for the head becomes smaller with increasing solid volume fraction, in agreement with the experimental results. For a solid volume fraction of 0.15, the computed reduction in head becomes smaller with increasing particle diameter, also in agreement with the measurements. However, for solid volume fractions larger than 0.15, the simulations predict an increase in the reduction factor for the head with increasing solid volume fraction (so a behaviour that is closer to that of a pump transporting clean water), in disagreement with the measurements that show a continuing decrease of the reduction factor for the head with increasing solid volume fraction. Hence, with the "standard" model in CFX it is possible to predict the performance of this dredging pump, in a qualitative sense, for low solid volume fractions. However, for high solid volume fractions, the behaviour of the flow of water‐sand mixtures is insufficiently well described by the "standard" model in CFX, at least in this study of flows in a dredging pump. These results form a motivation for the current study that focusses on flows at high solid volume fractions. The governing equations and constitutive equations will be discretized, and together with the appropriate boundary conditions and initial conditions they will be used to simulate the flow inside a hopper. The properties of the sand‐water mixture entering the hopper, such as the diameter of the particles, the volume
6
Introduction
fraction of the sand and the velocity at the inlet will be varied in order to investigate their influence on the flow inside the hopper and thus the flow at the overflow. Models to estimate the filling process of a hopper have been given by Dobbins (1944), Camp (1946), Groot (1981) and Vlasblom and Miedema (1995). These models are based on a two‐dimensional advection‐diffusion equation for a sand‐ water mixture. The filling characteristics are based on estimations for the horizontal and vertical velocity components. Empirical relations have been added for the influence of turbulence and erosion on the diffusion and advection. In the present work it is investigated whether the filling process can be estimated with the use of a two‐fluid model. The flow solutions are compared in a qualitative way with experiments on the filling process of a hopper geometry by Van Rhee (2002).
1.3 Outline of this work In chapter 2 of this thesis the formulation of the governing equations for two‐phase flow is studied and the different models available in literature are compared. In this chapter also various aspects of the constitutive equations are discussed. In chapter 3 the present experimental work on measurements of viscosity of suspensions is presented. In chapter 4 the numerical method is formulated and in chapter 5 the numerical method is tested and the results of a parameter study on the filling process of a hopper geometry are presented. Finally, the conclusions of this work and the recommendations for future study are given.
Introduction
7
2 TWO‐PHASE FLOW THEORY In this chapter, the governing equations that describe two‐phase flow are presented, as well as the constitutive equations that are needed to close the set of equations. This set of equations describes the flows of fluids containing a large number of particles, such as industrial sand‐water flows. Because such flows can contain billions of particles per cubic metre, it is not feasible to follow the motion of each particle individually. Therefore, particles together are treated as a separate phase, each described with its own continuity equation and momentum equations. This approach is known as the two‐fluid model, the Eulerian two‐phase flow model, or the Euler‐Euler model. This approach is used in present work.
Two‐Phase Flow Theory
9
Integral balances of mass and momentum
Gauss’ and Leibniz’ theorems Local instantaneous equations and jump conditions Averaging procedure Averaged equations Closure equations Closed set of partial differential equations Boundary conditions and initial conditions Two �luid model Figure 2.1: General procedure for the derivation of a two‐fluid model. Scheme after Enwald et al. (1996).
Figure 2.1 shows the general procedure to derive a two fluid model. In the first steps of this scheme the averaged continuity and momentum equations are derived. These steps are elaborated in Appendix A. The averaged equations, obtained after an averaging procedure, are summarized in section 2.1. The closure of the equations is accomplished by constitutive equations. These are given in section 2.2.
10
Two‐Phase Flow Theory
2.1 Governing equations The averaged equations are derived from the microscopic equations by an averaging procedure. Here, the equations are based on a Newtonian fluid containing solid particles. The governing equations for two‐phase flow can be derived from the assumption that each phase can be treated as a continuum. When a flow contains a large number of particles, it is not feasible to consider all particles individually and to track all interfaces separating both phases. In order to be able to model such a flow, the microscopic Navier‐Stokes equations need to be rewritten into averaged, macroscopic equations. This is accomplished by an averaging procedure. Derivations of averaged equations for two‐phase flows can be found in Anderson and Jackson (1967), Drew (1983), Zhang and Prosperetti (1994), Enwald et al. (1996), Drew and Passman (1999), Jackson (2000), Brennen (2005). The averaging procedure results in continuity equations and momentum equations for each of the two phases, containing averaged flow variables. Details of the averaging procedure are summarized in Appendix A. The flow considered here, consists of a fluid phase, denoted by subscript f and a solid phase, denoted by subscript s. The sum of the volume fractions and , of fluid and solid, respectively, equals one: 1. (2.1) The averaged continuity equation for each phase reads:
⋅
(2.2)
0.
Here, subscript k represents fluid phase f, or solid phase s. In this equation, the density and velocity are macroscopic, averaged variables. The averaged momentum equations are given by:
⋅
(2.3)
∙
,
→
⋅
(2.4)
∙
→
.
All variables in these equations are averaged variables. is the stress tensor and is a Reynolds stress‐like tensor based on the velocity fluctuations of the phase. The term represents the body force due to gravity , and → is the momentum transfer between the two phases.
Two‐Phase Flow Theory
11
2.2 Constitutive equations The equations at hand are the two continuity equations, equations for conservation of momentum in x‐, y‐, and z‐direction and the equation that states that the sum of the volume fractions of the phases equals one. This gives 9 equations in total. For each phase, the volume fraction , density ,velocities and the stress tensors and are to be determined. Another unknown is the momentum transfer between the two phases, → . Since the number of unknowns exceeds the number of equations, additional equations are needed for closure of the system of equations. This is usually accomplished by prescribing the stress tensors and momentum transfer in terms of the other flow variables by constitutive equations. The following unknowns need to be modelled by constitutive equations: Section 2.2.1: The stress tensor of the liquid phase . Section 2.2.2: The stress tensor of the solid phase . Section 2.2.3: The momentum transfer between the two phases → . Section 2.2.4: The Reynolds stress‐like tensors and .
2.2.1 The stress tensor of the liquid phase The constitutive relation for the stress tensor of the liquid phase is given by :
̿
2 3
2
(2.5)
.̿
∙
Here, ̿ is the second‐order identity tensor and is the rate of strain tensor. It is defined as:
1 2
(2.6)
.
Stokes’ hypothesis has been used in equation (2.5). Note that the trace of is equal to the pressure . Equation (2.5) requires a constitutive model for the viscosity of the fluid phase . The viscosity of the suspension as a whole, , is frequently described in literature. It is often modelled to be a function of the volume fraction of the solid phase and the maximal volume fraction of the solid phase , . In the present work the relation of Krieger and Dougherty (1959) is used:
For 0
,
,
,
1
, ,
.
(2.7)
is the viscosity of the liquid, i.e. the fluid viscosity in absence of particles, is the maximal volume fraction of the solid phase. The ratio of the suspension , viscosity and the viscosity of the liquid is known as the relative viscosity .
Here
12
Two‐Phase Flow Theory
A literature review on various models for the relative viscosity can be found in chapter 3. Chapter 3 also gives results of measurements on the suspension viscosity . The results of measurements reported in chapter 3 show that when the viscosity of the suspending liquid is low, the maximum volume fraction of the solid phase , , has to be chosen in the range 0.52‐0.57. In the present work, , 0.55 is used.
Relative viscosity rel (‐)
20
15
rel,KD f rel,KD s rel,KD rel,Einstein
10
5
0 0
0.1
0.2
0.3
0.4
Volume Fraction s (‐)
0.5
Figure 2.2: The relative viscosity by Krieger and Dougherty (1959), with , . , and the proportions assigned to the fluid and solid phase, also the (linear) relation for the relative viscosity by Einstein (1906), valid for very dilute suspensions, , is shown.
The viscosity of the fluid phase and that of the solid phase have to be defined in such a way that . In present work, this is assured by equating viscosities and to the suspension viscosity . The proportions of the relative viscosity assigned to the fluid and solid phase, and , , , respectively, are shown in Figure 2.2. Ferrini et al. (1979) measured the viscosity of suspensions with a solid volume fraction 0.462 during sedimentation. They compared the measured viscosities with measurements on a cone and plate rheometer as well as a concentric cylinder rheometer and showed that the sedimentation of the particles during shear does not influence the relation between solid volume fraction and relative viscosity of the
Two‐Phase Flow Theory
13
suspension. These results suggest that relations for relative viscosity of a suspension obtained by experiments with neutrally buoyant particles can also be used in flows in which sedimentation is present and that no strong correlation exists between drag and effective viscosity of the suspension. However, this will only be the case for situations for which no strong gradients of the shear rate will be present. This will be described in the next section.
14
Two‐Phase Flow Theory
2.2.2 The stress tensor of the solid phase The stress tensor of the solid phase is given by:
̿
(2.8)
̿ .
Pressure and shear stress tensor τ are usually split into two components. Each of them has one component related to the suspension as a whole and one component related to particle‐particle interactions. The pressure is usually split into a hydrodynamic pressure, assumed to be equal to the pressure , shared with the fluid phase, and a solid pressure , describing the inter‐particulate forces. Similarly, the shear stress tensor ̿ is split up into a part related to the suspension ̿ , and a part related to inter‐particulate shear stresses ̿ , . (2.9) ̿ ̿
̿
̿
,
,
.
The part of the shear stress tensor related to the suspension is given by:
̿
2 3
2
,
∙
(2.10)
.̿
Here viscosity equals the viscosity of the suspension as a whole, . Shear stresses in the solid phase are always present, also when the suspension is dilute, this is shown in Appendix B. The rheology of suspensions with a solid volume fraction close to that of the maximum packing fraction cannot be described by the hydrodynamic pressure and the suspension viscosity only. Because of the high solid volume fraction, particle‐ particle collisions play an important role, resulting in particle shear stresses and particle normal stresses. The particle stresses are present in the momentum equation of the solid phase inside the terms and ̿ , . The particle normal stresses can be split into a static component and a dynamic component: (2.11) .
,
,
is discussed in section 2.2.2.1. The dynamic The static particle pressure , particle pressure is discussed in section 2.2.2.2.
Two‐Phase Flow Theory
15
2.2.2.1 Static particle pressure The static particle pressure represents the forces between the particles when they are packed closely together, i.e. close to the maximum volume fraction , . This static particle pressure can be modelled as a function of the volume fraction , see for example Gidaspow and Ettehadieh (1983), Gidaspow and Syamlal (1985) Bouillard et al. (1989), and Chauchat et al. (2013): (2.12) .
,
The gradient of the particle pressure is often implemented directly in the governing equations by taking the gradient of equation (2.12):
,
,
(2.13)
.
≡
is called the modulus of elasticity (Gidaspow (1994)). A form proposed in literature for this modulus of elasticity is: ∗ (2.14)
.
Values for , C, and ∗ need to be determined empirically. The models by Gidaspow and Ettehadieh (1983), Gidaspow and Syamlal (1985) and Bouillard et al. (1989) all take the form of equation (2.14) and are shown in Figure 2.3. Note that the vertical axis of Figure 2.3 is logarithmic and the modulus of elasticity increases exponentially with increasing volume fraction . Another formulation for the particle pressure is proposed by Chauchat et al. (2013): ∗
It can also be cast in the form
∗
,
,
,
0. ∗
,
(2.15)
.
by writing
,
∗
,
∗
as:
.
(2.16)
Figure 2.3 shows the elasticity modulus G for ζ 3, 1 ∙ 10 Pa and ∗ 0.40. With these constants, G has a quadratic dependence on the volume fraction . Two different particle pressure models are compared in section 5.1, the model by Gidaspow (1994) and the model by Chauchat et al. (2013). Both express the particle pressure as a function of the particle volume fraction. The effect of the different models on the numerical results is discussed in section 5.1.
16
Two‐Phase Flow Theory
Modulus of Elasticity G (Pa)
4
10
x 10
8 Gidaspow and Ettadieh (1983) Gidaspow and Syamlal (1985) Bouillard et al. (1989) Chauchat et al. (2013)
6 4 2 0 0
0.2
0.4
0.6
Solid Volume Fraction s (‐)
0.8
Static Particle Pressure (Pa)
10000
8000 Gidaspow and Ettadieh (1983) Gidaspow and Syamlal (1985) Bouillard et al. (1989) Chauchat et al. (2013)
6000 4000 2000
0
0.2
0.4
0.6
Solid Volume Fraction s (‐)
0.8
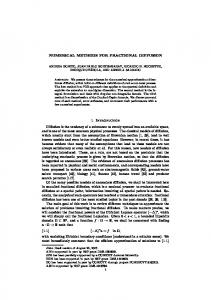
Figure 2.3: Solid modulus of elasticity G and static particle pressure , as a function of the volume fraction of the solid . The models that take the form of equation (2.14) . , , . Pa), Bouillard et al. are Gidaspow and Syamlal (1985) ( ∗ (1989) ( ∗ . , , . Pa) and Gidaspow and Ettehadieh (1983) ( ∗ . , , . Pa). The model by Chauchat et al. (2013) is given by equation Pa, ∗ . . (2.16) with , ∙
Two‐Phase Flow Theory
17
2.2.2.2 Dynamic particle pressure and particle stresses The pioneering work of Bagnold (1954) showed, based on dimensional analysis, that the particle normal stresses, are proportional to the particle density , particle diameter , and the square of the shear rate . In the inertial Bagnoldian regime the flow is characterized by a dimensionless number I, known as the inertial number:
(2.17)
,
,
The shear rate is defined as √ 2 : , in which is the strain rate tensor of the solid phase. Forterre and Pouliquen (2008) explain that the inertial number can be seen as the ratio of a microscopic time scale 1/ and a macroscopic time scale /√ , / . With the inertial number I, constitutive laws for particle shear stress ̿ , and particle normal stress can be constructed which have the form: (2.18) . ̿ ,
,
Here is called the friction coefficient. The shear stress ̿ , can be interpreted as the magnitude of the shear stress tensor ̿ , √ 1/2 ̿ , : ̿ , , see for can example Bird et al. (2007). An example of empirical relations for and be found in Pouliquen et al. (2006) and Jop et al. (2006).
,
,
,
,
,
,
,
(2.19)
.
20.9° , 32.76° and 0.279 are constants obtained Here, from experiments with glass beads with a diameter of 0.53 mm. The friction coefficient ( ) approaches the quasi‐static friction coefficient when the inertial number tends to zero (plastic regime) and approaches the (purely dynamic) friction coefficient for → ∞ (inertial regime). The solid volume fraction , 0.4 can be interpreted as a lower limit below which the particle pressure is zero. Boyer et al. (2011) extended the constitutive laws for granular flow with interstitial liquid for the case that the shear rate approaches zero, which they call the granular viscous regime. They show that for this situation the characteristics are governed by a dimensionless number J, called the viscous number:
18
,
,
Two‐Phase Flow Theory
(2.20)
Here is the viscosity of the liquid (in the absence of particles). In their experiments they show that for low shear rates the rheology can be described by . ̿, and Trulsson et al. (2012) combined the granular Bagnoldian regime and the granular viscous regime. They proposed a new dimensionless number K as a combination of the inertial number I and viscous number J given by . They showed that in their two‐dimensional numerical simulations the rheology of the suspension in both regimes can be described by the dimensionless number K with ̿ , and . Their fits for these two functions take the form: (2.21)
√ ,
,
and
1
(2.22)
.
,
Because the numerical simulations by Trulsson et al. (2012) are for the two‐ dimensional case, it is difficult to interpret their results quantitatively and translate them to the situation of three dimensional flow. However, their results show that it is possible to combine the viscous regime and the Bagnoldian inertial regime. In the present model, the viscous regime is already governed by the suspension viscosity, given by the relation of Krieger and Dougherty (1959) in equation (2.7). Therefore the relation given in equations (2.17) and (2.19) are used, which can also be written as:
,
,
,
(2.23)
.
,
2.2.2.3 Particle stresses The particle shear stresses ̿ , account for the friction between particles and particle collisions when the particle volumes fraction is close to the maximum particle volume fraction , . The particle stresses are modelled by the stress magnitude ̿ , , given in equation (2.18). This is analogous to Coulomb friction, for which the tangential frictional force is proportional to a normal force and a friction coefficient . This friction coefficient is given by equation (2.19). The particle pressure is given by the sum of the static particle pressure , and the dynamic particle pressure , (equation (2.11)).
Two‐Phase Flow Theory
19
The particle stress tensor ̿ , is modelled in its usual form:
̿
,
2
,
(2.24)
.
The viscosity , , used to model the interparticle friction can be found by dividing the shear stress ̿ , , given in equation (2.18), by the shear rate , which is given by √ 2 : . In this way, the (scalar) relation ̿ , is also satisfied in , the tensor form, given in equation (2.24). Because / is singular for 0, it is approximated by:
,
(2.25)
.
, 1 ∙ 10
Here, the interparticle viscosity , is modelled by the original formulation for shear rates larger than 1 ∙ 10 . For shear rates smaller than this value a linear relation between shear rate and shear stress is assumed. The particle pressure and particle stresses in the viscous Bagnoldian regime have also been subject of investigation. They have been measured by Deboeuf et al. (2009). Their results on measurements on suspensions in shear flow show that / . Morris and Boulay (1999) proposed the relation: , ,
,
,
,
0.75 1
.
(2.26)
,
is the shear rate of the suspension. In the viscous Bagnoldian regime the Here, dynamic particle pressure , , will only affect the flow in the regime 0.4 in regions where strong gradients of the shear rate are present. In the regime 0.4 the granular dynamical particle pressure, as given by equation (2.23) will often exceed the dynamic particle pressure , , . The dynamic particle pressure , , in the viscous Bagnoldian regime is not taken into account in the present work, however, it can be added in future work in order to describe more accurately the flow in regions with low volume fractions and high gradients of the shear rate.
20
Two‐Phase Flow Theory
2.2.3 Momentum transfer between the two phases The momentum transfer → between the two phases can be split into several contributions. Momentum transfer can be due to: Drag forces Virtual mass forces Basset forces The momentum transfer due to drag and added mass are described in section 2.2.3.1 and section 2.2.3.2, respectively. In the present study, the Basset forces, also known as history forces, are not taken into account, because its contribution to the momentum transfer is assumed to be much smaller than the contribution of the drag forces and virtual mass forces to the momentum transfer.
2.2.3.1 Drag forces The momentum transfer due to drag is often expressed using a drag coefficient
(2.27)
.
→
(2.28)
.
,
:
Here and are the particle reference area and the particle volume, respectively. , is the drag force on a single particle inside the suspension. Usually, the particles are assumed to be spherical, or assumed to be represented by a sphere with equivalent diameter. In this case and . The total momentum transfer is calculated by multiplication of the drag force on a single particle with the total number of particles per unit volume α / . It is common to express the drag coefficient as a function of the particle Reynolds number and of the volume fraction of the fluid phase , with the particle Reynolds number defined as (2.29)
,
the magnitude of the velocity difference between the two phases, , and the viscosity of the liquid, i.e. the viscosity of the fluid phase in the absence of particles and is the density of the fluid phase carrying the particles. Examples of expressions for are the Wen and Yu equation, (Wen and Yu (1966)) and the Ishii‐Zuber equation, (Ishii and Zuber (1979)). It is expected that for small Reynolds numbers the momentum transfer due to drag is linearly dependent on the Reynolds number, whereas for large Reynolds numbers this dependence is with
Two‐Phase Flow Theory
21
quadratic, as is the case for the drag of a single sphere. This led Wen and Yu (1966) to propose a drag relation based on the drag relation for a single sphere: (2.30) , 0, 1 .
Their relation is derived from sedimentation experiments by Richardson and Zaki (1954). In these experiments the sedimentation velocity of mono‐sized particles is measured in a sedimentation column for numerous particle sizes and particle volume fractions. Sedimentation in a sedimentation column can be considered as one‐dimensional. The drag coefficient of a single particle in the steady phase of the sedimentation process can be determined from the force balance on a single particle as if this particle is moving individually without the influence of other particles and only a drag force, buoyancy force and gravity force are acting on the particle. The magnitude of the drag force in this situation is given by the balance equation: (2.31) .
,
For spherical particles this can be written in terms of dimensionless numbers as: (2.32) ,
is the Archimedes number, defined as:
where
(2.33)
.
Note that in one‐dimensional sedimentation, there are, along with drag coefficient , three other dimensionless numbers, so that the most general expression for the drag coefficient is , , . However, in literature any dependence on the Archimedes number is never taken into account in expressions for , and it is always assumed that is a function of and only. Wen and Yu (1966) assumed the drag coefficient to have the form presented in equation (2.30) and they found a value of 3.7. For the drag coefficient for a single sphere 0, , they used the drag relation by Schiller and Naumann (1933),
10 ,
0,
10 ,
0,
24
1
0.15
.
(2.34)
0.44.
Many drag relations for single spheres are available in literature, and they can differ substantially. For example, the drag coefficients for single spheres of White (1974) and Schiller and Naumann (1933) show differences up to 30% for Reynolds
22
Two‐Phase Flow Theory
numbers between 102 and 103. This means that if the derivation of Wen and Yu is carried out with the drag relation of White (1974) instead of that of Schiller and Naumann (1933), momentum transfer for groups of particles can also differ up to 30% for 1 ∙ 10 , depending on the single‐sphere drag relation being used. This is shown in Figure 2.4, in which the red line shows equation (2.30) in which 0, is described by the relation of Schiller and Naumann (1933), and the black line shows equation (2.30) for which 0, is described by the relation of White (1974). Tenneti et al. (2011) and Beetstra et al. (2007) express the momentum transfer due to drag in a different way as
18
,
→
(2.35)
.
, represents the drag force on a single particle at Here, the function particle Reynolds number , in a flow with volume fraction made dimensionless with the Stokes drag force for a single particle (Beetstra et al. (2007)),
,
,
,
3
(2.36)
.
equals 0,0 , so , can be regarded as an augmentation factor for the momentum transfer of a single particle, with respect to the situation that all the particles experience single‐particle Stokes drag. Note that the drag coefficient and the dimensionless force by 24 , / .
Two‐Phase Flow Theory
,
are related
23
Drag Coefficient CD (‐)
Beetstra et al. (2007) Wen and Yu (1966) White (1974) Tenneti et al. (2014)
1
10
0
10
0
10
1
10
2
3
10
Particle Reynolds Number Rep (‐)
10
Figure 2.4: Drag coefficient for a particle in a suspension as a function of the Reynolds , for solid volume fraction . . number
Beetstra et al. (2007) have been performed Lattice‐Boltzmann simulations. In their simulations random arrays of mono‐disperse spheres moved with a prescribed velocity through a computational domain. They adjusted an opposing pressure gradient until a steady state for the fluid phase was obtained. When this situation is considered as one‐dimensional, the momentum equation in flow direction becomes:
where
,
(2.37)
is an Archimedes number based on the opposing pressure gradient:
.
(2.38)
, the force balance on a When the pressure gradient is chosen as single sphere is equal to the force balance for the sedimentation experiments, given in equations (2.31) and (2.32). The results of the simulations of Beetstra et al. (2007) have shown that for small Reynolds numbers, the increment of the drag coefficient due to the effect of the particle volume fraction is much larger than suggested by Wen and Yu (1966). Based on the results of their numerical simulations, they suggest:
24
Two‐Phase Flow Theory
10 1
,0
1
1
1.5
(2.39)
.
For the behaviour for larger Reynolds number:
,
,0
,
(2.40)
.
Here, factor is a function of the solid volume fraction α and particle Reynolds number Re . The result found by Beetstra et al. (2007) can be written as a drag coefficient:
24
10
1
1.5 (2.41)
1
0.413 24
3
.
8.4
. 1
10
Tenneti et al. (2011) performed direct numerical simulations for determining the drag of groups of particles for Reynolds numbers up to 300. They modelled the momentum transfer due to buoyancy and drag as:
,
,
,
3
(2.42)
.
This model has the undesirable feature that it creates a dependence between the buoyancy force and the slip velocity. Although (2.42) also includes the buoyancy, it is possible to write it as a drag‐only relation. Their relation is also plotted in Figure 2.4.
,
0.48 1
5.81 1
1 0.95
0.61 1
(2.43)
,
is the drag relation for a single sphere by Schiller and Naumann Here (1933), given in equation (2.34), changed into by 24 / .
Two‐Phase Flow Theory
25
Figure 2.4 compares different drag relations. For low Reynolds numbers, the drag relations of Tenneti et al. (2011) and Beetstra et al. (2007) both converge to equation (2.39). For higher Reynolds numbers the relation by Tenneti et al. (2011) approaches the drag relation by Wen and Yu (1966). This is because both relations use the drag relation of Schiller and Naumann (1933) to fit their data. The relation of Beetstra et al. (2007) is more similar to the form of the drag relation by Wen and Yu (1966), equation (2.30), if for 0, the drag relation of White (1974) is used. At high Reynolds numbers, the differences in the magnitude of the momentum transfer from the previous expressions for the momentum transfer have the same order of magnitude as the differences in the momentum transfer for a single sphere. For low Reynolds numbers, they do differ, for which the form of equation (2.40) converges to the Stokes’ solution and the form of equation (2.30) does not. The work by Beetstra et al. (2007) and Tenneti et al. (2011) has been carried out with particles in a fixed configuration. How their results are to be converted to the situation in which the particles are able to move freely is an interesting question to be addressed in future investigations. In the present work the relation of Beetstra et al. (2007) is used.
2.2.3.2 Virtual mass force The virtual mass force on a particle, also known as the added mass force, is a force related to the acceleration of an object in a fluid. When an object accelerates, the surrounding fluid has to accelerate as well when the object moves through it. Because of this effect the particle behaves as if it has a higher mass, hence the name added mass. The inertia added to the system is highly dependent on the shape of the accelerated object. The momentum transfer due to the virtual mass force is given by:
→
.
(2.44)
Here, C is the virtual mass coefficient. For a sphere, the added mass coefficient 0.5 is valid for a large range of Reynolds numbers. The added mass increases with volume fraction , because, in comparison with a single particle, more fluid needs to be displaced when a group of particles is accelerated. Relations for the virtual mass coefficient as a function of the volume fraction given by Jeffrey (1973), Van Wijngaarden (1976), Sangani and Acrivos (1981) and Niemann and Laurien (2001) are shown in Figure 2.5.
26
Two‐Phase Flow Theory
1.6 1.4 1.2
CVM
1 0.8 0.6 Niemann and Laurien (2001) Sangani and Acrivos (1981) Jeffrey (1973) Van Wijngaarden (1976)
0.4 0.2 0 0
0.05
0.1
0.15
s
0.2
0.25
0.3
Figure 2.5: Virtual mass coefficient for a spherical particle in suspension as a function of the volume fraction . Figure after Niemann and Laurien (2001).
In the present work, the relation of Niemann and Laurien (2001) is used:
1 2
3.26 2
7.7 2
(2.45)
.
The effect of the momentum transfer by virtual mass forces on the numerical flow solutions is very small. It was found, however, that addition of the momentum transfer by virtual mass forces enhanced convergence within the iteration cycles in the numerical simulations. Fewer iteration steps within the iteration cycles were needed. Details about the iteration cycles within the numerical procedure are given in section 4.2.
2.2.4 Turbulence modelling In a turbulent flow motions with various time and length scales are present, ranging from the large‐scale eddies with the length scale to the smallest motions with length scale ℓ. Kolmogorov (1941) derived relations for the scales of the smallest motions, based on the hypothesis that the smallest motions are governed by the kinematic viscosity , which determines the viscous dissipation, and the eddy dissipation rate , which determines the rate at which turbulent energy is transferred from the large scales to the small scales. This hypothesis is known as
Two‐Phase Flow Theory
27
Kolmogorov’s first similarity hypothesis. The resulting length, time and velocity scale are:
ℓ
(2.46)
.
(2.47)
.
(2.48)
.
The turbulent eddy dissipation rate , which determines the rate of change of the turbulent kinetic energy, is known to depend on the velocity and length scale as, see for example Pope (2000):
~
(2.49)
.
This means that the scales of the largest motions, length , time , and velocity and the scales of the smallest motions length ℓ, time and velocity are related to each other by:
ℓ
~
(2.50)
.
.
(2.51)
.
(2.52)
Here is the Reynolds number based on the largest length scale and the viscosity scale:
(2.53)
.
This means that when all turbulent length scales in a flow domain with volume need to be resolved, the number of grid points N required scales as:
~
ℓ
~
.
(2.54)
For the flows considered in the present work, the Reynolds number is of the order of 105 or higher, therefore it is not feasible to resolve all length scales numerically. The turbulent scales need to be accounted for by a turbulence model.
28
Two‐Phase Flow Theory
The turbulence model describes the tensors and present in the momentum equations (2.3) and (2.4), of the fluid and solid phase, respectively. These tensors contain time averages of products of velocity fluctuations of the flow. The derivation of these tensors can be found in Appendix A. These terms are modelled by the Boussinesq’ hypothesis:
〈
〉 〈
〉
,
,
,
2 3
(2.55)
Here, , is the averaged velocity of phase k, the overbar denotes time averaging and k is the turbulent kinetic energy, defined as:
1 2
(2.56)
Here, a summation is made over index k. Many RANS‐based turbulence models have been developed to describe, with reasonable accuracy, the complex characteristics of single‐phase turbulent flows (see for example the textbook by Pope (2000)). Turbulent multiphase flows are even more complex. Important aspects of turbulent multiphase flows are summarised by Balanchandar and Eaton (2010). Heavy particles tend to concentrate in regions where the strain rate is dominant in comparison to the vorticity. Experimental evidence regarding the effect of turbulence on the drag force acting on particles is inconclusive. Turbulence of the liquid may be reduced through increased dissipation by particle drag, while turbulence may be enhanced by the unsteady wakes behind particles. The equations need to be closed by a model for the turbulent viscosity , . In the present work the k‐ model is employed, being a "standard" turbulence model in Ansys CFX 14.0. No special provisions have been made to account for multiphase flow effects on turbulence, as described above, as this did not form the focus of the current study. The k‐ model is chosen, rather than the k‐ω model, so that the flow variables near the wall can be resolved by the use of wall functions. With the k‐ω turbulence model, much smaller grid cells are needed to represent the boundary layer close to a wall. These small grid cells restrict the time step that can be selected in transient simulations significantly, resulting in unfeasible long calculation times.
2.2.4.1 The k‐ turbulence model For the k‐ turbulence model the turbulent viscosity of the fluid phase , is expressed in terms of the turbulence kinetic energy k and the turbulence eddy dissipation , which are to be determined from additional transport equations. A thorough analysis of the k‐ turbulence model can be found in the book of Wilcox (2006). The transported variable k, the turbulent kinetic energy, describes the
Two‐Phase Flow Theory
29
energy in the turbulent fluctuations. The second transport variable, the turbulent eddy dissipation rate , describes the rate of dissipation of the turbulent kinetic energy. The eddy viscosity is determined by the turbulent energy and its rate of dissipation:
(2.57)
.
,
The turbulent kinetic energy k is determined from the transport equation: ,
(2.58)
,
2
,
,
,
. Here, the Einstein summation convention is used for repeated indices i and j, and is a model constant. The transport equation for the turbulent kinetic energy shows that the rate of change of turbulent kinetic energy k and the transport of kinetic energy by convection on the left hand side of the equation are in balance with the transport by diffusion, the rate of production and the rate of destruction on the right hand side of the equation. The rate of production depends on the rate of strain of the flow. The rate of destruction is determined by the eddy dissipation rate. The transport equation for the turbulent eddy dissipation rate is: ,
2
,
,
,
(2.59)
,
.
Here, , and are model constants. The constants are given by Launder and Sharma (1974) as C 0.09, 1, =1.3, C 1.44 and C 1.92. The turbulence in the solid phase is modelled by equating the kinematic turbulent viscosities of the fluid phase and the solid phase: (2.60) .
30
,
,
Two‐Phase Flow Theory
In this way, when the rate of strain tensor of the fluid phase and that of the solid phase are equal, the products of the velocity fluctuations, given on the left hand side of equation (2.55), are the same in both phases.
2.2.4.2 Modelling flow near a wall For the flow near a wall, wall functions are employed, because it is generally not feasible to resolve the boundary layer with sufficient resolution. With wall functions, the average fluid velocity of a turbulent flow away from the wall is determined by empirical functions. The law of the wall, derived by Von Kármán (1930), reads:
1
(2.61)
.
Here, / , i.e. the ratio of fluid velocity and the friction shear velocity , defined as , / . The values for empirical constants κ and C that have been used in present work are 0.41 and 5.0, respectively. The dimensionless distance to the wall is defined as:
(2.62)
.
Here, is the physical distance away from the wall and is the viscosity of the fluid phase. The law of the wall relates velocity and wall shear stress , as a function of distance from the wall and fluid properties, and is valid in the log‐layer of the turbulent boundary layer, reaching from 20 until 100. Recently, Picano et al. (2015) and Costa et al. (2016) performed direct numerical simulations on channel flow and they investigated how the presence of neutrally buoyant particles changes the flow behaviour in the near‐wall region. Costa et al. (2016) formulate a new wall function which incorporates the effect of the presence of the neutrally buoyant particles. Their results show that it is important to incorporate the effective viscosity of the suspension as a whole, , when flows with particles are considered. They show that when the effective viscosity is used in equations (2.61) and (2.62), determined by the relation for the relative viscosity by Eilers (1941), the dimensionless velocity is still underestimated by 10‐20 per cent. They suggest additional adjustments to the wall function to account for this deficit. In the present work, the viscosity of the fluid phase is used in equation (2.62), so that the important effect of the effective viscosity on the flow behaviour in the logarithmic layer has been accounted for. The additional adjustments of the law of the wall given by Costa et al. (2016) can be used in future work. Equation (2.61) can cause numerical difficulties near regions where fluid velocity approaches zero and wall shear stress , becomes singular. Therefore, an
Two‐Phase Flow Theory
31
alternative approach is used, which is the treatment that is standard in Ansys CFX 14.0. This formulation for the shear velocity is used, based on the turbulent quantities, which do not tend to go to zero in regions with very small flow velocity: / (2.63) ∗
√ .
Based on this alternative shear velocity ∗ , a new dimensionless distance to the wall can be defined:
∗
∗
.
(2.64)
The original shear velocity is determined by equation (2.61), using ∗ instead of on the right hand side. Because the law of the wall is valid only in the log‐layer, the y ∗ used to determine is not allowed to be smaller than 11.06, i.e. y ∗ max y ∗ , 11.06 . The wall shear stress , is modelled using both the original shear velocity and the alternative shear velocity ∗ : (2.65) ∗ ,
,
so that it does not become singular.
32
Two‐Phase Flow Theory
3 VISCOSITY OF SUSPENSIONS This chapter describes experiments carried out on the (laminar) viscosity of suspen‐ sions. This viscosity is an important parameter in the description of two‐phase flow. The governing equations in chapter 2 show that the viscosity is present in the resistance to shear in the momentum equations for the liquid and for the solid phase. This chapter is based on the article: Konijn et al. (2014); Experimental study of the viscosity of suspensions: Effect of solid volume fraction, particle size and suspending liquid, Powder Technology 266, p.61‐69. The dynamic viscosity of a fluid is the proportionality factor between shear stress and shear rate. For suspensions, the viscosity of the suspension as a whole primarily depends on: (i) the solid volume fraction , i.e. the volume fraction of the particulate phase, (ii) the type of suspended particles, and their shape, size, and size distribution in particular, (iii) the suspending Newtonian liquid, and its dynamic viscosity in particular, and (iv) the shear rate (for shear thinning or shear thickening liquids).
Viscosity of suspensions
33
In this chapter the focus is on nearly neutrally‐buoyant suspensions, for which the mass densities of the suspending fluid and that of the suspended particles are nearly the same. Note that for neutrally‐buoyant suspensions, the mass fraction and the volume fraction of the particulate phase are identical. A common way to describe the dynamic viscosity of a suspension is by the relative viscosity , which is the ratio between the dynamic viscosity of the suspension and the dynamic viscosity of the suspending liquid :
.
(3.1)
The relative viscosity represents the factor by which the viscosity of the liquid is increased, through the presence of the suspended particles. The current experimental study adds to the knowledge on the viscosity of suspensions by the systematic variation of the parameters that determine the suspension viscosity. The focus is on suspensions with larger solid volume fractions for which the particulate phase consists of larger, nearly neutrally‐buoyant particles that are solid and spherical. Colloidal suspensions are not considered here. The outline of this study is as follows. Experimental results and models from literature are presented in section 3.1. The experimental method is described in section 3.2. Results from the current experiments are presented in paragraph 3.3. Finally, conclusions of this study are summarised in section 3.4.
3.1 Literature review The literature on the viscosity of suspensions is vast. Reviews have been given by Jeffrey and Acrivos (1976) and Stickel and Powell (2005). Many experimental results for the suspension viscosity are available in the literature. As an indication, results for the dependence of the relative viscosity on solid volume fraction from classical studies by Eilers (1941) and Vand (1948) are shown in Figure 3.1, together with results by Prasad and Kytömaa (1995) and Koos (2009) and Koos et al. (2012). These latter three studies are especially relevant for dredging applications, since these deal with relatively large particles and/or lower liquid viscosities. Notable is the large scatter present in these experimental results, presumably due to the different materials used. Particle diameters, liquid viscosities and apparatus used in these experiments are reported in Table 3.1.
34
Viscosity of suspensions
3
10
2
rel
10
Eilers (1941) Vand (1948) Prasad&Kytömaa (1995) Koos (2009, 2012) Mooney (1951) Krieger-Dougherty (1959)
1
10
0
10
0
0.1
0.2
0.3
s
0.4
0.5
0.6
Figure 3.1: Relative viscosity as a function of solid volume fraction measurements (markers) and closed‐form expressions (lines) with , that for the vertical axis a logarithmic scale is used.
: results from . . Note
Experiment
Particle dia‐ Liquid viscosity Apparatus (mPa∙s) meter d (µm)
Eilers (1941) Vand (1948)
2.7 50‐80
>1000 80
Prasad and 2000 Kytömaa (1995) 3175
35 55 70 1.7 10.8 2.5 35.5 35.5
Koos (2009), 3340 Koos et al. (2012) 6320 3220 2930 3040
Concentric cylinders Concentric cylinders; Capillary rheometer Concentric cylinders Concentric cylinders
Table 3.1: Experiments from literature.
Viscosity of suspensions
35
Senepati et al. (2010) have measured the suspension viscosity of various poly‐ disperse fly ash slurries with water as the suspending liquid. They considered suspensions with different solid volume fractions (in the range ∈ 0.3 0.5 ) and different average particle sizes. The non‐spherical particles have a fairly wide particle‐size distribution. It has been observed that the suspensions show significant shear thinning behaviour. The suspension viscosity increases with increasing solid volume fraction and it decreases with increasing average particle size d. Many theoretical and semi‐empirical closed‐form relations have been proposed for the dependence of the relative viscosity on solid volume fraction . Overviews of such relations are given by Rutgers (1962), Jinescu (1974) and Horri et al. (2011). According to these relations, the relative viscosity depends only on solid volume fraction and some “maximum solid volume fraction” (or fluidity limit) , of the particles. Hence, for these descriptions
;
,
.
(3.2)
An objective of the current study is to test whether this description of the relative is adequate in general. viscosity Koos (2009) gives an overview of maximum particle packings, such as random close packing (i.e. the densest state that particles can obtain; solid volume fractions in the range ∈ 0.61 0.65 and random loose packing (i.e. the loosest state that particles can obtain while still in contact; solid volume fractions in the range ∈ 0.55 0.61 ). Koos also discusses the effect on maximum packings of particle shape and of the containers in which the particles are packed. It is well‐established that the particle‐size distribution also influences maximum packings, see for example Shapiro and Probstein (1992). They point out that the solid volume fraction corresponding to random close packing and the solid volume fraction at which the suspension viscosity diverges, are not the same (though closely related). In the study by Wildemuth and Williams (1984) it is suggested that the maximum solid volume fraction , is also dependent upon the shear stress. In the present study the maximum solid volume fraction , is considered to be an empirical parameter that characterises the solid volume fraction at which the relative viscosity diverges (as a function of solid volume fraction ). Examples of relations of the type in equation (3.2) that do not involve the maximum solid volume fraction of the particles , are due to Einstein (1906) and Kunitz (1926). Einstein (1906) derived an analytical relation for the suspension viscosity that is valid for very dilute suspensions, i.e. for low solid volume fraction ≪ 1,
36
Viscosity of suspensions
( 0.02 according to Rutgers (1962) for Einstein’s relation to be accurate), of solid spherical particles:
1
,
5 2
(3.3)
.
The expression for that incorporates the quadratic term in solid volume fraction was given by Batchelor and Green (1972). Kunitz (1926) proposed a relation that is (claimed to be) valid for larger values of solid volume fraction ,
1
,
1
1 2
(3.4)
.
that do involve the maximum Often‐used relations for the relative viscosity solid volume fraction , are due to Mooney (1951) and Krieger and Dougherty (1959)
5 2
,
1
(3.5)
, , ,
,
1
,
(3.6)
.
Here 5/2 for solid, spherical particles, as then the expression for the relative viscosity matches that according to Einstein’s relation, equation (3.3), for ≪ 1 . The relation by Roscoe (1952) is a special case of equation (3.6): it is obtained when 0.74 and 5/2. The relation by Maron and Pierce (1956) is also a , , special case of equation (3.6): it is found when 2. , Many empirical and theoretical relations (Maron and Pierce (1956); Chong et al. (1971); Liu (2000); Boyer et al. (2011), Horri et al. (2011)) involve a (divergent) dependence of the relative viscosity on solid volume fraction as , , for approaching the maximum solid volume fraction , . Recently, Abedian and Kachanov (2010) obtained a theoretical lower bound for the relative viscosity for systems with monodisperse spherical particles, based on the use of variational methods for Stokes flow. This bound states that the relative viscosity satisfies 1 / 1 . None of the studies in literature contains a systematic study on the parameters that determine the suspension viscosity . In previous studies, when one of the parameters is changed, the other parameters are not kept constant, which makes it difficult to draw clear conclusions. Therefore, in the present study, experiments are carried out in which the solid volume fraction, particle diameter and particle‐
Viscosity of suspensions
37
diameter distribution are systematically varied. In all experiments, particles of the same material are employed. Furthermore, the viscosity of the liquid is changed by adjusting its temperature, while the type of liquid is kept constant. In addition, experiments have been carried out with smooth and with rough cylinder walls in the employed concentric‐cylinder device, in order to investigate effect of the occurrence of slippage at the walls (Barnes (1995); Buscall (2010)).
3.2 Experimental methods The following subsections deal with various aspects of the experiments. Firstly, the concentric‐cylinder rheometer used to measure the suspension viscosity is described. Then the particulate materials and the suspending liquids, that have been employed to create the (nearly) neutrally‐buoyant suspensions, are specified. Subsequently, the measurement procedure is reported. Finally, the effect of gap width and wall roughness on the results of the measurements is assessed. More details on the experimental methods are given by Sanderink (2012).
3.2.1 Concentric‐cylinder rheometer A Thermo Scientific HAAKE Rheostress 6000 concentric‐cylinder rheometer is used to measure the suspension viscosity . Figure 3.2 gives the schematic view of the rheometer test section. The outer cylinder is stationary and the inner cylinder is rotating. An air pocket is present at the bottom of the inner cylinder (see Figure 3.2) in order to reduce friction between the bottom of the inner cylinder and the surrounding test liquid. The rheometer is equipped with a temperature‐control unit that surrounds the test section. This unit keeps the suspension at a constant, specified temperature. The (inner) radius of the outer cylinder (cup) is 21.6 mm. For most of the experi‐ ments an inner cylinder with (outer) radius 19.0 mm was employed. The height L of the inner cylinder is 55 mm. The inner and outer cylinders were available in smooth as well as rough, serrated form in order to assess whether wall slippage has been important, see Barnes (1995); Buscall (2010). For the experiments reported in section 3.3, rough inner and outer cylinders have been employed.
38
Viscosity of suspensions
Figure 3.2: Schematic of the rheometer test section.
The rheometer measures the angular speed (in rad/s) and the corresponding ex‐ erted motor torque T. The shear rate and shear stress are calculated at the inner cylinder, i.e. at , as if the measured suspensions were Newtonian and the flow field inside the rheometer can be described by a non‐zero circumferential velocity that only depends on the radial coordinate
|
2
,
|
2
(3.7)
.
The viscosity of the suspension is then calculated from
| . |
(3.8)
The shear rates and shear stresses presented hereafter always refer to the shear rate and shear stress at the surface of the inner cylinder. Therefore, the subscript indices are dropped. The rheometer is operated in controlled‐rate mode, which means that ω is kept constant. Specifications of the rheometer are: minimum torque 200 nN∙m; maximum torque 200 mN∙m; torque resolution 0.5 nN∙m at the lowest torque; minimum angular velocity 10‐7 min‐1; angular resolution 12 nrad; maximum angular velocity 1500 min‐1.
Viscosity of suspensions
39
3.2.2 Materials The Newtonian liquid used for the suspensions is pure glycerine. Its dynamic viscosities at 23.0°C and 75.7°C are 1080 mPa∙s and 35.5 mPa∙s, respectively. The pure glycerine at 23°C and 75.7°C has densities of 1.26 and 1.23 g/ml, respectively. Note that the temperature‐control unit has been used to vary the viscosity of the liquid, without having to change the type of liquid. For the particulate phase, solid spherical DynoAdd particles made of poly‐ methylmethacrylate (PMMA) are used, according to the specifications of the supplier, with diameters d of 6.3, 15, 30, and 40 µm, as measured with a Beckman‐ Coulter particle‐size analyser. The particles have a density of 1.18 g/ml. These PMMA particles were selected, as their density is close to that of pure glycerine. The suspensions are therefore (nearly) neutrally buoyant. Furthermore, the particles are practically monodisperse, as shown in Figure 3.3, which gives the particle‐ diameter distributions of the employed particle‐diameter groups. In dry form these solid materials were free‐flowing (non‐cohesive) and no accumulation of electric charge was observed.
Figure 3.3: Particle‐diameter distributions for the various particle diameters considered. Note that the unmarked peaks correspond to particle diameters that have not been used in the current experiments.
40
Viscosity of suspensions
The gap width ≡ between inner and outer diameters of the cylinders of the rheometer is 2.65 mm. The ratio between gap width b and maximum particle diameter d is 66. This relatively large ratio for b/d indicates that the suspensions can be considered as continua. The difference in density between the liquid and that of the particles, although relatively small, leads to buoyancy and centrifuging of the particles. It has been estimated (see Sanderink (2012)) that this does not significantly affect the measurement results. Based on the sedimentation velocity of a particle inside a suspension, a ‘worst case’ estimate of the change in solid volume fraction inside the test section has been obtained, based on the largest particle diameter, lowest viscosity of the suspending liquid and lowest solid volume fraction that has been used. This ‘worst case’ estimate predicts an increase in solid volume fraction during the test duration of 4.8 percent. In the experiments of Senepati et al. (2010), the difference in density between particles and liquid was much larger and the liquid viscosity was smaller, while their particle sizes were of the same order of magnitude as employed here. Hence, sedimentation effects may have been more significant in their experiments than in the current experiments.
3.2.3 Measurement procedure Samples have been prepared by weighing specified quantities (corresponding to the specified solid volume fraction ) of liquid and particles. The focus of this study is on the behaviour of suspensions at high volume fractions. Hence, solid volume fractions that have been considered are 0.30, 0.40 0.45, 0.475, and 0.5. The resulting mixtures were stirred extensively until a homogeneous suspension was obtained. Note that Vand (1948) obtained different values for the relative viscosity at solid volume fractions 0.40, depending on whether or not the samples were stirred (Vand’s data shown in Figure 3.1 correspond to suspensions that were stirred). Here, the effect of insufficient stirring would be apparent visually by the presence of lumps of particles in the sample as well as from the results of measurements that would show strong shear thinning. This was especially the case for suspensions with low solid volume fractions of smaller particles when the viscosity of the suspending liquid was low ( 35.5mPa∙s). Stickel and Powell (2005) gave approximate conditions for which effects of Brown‐ ian motion and of inertia are negligible. These conditions, which effectively determine the range of shear rate , depend on the Péclet number and the particle Reynolds number , respectively
Viscosity of suspensions
41
3 4
10 ,
4
10 .
(3.9)
is Boltzmann’s constant and T is the absolute temperature of the Here suspension. Since the rheometer is operated in controlled‐rate mode, the shear rate is specified and the corresponding shear stress is measured. The shear rate is varied between 1 and 200 for solid volume fractions 0.30 and 0.40. For higher solid volume fractions the measured range of shear rates is lower, due to the limited torque that can be exerted by the rheometer. For solid volume fractions 0.45, 0.475, and 0.5, the ranges of the shear‐rates are 1–100 , 1‐50 , and 1–30 , respectively. At each measured shear rate, the suspension is sheared for 15 seconds. The torque is measured 10 times per second. The average torque exerted within the last 3 seconds is used to calculate the shear stress from equation (3.7). For the systems considered here, the smallest Péclet number is 3 ∙ 10 , so all systems are non‐Brownian. The largest Reynolds number is 3 ∙ 10 , so inertia effects are negligible, except perhaps at the highest shear rate 200 for the suspensions with the largest particles and with the suspending liquid with low viscosity. In the experiments by Senepati et al. (2010), inertia effects may not have been negligible at their highest shear rates. For the ranges of shear rate considered here, secondary flows did not occur, according to the criterion by Taylor (1923) for an inner rotating cylinder. When secondary flow occurs, the flow field can no longer be described by a circumferential velocity that only depends on the radial coordinate. Then the shear rate and the shear stress can no longer be related to the measured rotational speed and the torque T through equation (3.7). For each sample, the measurement sequence consisted of at least eight “ramps” in shear rate. In the “upward” ramps, the shear rate was increased from the minimum value to the maximum value; in the “downward” ramps, the shear rate was decreased. It was observed that during the first upward ramp, larger values of the relative viscosity are measured than during the subsequent ramps. The values from these subsequent ramps have been used, as they also were much closer to each other. This is indicative of a small degree of thixotropic behaviour (see for example Mewis and Wagner (2009)). This effect was not significant, and thus was not examined in detail in the present investigation. In order to check the reproducibility of the measurements, all experiments have been carried out multiple times with newly created suspensions. Experiments with a solid volume fraction of 0.40 or higher have been carried out with three or four
42
Viscosity of suspensions
different samples. Experiments for a solid volume fraction 0.30 have been carried out with two or three samples. In total, more than 100 samples have been created. Standard deviations (based on measured values of the different samples) are indicated by error bars in the graphs for the relative viscosity , with each error bar having a length of twice the standard deviation. This would represent a 68% confidence interval if the distribution of measured values were Gaussian.
3.2.4 Gap width and wall roughness The apparatus allows for the replacement of the inner and the outer cylinder. Experiments have been performed with inner cylinders of various diameters and various wall roughnesses in order to investigate the effect on the measured suspension viscosity of the gap width between the cylinders and of the cylinder wall roughness, i.e. to verify that materials properties are measured, rather than a combination of material and system properties. The gap width b was varied by employing two rough surfaced inner cylinders with different radii, in combination with the rough surface outer cylinder. The gap widths were 2.65 mm and 6.15 mm. Two cases with different particle diameters d of 15 µm and 30 µm have been considered, for a solid volume fraction and with pure glycerine at 23 °C as suspending liquid with viscosity of 1080 mPa∙s. The differences between the results with different gap widths b, of at most 5%, fall within the range of experimental error (see Sanderink (2012) for more details). Hence, it is concluded that the gap width b does not affect the measured results for the suspension behaviour and that material properties have indeed been measured. Barnes (1995) and Buscall (2010) commented on the importance and ubiquity of wall slippage during measurements on suspensions. To assess whether wall slippage is significant in the current investigation, tests have been performed for the smooth and for the rough cylinder walls. Before the results of the experiments with suspensions are discussed, however, it is noted that tests with pure glycerine without particles give the same results for both the smooth and rough walls. This observation is important, because it implies that any differences found are not due to the conversion from the measured quantities, motor torque T and rotational velocity , to the shear stress and shear rate as given in equation (3.7). Experiments have been conducted for particles of diameter 30 µm suspended in glycerine at solid volume fractions of 0.20 and 0.40 to establish the effect of wall roughness at moderately low and high solid volume fractions. The viscosity of glycerine was also varied by changing the temperature of the suspension from 23.0 °C to 75.7 °C; this corresponds to liquid viscosities of 1080 mPa∙s and 35.5
Viscosity of suspensions
43
mPa∙s, respectively. For a solid volume fraction of 0.20 for both liquid viscosities and for a solid volume fraction 0.40 with the high liquid viscosity, the differences fell well within the range of experimental error. For suspensions 0.40 for the low liquid viscosity, however, it has been with a volume fraction observed that, in the case of rough walls, the measured viscosity is up to 8% smaller than for the case of smooth walls (see Sanderink (2012) for more details). This is contrary to what was found in other studies, in which the measurements with rough walls give higher values than measurements with smooth walls (for example: Savage and McKeown (1983): higher by a factor ~1.5–2; Koos (2009): higher by a factor ~3–20; Figure 3.1 includes the values from the experiments by Koos (2009) with smooth walls). A possible explanation for the current results is that some particles got stuck, before the suspension was properly mixed, in the slits (with a depth of ~1mm) that form the wall roughness of the rough cylinders. In this way, the solid volume fraction in the sheared medium was lower than for the case with smooth walls, resulting in a smaller measured value of the viscosity of the suspension. Considering the reasonably small differences between the results for smooth and those for rough walls observed here, especially in comparison with differences noted by other researchers, it is concluded that the effect of wall roughness is limited. By using cylinders with rough walls for the results reported in section 3.3, the effect of wall slippage has been reduced to acceptable levels.
3.3 Results and discussion The effect of various parameters on the suspension viscosity of the nearly neu‐ trally‐buoyant suspensions has been determined experimentally. These parameters are: solid volume fraction , particle diameter d, particle diameter distribution, shear rate , and viscosity of suspending liquid. Results for the first three parameters are presented in the following subsections for various values of the shear rate and for two values of the viscosity of the , a high value of 1080 mPa∙s at suspension temperature suspending liquid 23.0 °C and a low value 35.5 mPa∙s at suspension temperature 75.7 °C.
44
Viscosity of suspensions
All results have been obtained by varying the shear rate and measuring the corresponding shear stress . These measurements have been performed with the same type of particles and the same type of suspending liquid. In their extensive study of the effect of particle shape on the viscosity of suspensions, Mueller et al. (2010) observed that their results were very well represented by the Herschel‐Bulkley model (Herschel and Bulkley (1926)): . In their experiments, the yield stress was very small for solid volume fractions 0.5. The yield stress is therefore not included in the rheological model employed here, i.e. 0 Pa. This results in the power‐law Ostwald‐de Waele model (proposed by Ostwald (1929)). Senepati et al. (2010) observed that their results were well described by the Ostwald‐de Waele model. The unit of the consistency index K is Pa∙sN. Different values for the flow index N result in different values of K with different units. To simplify the comparison of the results for various values of solid volume fractions , the Ostwald‐de Waele model is rewritten as (3.10)
.
is arbitrarily set to 1 . With this Here the reference shear‐rate formulation, both the relative consistency‐index and the flow index N are dimensionless. For a pure (Newtonian) liquid with 0 , we have 1 and 1. The flow index N is a measure of the degree of shear thinning when 1 (or shear thickening when 1). The relative consistency‐index represents the apparent relative viscosity at a shear rate of 1 .
3.3.1 Effect of solid volume fraction The dependence of the relative viscosity on the shear rate has been investigated for various solid volume fractions and for two values of the viscosity of the suspending liquid, . Figure 3.4 shows the effect of solid volume fraction on the relative viscosity for a suspension with a suspending liquid with high viscosity ( 1080 mPa∙s; top) and with low viscosity ( 35.5 mPa∙s; bottom), for particles with diameter 30 µm. The relative viscosity increases rapidly when the solid volume fraction is increased, for suspending liquids with high viscosity as well as for suspending liquids with low viscosity . Figure 3.4 shows (nearly) Newtonian behaviour (constant relative viscosity) for low solid volume fractions . For high solid volume fractions the flow behaviour is slightly shear thinning. When the viscosity of the suspending liquid is low
Viscosity of suspensions
45
(Figure 3.4, bottom), the suspension shows shear thinning behaviour at lower solid volume fractions. A comparison of the results for the high and the low values of the viscosity of the suspending liquid (see Figure 3.4, top and bottom, respectively) shows that the rela‐ tive viscosity of the suspensions with a suspending liquid with low viscosity is significantly higher than when a suspending liquid with high viscosity is used (as an indication, the increases are by factors: 1.9 for 0.5; 1.3 for 0.45 and 1.3 for 0.4 ; for 100 ). This demonstrates that the description for the relative viscosity in equation (3.2), according to which the relative viscosity is solely a function of solid volume fraction and a (geometrically determined) maximum solid volume fraction , , is not generally valid. At high shear rates an increase of the suspension viscosity could occur due to secondary flows (Taylor (1923)), grain‐inertia effects (i.e. momentum transfer due to collisions between particles with fluctuating velocities; see Bagnold (1954), or transition to turbulence. These effects are not important here, as the current results do not show an increase in suspension viscosity at high shear rates . The data for the relative viscosity as function of shear rate can be well repre‐ sented by the Ostwald‐de Waele model, equation (3.10), as indicated by the black solid lines in Figure 3.4. This is the case for the two values of the liquid viscosities considered in Figure 3.4. The results for the relative viscosity as a function of shear rate are therefore condensed into the Ostwald‐de Waele parameters and N, which clearly depend on solid volume fraction and viscosity of the suspending liquid . The corresponding values for the relative consistency‐index and the flow index N are given in the next subsection, where also the effect of the particle diameter d on the behaviour of the suspension is investigated.
46
Viscosity of suspensions
Figure 3.4: Double logarithmic plot of the relative viscosity as a function of shear rate for various solid volume fractions . Measurements: symbols; curve fit according to equation (3.10): black solid line. The suspensions consist of particles of diameter µm. At the top for a high liquid viscosity mPa∙s, at the bottom for a low liquid viscosity . mPa∙s.
Viscosity of suspensions
47
3.3.2 Effect of particle diameter The effect of particle diameter d on the Ostwald‐de Waele parameters and N is shown in Figure 3.5 and Figure 3.6, for suspensions with suspending liquid with high viscosity (Figure 3.5) and with low viscosity (Figure 3.6), respectively. The least‐ squares procedure used to fit the Ostwald‐de Waele model to the experimental data also provides estimates of variation (uncertainty) for the fitted parameters and N. This variation is indicated by error bars in the graphs. , the values for the For suspensions with a suspending liquid with high viscosity relative consistency‐index for 15 µm and 30 µm are rather close, see Figure 3.5 (top). The same holds for the flow index N, see Figure 3.5 (bottom). The for suspensions with the smallest values of the relative consistency‐index particle diameter 6 µm are lower. These suspensions show qualitatively different behaviour, since they exhibit mild shear thickening behaviour ( 1) for high solid volume fractions , see Figure 3.5 (bottom), rather than mild shear thinning ( 1) as observed for the other particle diameters. For suspensions with the smallest particle diameter 6 µm, the effects of Brownian motion may become important, as has been discussed in paragraph 3.2.3. In all cases, the deviation from Newtonian behaviour, 1, increases with increasing solid volume fraction . , the relative For suspensions based on a suspending liquid with low viscosity consistency‐index is the highest for suspensions with particles with 15 µm (see Figure 3.6, top). The trend for suspensions with particles with diameter 30 µm and 40 µm is not as clear. On average, the relative consistency‐index is slightly higher for 30 µm than for 40 µm. Hence, the relative consistency‐ index appears to be a weakly decreasing function of particle diameter d for suspensions with a low liquid viscosity . The flow indices N for suspensions based on a suspending liquid with low viscosity are shown in Figure 3.6 (bottom). The most pronounced shear thinning behaviour (smallest N) is observed for the suspensions with the smallest particles considered, with 15 µm. The trend for suspensions with particles with diameters 30 µm and 40 µm is not as clear. On average, the flow index N is slightly lower for 30 µm than for 40 µm. Hence, the flow index N appears to be a weakly increasing function of particle diameter d.
48
Viscosity of suspensions
High µliq d = 6 m d = 15 m d = 30 m
2
Krel
10
1
10
0
10
0.3
0.35
0.4
0.45
0.5
0.4
0.45
0.5
s
d = 6 m d = 15 m d = 30 m
1.2
N
1.1 1 0.9 0.8 0.7
0.3
0.35
s Figure 3.5: Ostwald‐de Waele parameters and N as a function of solid volume fraction , for various particle diameters d, liquid viscosity mPa∙s. Above: ; below: flow index N. Note that the vertical axis for is relative consistency index logarithmic.
Viscosity of suspensions
49
Low µliq d = 15 m d = 30 m d = 40 m
2
Krel
10
1
10
0
10
0.3
0.35
0.4
0.45
0.5
0.4
0.45
0.5
s
d = 15 m d = 30 m d = 40 m
1.2
N
1.1 1 0.9 0.8 0.7
0.3
0.35
s
Figure 3.6: Ostwald‐de Waele parameters and N as a function of solid volume . mPa∙s. Above: fraction , for various particle diameters d, liquid viscosity relative consistency index ; below: flow index N. Note that the vertical axis for is logarithmic.
50
Viscosity of suspensions
The measurements by Senepati et al. (2010) have been performed for non‐spherical particles with a fairly wide particle‐size distribution and with water as suspending liquid, with a viscosity 1 mPa∙s, i.e. even lower than the “low” liquid viscosity considered in present study. They find that the relative consistency‐index decreases significantly with increasing particle size and that with increasing particle size, the shear thinning behaviour becomes less pronounced. These trends are the same as those observed in the current experiments. The current results demonstrate (once more) that the description for the relative viscosity in equation (3.2), according to which the relative viscosity does not depend on the particle diameter d, is not adequate in general. For suspensions based on a liquid with high viscosity, the effect of particle diameter d on the relative viscosity is small, but for suspensions based on a liquid with low viscosity , there is a definite effect of particle diameter d on the relative viscosity .
3.3.3 Effect of particle‐size distribution A system consisting of particles of various sizes can be packed closer than a system with mono‐sized particles. The maximum solid volume fraction , of systems with a bidisperse particle‐size distribution will therefore be higher. This means that, at identical solid volume fraction , a suspension with a bidisperse distribution of particle diameters is expected to exhibit a smaller relative viscosity than a suspension with a monodisperse distribution of particle diameters. Detailed experimental studies of the behaviour of suspensions with bidisperse parti‐ cle‐diameter distributions have been performed, for example, by Chong et al. (1971), Shapiro and Probstein (1992), and Chang and Powell (1994). They considered various ratios between the diameter of the large spheres and that of the small spheres and various volume fractions of the small spheres have been considered. In the present study, a limited study into the effect of the particle‐diameter distribution on the relative viscosity has been performed. This in order to investigate the effect of the viscosity of the suspending liquid on the suspension behaviour. Bidisperse samples have been created by mixing particles of 15 µm and particles of 30 µm in equal volumes, i.e. in a 1:1 volume fraction ratio, i.e. the ratio of the diameter of the large and small particles is 2.0.
Viscosity of suspensions
51
High liq, d = 15 & 30 m
2
Low liq, d = 15 & 30 m
10
High liq, d = 30 m Low liq, d = 15 m
Krel
Low liq, d = 30 m 1
10
0
10
0.3
0.35
0.4
s
1.2
0.45
0.5
High liq, d = 15 & 30 m
1.15
Low liq, d = 15 & 30 m
1.1
High liq, d = 30 m
1.05
Low liq, d = 15 m Low liq, d = 30 m
N
1 0.95 0.9 0.85 0.8 0.75
0.3
0.35
0.4
s
0.45
0.5
Figure 3.7: Behaviour of suspensions with momodisperse and bidisperse particle‐ diameter distributions for various solid volume fractions and liquid viscosities (top) and N (bottom) in the Ostwald‐de Waele expressed in terms of the parameters model. Results for suspensions with low liquid viscosity with bidisperse particle‐ diameter distributions are not available for . and . .
52
Viscosity of suspensions
Figure 3.7 shows results for the relative viscosities , expressed in terms of the Ostwald‐de Waele parameters and N, for suspensions based on bidisperse and monodisperse particle‐diameter distributions, for various solid volume fractions and for high and low liquid viscosities . Note that for all bidisperse cases, the volume fraction of the small particles is the same as the volume fraction of the large particles. For the suspensions based on a liquid with high viscosity , the results show a lower relative consistency‐index for the bidisperse suspensions than for the monodisperse systems, for all solid volume fractions (see Figure 3.7, top). This corresponds to the description given at the beginning of this section. However, for suspensions based on a liquid with low viscosity, the relative consistency‐index for the bidisperse suspension lies in between the values for found for monodisperse suspensions with 15 µm and suspensions with 30 µm. , the flow index N is For the suspensions based on a liquid with high viscosity practically the same for the suspensions based on bidisperse and for those based on monodisperse particles (see Figure 3.7, bottom). For the cases with low viscosity of the suspending liquid, the bidisperse systems show slightly more pronounced shear thinning behaviour (lower N).
3.3.4 Maximum solid volume fraction In the literature, a wide range of values is reported for the maximum solid volume fraction , , even for suspensions with a monodisperse particle‐diameter distribution (for example, Shapiro and Probstein (1992): , 0.52; Chong et al. (1971): , 0.61). For bidisperse systems, Chang and Powell (1994) have com‐ piled results from the literature (including their own), for various diameter ratios and volume fractions of the small particles. The highest value for the maximum solid volume fraction , is observed for systems for which the volume fraction of the small particles is around 25%. In the present study, the dependence of the relative consistency‐index on solid volume fraction has been determined experimentally. The relative consistency‐ index diverges as the solid volume fraction approaches the maximum solid volume fraction , . In order to extract the maximum solid volume fraction from these data, fits of the type , , are considered. Several of such relations have been tried that are similar to those for the relative viscosity , such as equations (3.5) and (3.6). The single‐parameter relation that gave the best fit to the current data was that of Chong et al. (1971).
Viscosity of suspensions
53
1
0.75
,
1
(3.11)
. ,
Note that this expression can also be formulated in terms of Bagnold’s linear ⁄ ⁄ concentration 1 1 , Bagnold (1954). , The values of the maximum solid volume fraction, resulting from the fitting process, are summarised in Table 3.2. The results given in Table 3.2 indicate that the maximum packing fraction , increases for suspensions with a monodisperse particle‐diameter distribution with increasing particle diameter d (weakly for high liquid viscosity) and with increasing liquid viscosity . Considering the differences in diameter ratio and/or volume fraction of small particles between those of the current experiments and those reported in literature and the large range of values reported for , , even for monodisperse systems, an attempt to quantitatively compare the results compiled by Chang and Powell (1994) is not considered to be very meaningful.
High Liquid viscosity 15 µm 0.54‐0.60
mPa∙s
30 µm 0.56‐0.57
Bidisperse 0.57‐0.60
Low Liquid viscosity 15 µm 0.52
. mPa∙s 30 µm
0.54
Table 3.2: Maximum solid volume fraction . liquid viscosities
40 µm 0.54‐0.57 ,
Bidisperse 0.52‐0.55
for various particle diameters d and
3.3.5 Shear thinning behaviour In this section potential origins of the observed shear‐thinning behaviour are discussed. Detailed studies of non‐Brownian suspension rheology, in which not only the relative viscosity is given but also the shear stress as a function of shear rate, are reported by Ferrini et al. (1979), Zarraga et al. (2000), Mueller et al. (2010), Dai et al. (2013), Gamonpilas et al. (2016). All of these studies report shear‐thinning behaviour for solid volume fractions larger than 0.3. Denn and Morris (2014) reviewed the rheology on non‐Brownian suspensions. They note that for solid volume fractions larger than 0.4 shear thinning is often observed, but that it is not understood precisely what the origin is of the shear‐
54
Viscosity of suspensions
thinning behaviour. They propose particle surface interactions as a possible explanation. Tanner and Dai (2016) measured the viscosity of suspensions, for which they varied the roughness of the surfaces of the particles, while leaving the particle material and interstitial liquid unchanged. Their results show an increase in measured viscosity when particles with a rough surface are used, ranging from an increase of 12 per cent for a solid volume fraction of 0.3 to an increase of 57 per cent for a solid volume fraction of 0.5. This indicates that the roughness of the particle surfaces has a significant effect on suspension rheology. Other mechanisms that can lead to shear thinning behaviour are particle migration and viscous heating. The mechanisms are described below. Particle migration in suspensions occurs due to shear‐induced particle drift arising from irreversible interparticle interactions. Particles migrate from regions of high shear rate to regions of low shear rate. This can be in radial direction, due to a gradient in shear rate inside the test section of the rheometer for the current experiments, or in axial direction, due to a difference in shear rate between the test section and the reservoir underneath the inner cylinder. This leads to a slow change of the suspension viscosity, as noted by Gadala‐Maria and Acrivos (1980). In a concentric cylinder rheometer particle migration in radial direction results in a solid concentration that is higher near the outer stationary wall where the shear rate is low than near the rotating inner wall where the shear rate is high. This has been confirmed experimentally by Abbott et al. (1991), Phillips et al. (1992) and Ovarlez et al. (2006). Theoretical, hydrodynamic diffusion models have been developed by Leighton and Acrivos (1987) and Phillips et al. (1992), for instance, to describe particle migration. These models lead to a self‐diffusion coefficient , in which is the particle diameter and is the dimensionless self‐ diffusion coefficient that is quadratic in the solid volume fraction for small values of . of the Leighton and Acrivos (1987) estimate that the number of revolutions rheometer during which the radial migration phenomenon is expected to last will be
(3.12)
∝
Here, d is the particle diameter and and are the radii of the outer and inner cylinder, respectively. For the current measurements, this results in a number of revolutions with an order of magnitude of 10 10 during which the
Viscosity of suspensions
55
migration phenomenon is expected to last. The number of revolutions in the current experiments has been of an order of magnitude of 10 . Note that the diffusion models predict that the migration rate is independent of the viscosity of the suspending liquid. This has been confirmed experimentally by Abbott et al. (1991). Deboeuf et al. (2009) measured the normal stresses during measurements in a Couette flow. They state that the particle migration involves a so‐called ‘particle pressure’ based on theoretical analysis by Morris and Boulay (1999). Because this particle pressure increases linearly with shear rate , it causes diffusion of particles which tend to move from regions of high shear, where the particle pressure is high, to regions of low shear, where the particle pressure is low.
Figure 3.8: The ratio / as a function of solid volume fraction , given for various particle diameters, as measured by Deboeuf et al. (2009), also the relation from Morris and Boulay (1999) is shown.
Figure 3.8 shows the ratio / as a function of the solid volume fraction , where is the particle pressure. Here, the particle pressure is not related to particle collisions, as is the case in the granular flow regime, by Bagnold (1954), but can be understood as the potential which drives the particles towards regions with low shear, due to the chaotic behaviour of the particle trajectories. The experiments by Deboeuf et al. (2009) indicate that this relation is independent of shear rate. The relation by Morris and Boulay (1999) is not dependent on the particle diameter d.
56
Viscosity of suspensions
The experiments by Deboeuf et al. (2009), however, show a larger particle pressure for smaller particle diameter d. The differences in normal stresses, and have also received some attention in literature, see for example Gamonpilas et al. (2016) and Zarraga et al. (2000). As shown in Gamonpilas et al. (2016) the measured normal stress differences available in literature, show a wide scatter and difference in sign. Since the normal stress differences are much smaller than the increase in normal stresses, i.e. increase in particle pressure , the normal stress differences are considered to be of minor importance to the flow behaviour. Mueller et al. (2010) suggested that the shear‐thinning behavior is caused by viscous heating in the narrow gaps between the particles, which is more pronounced at high shear rates and high solid volume fractions, causing high temperatures locally and thereby decreasing the viscosity of the suspending liquid. A dimensionless number which expresses the ratio between heating due to viscous dissipation over heat ⁄ ∆ , where is transfer due to conduction is the Brinkman number, a characteristic velocity (here, determined by the geometry of the rheometer and its angular speed), is the thermal conductivity of the suspension and ∆ is a characteristic temperature difference. The present experiments indicate that viscous heating is not likely to be the cause of the shear‐thinning behavior of the suspension: the Brinkman number has a much larger value for the experiments for which the viscosity of the suspending liquid is high than for the experiments for which the viscosity of the suspending liquid is low; the thermal conductivity of the suspending liquid is practically the same. If viscous heating would have played a significant role, then this would have caused a stronger shear‐thinning behavior for the experiments for which the viscosity of the suspending liquid is high than for the experiments for which the viscosity of the suspending liquid is low. However, the flow behavior is nearly Newtonian for the experiments for which the viscosity of the suspending liquid is high. The current experiments show that the experiments with suspensions with the low‐ viscosity suspending liquid yield a more pronounced shear thinning behavior than the experiments with suspensions with the low‐viscosity suspending liquid. According to the theories referred to above, then the shear thinning behavior should be similar. Therefore, it is conjectured that the shear thinning behavior observed in the current experiments is not due to particle migration or to viscous heating.
Viscosity of suspensions
57
Experiment Present, high μ Present, low μ Ferrini (1979) Gamonpilas1 (2016) Gamonpilas2 (2016) Zarraga1 (2000) Zarraga2 (2000)
Liquid type
Glycerine
1.08 Pa∙s
Particle material
PMMA
30 μm
PMMA
30 μm
Kallodoc
200 ‐ 230 μm
1.01 Pa∙s
PMMA
10 μm
1.01 Pa∙s
PMMA
52.6 μm
Corn syrup
3.55 Pa∙s
Glass
43 μm
Corn syrup – glycerine
1.98 Pa∙s
Glass
43 μm
0.035 Pa∙s 0.316 Pa∙s
Glycerine Mineral Oil Triton X‐100 77.93%, anhydrous zinc chloride 9.01%, water 13.06% Triton X‐100 77.93%, anhydrous zinc chloride 9.01%, water 13.06%
Table 3.3: Experiments in literature for solid volume fraction of
. .
Comparing the results from literature (with information on employed materials given in Table 3.3) with the results from the present study (Figure 3.9) shows that the trend observed in the results of the present experiments, i.e. that for an increasing viscosity of the suspending liquid the suspension behavior approaches Newtonian behavior is not generally valid, since Zarraga et al. (2000) used suspending liquids with viscosities between 2 and 3 Pa s and observed a strong shear‐thinning behavior. Gamonpilas et al. (2016) observed an increased relative viscosity when the particle diameter was small (see Figure 3.9) for his experiments with PMMA particles. This is similar to the observed trend in the present experiments also employing PMMA particles. However, they report an opposite trend for experiments with glass spheres, for which the relative viscosity decreased when smaller particles were used. This strongly suggests that the relation between relative viscosity and particle diameter depends on the particle material.
58
Viscosity of suspensions
Figure 3.9: The relative viscosity described in Table 3.3.
as a function of the shear rate . Experiments are
Shear thinning (or shear thickening) behavior of non‐Brownian, neutrally buoyant suspensions in the Stokes regime implies the existence of an additional time scale (Goddard (1982)). Mari et al. (2014) performed molecular dynamics simulations of dense non‐Brownian systems in which they accounted for lubrication forces and frictional interparticle forces. In addition, they introduced additional models ("critical load friction" and a model that mimics electrostatic repulsion) that constitutes an additional force and hence an additional time scale. In these simulations fluid inertia and particle inertia were negligible, and particle migration never develops due to the applied periodic boundary conditions. The results show shear thickening at higher solid volume fractions.
Viscosity of suspensions
59
3.3.6 Discussion The dependencies of the relative viscosity (or the relative consistency‐index ) on liquid viscosity and particle diameter d suggest a review of the dimensional analysis (see for example Stickel and Powell (2005)) that led to the expression for the relative viscosity as being solely dependent on solid volume fraction and , , as expressed in equation (3.2), for neutrally‐buoyant non‐ Brownian systems for which inertia effects are negligible (i.e. systems that are independent of Péclet and Reynolds numbers). In his overview of (dry) granular material flows, Campbell (2006) stresses the importance of particle elasticity for the proper understanding and description of the behaviour of granular material flows. Chialvo et al. (2012) performed molecular‐dynamics simulations of dry systems of spheres in simple shear. They noted an influence of particle stiffness at high shear rates. Campbell (2006) includes a particle stiffness k (with unit N/m), rather than an elastic modulus (such as Young’s modulus E), in the dimensional analysis. Within the current context, this results in the relative viscosity being dependent on an ∗ additional dimensionless parameter that involves the particle stiffness
,
∗
,
,
,
∗
.
(3.13)
Here the effect of the particle‐diameter distribution has not been taken into account and , may be dependent on the elasticity parameter ∗ . Notable is the quadratic dependence of ∗ on . The low and high liquid viscosities considered in the present study differ by a factor of ~30. The corresponding factors for ∗ differ by ~900, which are much larger than the factors due to variations in particle diameter (factors for d differ by ~2). The current experimental data are therefore not adequate to test the hypothesis expressed in equation (3.13). To this end, it is recommended to perform additional tests with a larger range in particle diameters and liquid viscosities. Additionally, it is recommended to consider systems with particles with different, but measurable stiffnesses. At present it is not clear whether an additional particle stiffness (as suggested by Campbell (2006)) or an additional force (as suggested by Goddard (1882)) is important. This can be investigated by performing measurements with suspensions at different temperatures (corresponding to different viscosity of the suspending liquid) and with particles of different diameter .
60
Viscosity of suspensions
3.4 Conclusions In this experimental study, parameters that determine the suspension behaviour, i.e.: (i) solid volume fraction, (ii) particle diameter, (iii) liquid viscosity, and (iv) shear rate, have been varied systematically, using the same particulate and liquid material for all experiments. The viscosity of suspensions is often assumed to depend only on the solid volume fraction and the maximum solid volume fraction of the solid phase , , as expressed by equation (3.2). The current experimental results show that this description does not hold in general: the suspension viscosity also depends on shear rate (non‐Newtonian behaviour), particle diameter d and viscosity of the suspending liquid . It has been shown that the dependence of the relative viscosity on shear rate can be represented well by Ostwald‐de Waele model that involves the relative consistency‐ index and the flow index N that, in general, will depend on solid volume fraction, particle diameter and suspending liquid viscosity. The relative consistency index increases with solid volume fraction . For low solid volume fractions , the behaviour is close to Newtonian (i.e. 1). The suspensions show shear thinning behaviour ( 1), except at high solid volume fractions for the suspensions based on the smallest particles with a suspending liquid with high viscosity (when shear thickening behaviour was observed, 1). This shear thinning behaviour becomes more pronounced at higher solid volume fractions. The results obtained for suspensions based on a liquid with a high viscosity are consistent with those reported in the literature: (i) the relative viscosity is (practi‐ cally) independent of particle diameter d, and (ii) suspensions with a bidisperse particle‐diameter distribution have a lower relative viscosity than mono‐disperse suspensions. For suspensions based on a liquid with a low viscosity, different behaviour is ob‐ served, in which the relative consistency‐index also depends on the particle diameter d. This has also been observed by Senepati et al. (2010). The relative viscosity is also significantly higher for systems with a low viscosity of the suspending liquid than for systems with a high liquid viscosity. Furthermore, the behaviour of bidisperse systems lies in between the behaviour of the corresponding monodisperse systems. The current investigation has shown that commonly used relations for the viscosity of suspensions are oversimplified. The present experiments show that in many practical applications, for example for sand‐water flows, the viscosity of suspensions also depends on the particle diameter as well as on the viscosity of the
Viscosity of suspensions
61
suspending liquid. This makes it difficult to directly compare the results of experiments with different particulate and/or liquid materials in a quantitative manner.
62
Viscosity of suspensions
4 NUMERICAL APPROACH The governing equations described in Chapter 2 need to be discretized and solved with a numerical method. Because the development of a specific numerical method for the system of equations was not feasible in the current project, the equations are solved using Ansys CFX 14.0, which has the advantage that additional variables and relations can be implemented relatively easily by user defined functions. This simplifies the implementation of different models for these additional variables. A disadvantage is that the numerical implementation, described in this chapter, is fixed, as there is not much freedom to change it.
4.1 Discretization method This section describes the discretization method used by Ansys CFX 14.0. The governing equations are discretized by a finite volume formulation. The computational domain is divided into hexahedral elements. The solution procedure is collocated, which means that all the variables are stored at the vertices. The pressure, volume fractions and velocities are solved simultaneously; no iterations are carried out between momentum and continuity equations.
Numerical approach
63
Figure 4.1: Control volume around a vertex on a two dimensional mesh.
Figure 4.1 shows a control volume in 2D, similar to the three‐dimensional volumes used in the numerical method. A vertex‐centred finite volume method is used. This means that around each vertex a control volume is defined, which is constructed by faces normal to the lines connecting neighbouring vertices. Within the finite volume method, it is often necessary to obtain the values for the variables at integration points on the bounding surface of the control volume by interpolation. For such interpolations linear shape functions are used.
Figure 4.2: Part of a control volume around a vertex on a two dimensional mesh, zoomed in on the integration points ip,1 and ip,2.
64
Numerical approach
Each integration point is associated with a part of the boundary of the control volume and a unit normal vector pointing outward of the control volume. The gradient of a variable at a vertex can be calculated using the integration points and their associated area and normal vector:
≅
1 ,
(4.1)
.
,
Here a summation is carried out over all integration points ip,i on the boundary of the control volume. Furthermore, , is the value of the variable at integration point ip,i and V is the volume of the control volume. Also, and are the area and normal vector associated with integration point ip,i, respectively. The value , is obtained by interpolation between the values in the surrounding vertices of , using linear shape functions. It is also necessary to evaluate derivatives at the integration points, this is done by: (4.2)
,
with the values of the variable at the surrounding vertices and functions associated with these vertices.
the shape
For the advection terms in the continuity and the momentum equations, the values of the variables at integration points are discretized by: (4.3) ∙ ,
Here is the value of at the upwind node, and the gradient of the variable at the same upwind node. The vector is the vector from the upwind node to the integration point ip. Note that for 0 this scheme corresponds to a first‐order upwind difference scheme and for 1, this scheme corresponds to a second‐ order upwind difference scheme. In the present work a High Resolution Scheme is used. In this scheme, the limiter is calculated at each node according to Barth and Jespersen (1989). This limiter has been shown to be total variation diminishing (TVD) for one‐dimensional problems. The discretization of the equations associated with the turbulence model is of first order accuracy. It means that for the advection terms in the equations for the turbulent kinetic energy k and the turbulent eddy dissipation , the limiter is set to zero. In the present work, pressure and velocity are stored at the same vertices. In order to avoid pressure‐velocity decoupling, the discretization of the advection term is modified in a similar strategy as in the scheme of Majumdar (1988). For the time discretization, a second‐order Backward Euler scheme is used.
Numerical approach
65
4.2 Numerical procedure and implementation Figure 4.3 shows the numerical procedure that is used to solve the system of equations numerically.
Iteration step for continuity and momentum equations Iteration within current timestep Iteration step for tubulence equations
Increase in time
Convergence criteria satis�ied? no yes Figure 4.3: Flow chart of the numerical procedure.
At every point in time, a number of iteration loops is performed, until the convergence criterion is satisfied. In the present work the convergence criterion is that the normalized residuals of continuity and momentum equations are lower than 1 ∙ 10 . When this criterion has not yet been met after an iteration cycle, another iteration cycle is performed at the current point in time. This cycle is repeated until the convergence criterion is met. Subsequently, the simulation time is increased with the time step size and a new loop of iteration cycles is performed, using the solution of the previous time as an initial guess for the solution. The minimum and maximum number of iteration cycles at each simulation time is set to 5 and 25, respectively. The linearized system of discretized governing equations is written in matrix form as . This system is solved using a multigrid enhanced Incomplete Lower Upper (ILU) factorization technique. This solution procedure is known as a coupled solver, which means that the discretized continuity and momentum equations are solved simultaneously. This method is more robust than so‐called segregated
66
Numerical approach
solvers, which solve the continuity and momentum equations separately and iterate between the momentum and the continuity equations. The chosen time step size for transient solutions needs to be small enough to obtain a non‐diverging solution within the iteration cycles. In the present work a time step size of 0.02 s is often small enough for the solution to converge, although sometimes it is necessary to adjust it to a value of 0.01 s or 0.005 s in order to obtain a converged solution. The following functions have been implemented by user defined functions: Momentum transfer due to drag Momentum transfer due to virtual mass Suspension viscosity Solid particle pressure Solid particle shear stress The models are described in section 2.2. Sometimes it is necessary to adjust these models at asymptotes, so that their values cannot be infinitely large or to prevent division by zero. The details of the implementation of the models are given in Appendix C.
Numerical approach
67
5 RESULTS NUMERICAL SIMULATIONS In this chapter the results for the numerical simulations are presented. The numerical simulation model described in the chapter 4, based on the governing equations and the constitutive relations given in chapter 2, has been used. Section 5.1 describes the numerical simulations of sedimentation in a sedimentation column. Section 5.2 describes the numerical simulations of the flow inside a geometry representative for a hopper.
5.1 Sedimentation The first case considered is sedimentation in a vertical sedimentation column. Sedimentation of suspensions has been the subject of investigation for many years. Important aspects of sedimentation of suspensions have been summarized by Davis and Acrivos (2003). Sedimentation of suspensions has been analysed theoretically, for example by Burgers (1942) and Batchelor (1972), who studied the dilute suspension regime. One‐dimensional sedimentation is also studied experimentally,
Results numerical simulations
69
for example by Richardson and Zaki (1954) and Maude and Withmore (1958), in order to determine the influence of the solid volume fraction on the sedimentation velocity, known as ‘hindered settling’. Kynch (1952) derived a theory for one‐ dimensional sedimentation of suspensions and determined the height of the particle bed at the bottom of the sedimentation column as a function of time and sedimentation velocity. Multi‐dimensional sedimentation inside inclined sedimentation columns has been subject of investigation since Boycott (1920) noticed that the sedimentation process occurs at a much faster rate if a sedimentation column is positioned at an angle of inclination instead of being positioned vertically. This increase of sedimentation rate, now known as the Boycott effect, is caused by the recirculating flow pattern inside the inclined vessel. The particles move downwards along the lower side wall and the fluid moves upwards along the upper side wall. This is in contrast with one‐ dimensional sedimentation, for which the fluid is moving upwards at the same location as where the particles are moving downwards, enhancing the drag exerted on the particles. Sedimentation in inclined sedimentation columns has been investigated by Nakamura and Kuroda (1937), Hill (1974), Acrivos and Herbolzheimer (1979) and Kapoor and Acrivos (1995) amongst others, who predicted the relationship between the sedimentation velocity on the width, height and angle of inclination of the sedimentation column. The Boycott effect has also been exploited industrially in large‐scale settlers. In this section the sedimentation process is merely used to test the models for the interfacial drag and for the particle pressure. Hence, one‐dimensional, vertical sedimentation is chosen as a test problem. The influence of the solid volume fraction on the sedimentation velocity is determined by the drag relation, described in section 2.2.3.1. Since the flow solution for steady one‐dimensional, vertical sedimentation is known, numerical results can be compared with the theoretical solution. The flow is governed by the continuity and momentum equations (2.1), (2.2), (2.3) and (2.4), in which the turbulence model is disregarded.
5.1.1 Flow solution Sedimentation of a suspension in a sedimentation column is regarded. Initially, the column contains a homogeneous mixture of sand and water, with a solid volume fraction . Because the sedimentation process is quasi‐1D and there is no shear, the only constitutive models that affect the flow are the model for the momentum transfer between the two phases and the model for the static particle pressure.
70
Results numerical simulations
Inside a suspension with different density of the solid phase and the fluid phase, the pressure gradient will be given by: (5.1)
The momentum transfer between the phases can be determined directly from the momentum equations for the fluid and that for the solid phase, equations (2.3) and (2.4):
1 2
.
(5.2)
if the solid phase is assumed to This equation can be solved for slip velocity consist of monodisperse spherical particles. For the drag coefficient , an appropriate relation can be used. In this work, the relation of Beetstra et al. (2007), given in equation (2.41), is used. The parameters used in this section for the simulations of sedimentation are given in Table 5.1, with water and sand chosen for the fluid and solid phase, respectively.
Parameters
Magnitude
Density fluid phase Density solid phase Volume fraction of solid phase α Particle diameter d Fluid viscosity (without particles)
1000 kg/m3 2600 kg/m3 0.3 1 mm 1 mPa∙s
Table 5.1: Parameters for sedimentation calculations
When equation (5.2) is solved for the parameters given in Table 5.1, the flow solution inside the suspension becomes the solution given in Table 5.2.
Solved variable
Magnitude
Velocity solid phase us Velocity fluid phase uf Drag coefficient CD Pressure gradient
‐0.0460 m/s 0.0197 m/s 3.38 ‐1.45∙104 Pa/m
Table 5.2: Flow solution for sedimentation of suspension for parameters given in Table 5.1.
When a bed of particles is formed, the velocity in solid and fluid phase become zero and the gradients of the pressure and the solid pressure become: ,
Results numerical simulations
71
,
(5.3)
,
,
This means that the fluid pressure will be equal to the hydrostatic pressure of the fluid. The static particle pressure , is carrying the net weight of the particles in the particle bed. If the solid volume fraction varies in one direction only, and if is known, equation (5.3) reduces to: ,
,
(5.4)
,
/
Here, height z is assumed to be the only dimension over which , is varying. At the top of the bed, at height , the boundary condition , 0 applies. When all the particles that were initially present in the domain are situated inside the particle bed, the force applied to the particles at the bottom of the bed has to be equal to the total net weight of the particles in the domain:
0,
,
0
,
(5.5)
.
,
Here, is the area of the bottom of the sedimentation column and , is the total volume of the particles that are present in the domain initially. The ordinary differential equation given in equation (5.4), together with the boundary conditions given in equation (5.5), can be solved numerically by the Euler method to give the solution for the solid volume fraction as a function of the height of the particle bed.
5.1.2 Models for the static particle pressure Results are compared for two different particle pressure models, a model in the form of Gidaspow (1994) and Gidaspow and Syamlal (1985) and a model in the form of Chauchat et al. (2013). The latter expresses the particle pressure as a function of the particle volume fraction, (5.6) ,
,
whereas Gidaspow (1994) and Gidaspow and Syamlal (1985) define the pressure gradient directly:
,
,
≡
.
(5.7)
is called the modulus of elasticity. Gidaspow (1994) proposed the following form for this modulus of elasticity:
72
Results numerical simulations
∗
(5.8)
.
Here, ∗ is the volume fraction for which the particle pressure gradient equals . The parameter C determines the rate at which the particle pressure increases when the volume fraction increases. The form for the particle pressure that has been proposed by Chauchat et al. (2013) is:
∗
,
∗
,
0 Pa.
,
∗
,
(5.9)
.
Here E is a proportionality constant and ζ determines the rate of change of the solid pressure and ∗ is the solid volume fraction above which the particle pressure sets in. This formulation can also be cast in the form by writing , as: ∗
∗
0,
, ,
∗
(5.10)
.
The parameters for these models that have been used in the calculations are given in Table 5.3. Note that the form for the particle pressure gradient as proposed by Gidaspow (1994) and Gidaspow and Syamlal (1985) is written in the form , . A (very small) constant of integration can be added to ensure , 0 Pa when the volume fraction 0. This constant of integration has been neglected in present simulations.
Model Chauchat et al. (2013) ,
∗
Variables ∗
1 ∙ 10 Pa, 0.40, 3.
Gidaspow and Syamlal (1985)
∗
,
∗
500, 1 Pa, 0.578.
Table 5.3: Models for static particle pressure (2013) and Gidaspow and Syamlal (1985).
,
, as proposed by Chauchat et al.
Note that the parameters for the model for the particle pressure in the form of Chauchat et al. (2013) have been adjusted. The parameters in their model have been chosen in such a way that it describes a bed of particles consisting of polystyrene beads, with a density of 1.05 kg/m3 in silicone oil with a density of 0.95 kg/m3. Their
Results numerical simulations
73
choice for the parameters that determine the particle pressure model are ∗ 0.57, ζ 4.5 and a proportionality constant E that depends on the solid volume fraction ∗ and has a magnitude of order 1 ∙ 10 Pa for . When these parameters would have been used in the current simulations of sedimentation of sand in water, a particle bed will form at a solid volume fraction of 0.7. The parameters are therefore tuned in such a way that a particle bed will form at a solid volume fraction 0.55. In this way the maximum solid volume fraction is in agreement with that of the experiments in chapter 3, in which a maximum solid volume fraction , in the range of 0.52 – 0.57 has been found to be appropriate for suspensions in which the viscosity of the liquid is low.
Static Particle Pressure (Pa)
10000
8000 6000
Gidaspow and Syamlal (1985) Chauchat et al. (2013)
4000 2000
0
0.2
0.4
Solid Volume Fraction s (‐)
0.6
Figure 5.1: Static particle pressure as function of solid volume fraction . The parameters for the models in the form of Gidaspow and Syamlal (1985) and by Chauchat et al. (2013) are given in Table 5.3.
Figure 5.1 shows that for the model of Gidaspow and Syamlal (1985) the particle pressure increases rapidly when the solid volume fraction becomes higher than ∗ . For the model by Chauchat et al. (2013), ∗ is smaller, and therefore the range of solid volume fractions for which the particle pressure is non‐zero is larger. However, the slope for ∗ is smaller for the model of Chauchat et al. (2013) than for the model of Gidaspow and Syamlal (1985). This implies that when the model of Gidaspow and Syamlal (1985) is used to model a particle bed, the solid ∗ volume fraction will be near ∗ , since for small changes in solid volume fraction will result in large differences in static particle pressure. When the model
74
Results numerical simulations
of Chauchat et al. (2013) is used to model a particle bed, the solid volume fraction will have a wider range.
5.1.3 Numerical setup The computational domain (Figure 5.2) consists of a column with dimensions of 0.1 m, 0.1 m and 1 m in width, depth and height, respectively. The bottom of the computational domain consists of a wall at which a no‐slip condition is applied, the top of the domain consists of an opening with a zero gradient boundary condition for the pressure and the velocity. At the other boundaries a symmetry boundary condition is employed, which implies that the velocity and the gradients of velocity and pressure are zero in the directions normal direction to these boundaries. Because of the finite volume formulation used, at least three vertices are needed in width and depth direction. The number of vertices along the height of the domain is varied in order to investigate the effect of grid size on the numerical solution. Initially, the domain contains a homogeneous suspension with a solid volume fraction of =0.30, from the bottom up to a height of 0.8 m. The top part of the domain contains pure water.
Figure 5.2: Overview of computational domain. Width 0.1 m, depth 0.1 m, height 1 m, shown are 101 grid points in vertical direction.
Results numerical simulations
75
5.1.4 Results ∗ Figure 5.3 shows that after five seconds, a bed of particles, at 0.4, has formed in the bottom part of the sedimentation column. At the top, the particle volume fraction equals zero, as expected. For the region in the middle of the domain, at a height between 0.36 m and 0.59 m, a region exists where the particle volume fraction equals the initial solid volume fraction 0.30, and the sedimentation is not yet complete.
Figure 5.3: Contour plot of the solid volume fraction after 5 s for the 101x3x3 grid. The ∗ with , particle pressure is modelled by Chauchat et al. (2013) as , ∙ Pa, ∗ . .
76
Results numerical simulations
1
101x3x3 201x3x3 401x3x3 801x3x3
height (m)
0.8 0.6 0.4 0.2 0 0
0.1 0.2 0.3 0.4 Solid volume fraction s (‐)
0.5
Figure 5.4: Volume fraction vs height after 5 s for different grid sizes. The particle ∗ pressure is modelled by Chauchat et al. (2013) as , with , ∙ Pa, ∗ . .
Figure 5.4 shows that at the bottom of the domain the volume fraction is varying from 0.40 at the top of the particle bed, which is the volume fraction ∗ at which the particle pressure model sets in. A gradient of the particle pressure / is present, leading to a gradient in the solid volume , , fraction. Figure 5.5 and Figure 5.6 show that the solution for the velocity distribution of the fluid and solid phase agrees with the solution obtained in Table 5.2 in the region of constant solid volume fraction . The downward movement of the particles, 0.0460 m/s, causes the fluid to move upwards with a velocity of 0.0197 m/s, so that the slip velocity has the magnitude that satisfies equation (5.2). Across the discontinuity between the particle bed and fluid on top of the particle bed spurious variations of the velocity are present, but they reduce when the grid is refined. Also between the discontinuity of suspension and the pure fluid at a height of 0.57 m, spurious variations of the velocity are present. Figure 5.6 shows that the velocity of the solid phase is reduced by the action of the particle pressure and due to the increase in solid volume fraction , which causes a higher drag coefficient , and therefore a lower slip velocity between the two phases.
Results numerical simulations
77
1
height (m)
0.8 0.6 0.4 101x3x3 201x3x3 401x3x3 801x3x3
0.2 0
0
0.01 0.02 0.03 0.04 Velocity fluid phase (m/s)
0.05
Figure 5.5: Velocity of the fluid phase vs height after 5 seconds for different grid sizes for ∗ model of solid pressure by Chauchat et al. (2013) as , with , ∗ Pa, . . ∙
1
height (m)
0.8 0.6 0.4 0.2 0
101x3x3 201x3x3 401x3x3 801x3x3 ‐0.1 ‐0.05 Velocity solid phase (m/s)
0
Figure 5.6: Velocity of the solid phase vs height after 5 seconds for different grid sizes for ∗ for model of solid pressure by Chauchat et al. (2013) as , with , ∗ Pa, . . ∙
78
Results numerical simulations
Figure 5.7 and Figure 5.8 show the gradient of the pressure distribution and the gradient of the solid pressure distribution in the domain. At the top of the domain, the solid volume fraction and solid pressure are zero. Therefore, the pressure gradient equals the hydrostatic fluid pressure gradient . Inside the suspension, the solid pressure gradient is also zero, and the pressure gradient is given by equation (5.1). In the particle bed, the pressure gradient is gradually decreasing. At the bottom of the domain, where the velocity of the solid phase is zero, the particle pressure is carrying the net weight of the particles, as expected. At this point the gradient of the fluid pressure equals the gradient of the hydrostatic fluid pressure . A non‐diverging solution could only be obtained on a coarse grid with 51x3x3 grid points. For the grid with 101, 201, 401 and 801 grid points in vertical direction in the domain the solution diverged after 8.3 s, 8 s, 7.9 s and 8 s, respectively. For all calculations a time step size of 0.01 s has been used.
1
101x3x3 201x3x3 401x3x3 801x3x3
height (m)
0.8 0.6 0.4 0.2 0 ‐15000
‐10000 ‐5000 Pressure Gradient (Pa/m)
0
Figure 5.7: Pressure gradient vs height after 5 seconds for different grid sizes, for model ∗ with , ∙ of solid pressure by Chauchat et al. (2013) as , Pa, ∗ . .
Simulations on a 101x3x3 grid with a time step of 5 ∙ 10 s, 1 ∙ 10 s and 2 ∙ 10 s resulted in divergence after 8 s, 8.3 s, and 8 s, respectively. The solution for a time step of 4 ∙ 10 s did not diverge. Figure 5.9 shows that the spurious velocities after 5 seconds of simulation time are similar for all time step sizes. Because the spurious velocities are the main anomaly in the numerical solution, for improvement of the solution the reduction of the grid spacing is favourable over time step reduction.
Results numerical simulations
79
1
height (m)
0.8
101x3x3 201x3x3 401x3x3 801x3x3
0.6 0.4 0.2 0 ‐15000
‐10000 ‐5000 Solid Pressure Gradient (Pa/m)
0
Figure 5.8: Solid pressure gradient vs height after 5 seconds for different grid sizes, for ∗ for model of solid pressure by Chauchat et al. (2013) as , with , ∗ Pa, . . ∙
1
height (m)
0.8 0.6 0.4 0.2 0 ‐0.04
t= 510‐3 s t= 110‐2 s t= 210‐2 s t= 410‐2 s ‐0.02
0
0.02
0.04
Velocity fluid phase (m/s)
0.06
Figure 5.9: Fluid velocity vs height after 5 seconds for different time step sizes on a 101x3x3 grid, for for model of solid pressure by Chauchat et al. (2013) as , ∗ with , ∙ Pa, ∗ . .
80
Results numerical simulations
The present numerical method gives large spurious oscillations in the velocity at the control volumes around discontinuities, see for example Figure 5.9, with large spurious velocities present at the locations where discontinuities in the solid volume fraction are present at a height of 0.59 m and a height of 0.36 m. Figure 5.5 shows that these spurious oscillations in the velocity reduce for smaller grid sizes. These spurious oscillations in the velocity originate from the treatment of the pressure terms in the momentum equations. In the numerical method, the momentum equations are changed into a control volume formulation. For example, the pressure term in the momentum equation of the fluid phase is determined by: (5.11)
The term on the right hand side is discretized according to equation (4.1). Here, the pressure is determined at the integration points and the volume fraction is the value of the volume fraction at the vertex around which the control volume is constructed. Considering two neighbouring control volumes with strong volume fraction gradients, the term in equation (5.11) will be dependent on the control volume from which it is determined. This means that in the current formulation, the fluxes at the boundaries are dependent on the average volume fraction of the neighbouring control volumes and on the size and the flow properties of these control volumes, hence the dependence of the spurious velocities on the grid size, see Figure 5.5. This originates from the averaging procedure, for which the 〉 assumption ∙ 〈 has been made, see equation (B‐ 4) i.e. that the averaged pressure is related to the average volume fraction . When the gradient in the volume fraction is high, the difference between pressure and volume fraction at the boundary of the domain and the averaged pressure and volume fraction can be too large to describe the flow accurately. A solution for this problem is not straightforward, it appears to be inherent to the averaging procedure, in which the volume fraction must be representative for the whole control volume. If there is a strong gradient in the volume fraction present in the control volume, this requirement is no longer met. Note that the presence of a particle pressure around the discontinuity at a height of 0.36 m in Figure 5.9 can reduce the spurious oscillations in the velocities, so perhaps a solution to this problem may be found in this direction.
Results numerical simulations
81
5.1.4.1 Comparison between the results for different models for particle pressure
height (m)
The results for the model of Gidaspow and Syamlal (1985) can be compared with the results for the model of Chauchat et al. (2013). The parameters for these two models are given in Table 5.3. For this comparison, a grid size of 101x3x3 vertices has been used, with a time step of 5∙10‐3 s. The solution for the model of Gidaspow and Syamlal (1985) diverged at a simulation time of 3.2 s. Therefore, solutions of both models are compared after 3 s of simulation time. For the model of Gidaspow and Syamlal (1985), the particle pressure , is smaller than 1 Pa up to a volume fraction of 0.578 and is increasing exponentially with further increase of the solid volume fraction . The solution for the model of Gidaspow and Syamlal (1985) is very sensitive to changes in time step. For the 101x3x3 grid, it has been attempted to obtain a solution for time steps of 1∙10‐2 s, 5∙10‐3 s, 1∙10‐3 s and 5∙10‐4 s. For the time step of 5∙10‐3 s the solution diverged after 3.2 s, for the other time step sizes the solution diverged within the first second of the simulation. 1 Chauchat et al. (2013) Gidaspow & Syamlal (1985) 0.8
0.6 0.4 0.2 0 0
0.1
0.2 0.3 0.4 0.5 Solid volume fraction s (-)
0.6
Figure 5.10: Solid volume fraction vs height after 3 seconds of simulation time for different models for the particle pressure , .
82
Results numerical simulations
1
height (m)
0.8
Chauchat et al. (2013) Gidaspow & Syamlal (1985)
0.6 0.4 0.2 0 ‐0.04
‐0.02 0 0.02 0.04 Velocity fluid phase (m/s)
0.06
Figure 5.11: Velocity of the fluid phase vs height after 3 seconds of simulation time for different models for the particle pressure , .
1
height (m)
0.8
Chauchat et al. (2013) Gidaspow & Syamlal (1985)
0.6 0.4 0.2 0 ‐12000 ‐10000 ‐8000 ‐6000 ‐4000 ‐2000 Solid Pressure Gradient (Pa/m)
0
Figure 5.12: Solid pressure gradient vs height after 3 seconds for different models for the solid pressure , .
Results numerical simulations
83
Figure 5.10 shows the vertical distribution of the solid volume fraction after 5 seconds of simulation time. The gradient of the solid volume fraction in the particle bed is much lower for the model of Gidaspow and Syamlal (1985). This is caused by the exponential increase of static particle pressure for increasing solid volume fraction. Figure 5.11 shows that the spurious oscillations of the velocity at the upper boundary of the particle bed are increased. In the model of Gidaspow and Syamlal (1985), inside the particle bed the velocity of the fluid phase is close to zero, see equation (5.11), because all momentum transfer is decreased rapidly due to the increase in particle pressure, and because the solid volume fraction is high, causing a low slip velocity. Figure 5.12 shows that for the model of Gidaspow and Syamlal (1985), the gradient of the solid particle pressure is approximately equal to , so that the particle pressure is in balance with the net weight of the particles and the gradient of the pressure is close to the hydrostatic pressure. Because the two models have a different form, a different rate of change of the particle pressure with respect to the volume fraction and a different solid volume fraction at which the particle pressure has significant magnitude, it is difficult to compare the results of the models quantitatively. Therefore, the model of Chauchat ∗ et al. (2013), given by , , is varied in a systematic way.
84
Results numerical simulations
5.1.4.2 Parameter study In this section the parameters of the models in the expression for P , ∗ E α α∗ and P , 1/C G e are varied in a systematic way. Aim of this investigation is to find a model for the particle pressure , that is numerically stable. Firstly, the results of the numerical simulations are presented. Secondly, the stability and error estimation are addressed. The model of Chauchat et al. (2013), given by P , E α α∗ , is investigated, by varying the proportionality constant E, the rate of increase , and the solid volume fraction above which the particle pressure is non‐zero, ∗ . Figure 5.13 shows the results for the case the proportionality constant E has been varied.
1
6
E = 110 Pa 6
E = 210 Pa
height (m)
0.8
E = 4106 Pa
0.6 0.4 0.2 0 0
0.1
0.2 0.3 0.4 0.5 Solid volume fraction s (-)
0.6
Figure 5.13: Solid volume fraction vs height after 5 seconds of simulation time for model ∗ , with ∗ . and of solid pressure by Chauchat et al. (2013) as , , for various values of E.
The solution for 1 ∙ 10 Pa diverged after 8.3s. The results for 2 ∙ 10 Pa and 4 ∙ 10 Pa did not diverge within 100 s of simulation time. The results for various values of the proportionality constant E show that for larger values of E the gradient of the volume fraction inside the particle bed is lower. The solid volume fraction at the bottom of the domain has a lower value when the proportionality constant E is high, which is expected because its value is determined by the particle pressure , and therefore higher values of E result in lower values of .
Results numerical simulations
85
The non‐diverging solutions for 2 ∙ 10 Pa and 4 ∙ 10 Pa can be compared to a numerical solution of a steady particle bed, obtained by solving the ordinary differential equation that describes the solution for a static particle bed, equation (5.4), together with the boundary conditions given in equation (5.5), by the Euler method. To obtain the solution by the Euler method, the boundary condition at the top of the bed at a height is slightly changed to 0.405, with particle pressures of , 0.25 Pa and , 0.5 Pa for the particle pressures for the models with 2 ∙ 10 Pa and 4 ∙ 10 Pa, respectively. This is done because equation (5.4) is singular for 0.4, , 0. Steps of Δ 1 ∙ 10 m have been taken. 0.5
height (m)
0.4 0.3 0.2
6
E = 210 Pa by flow solver 6
0.1
E = 410 Pa by flow solver 6
E = 210 Pa by Euler method 6
0 0
E = 410 Pa by Euler method
0.1
0.2 0.3 0.4 Solid Volume Fraction
0.5
s
Figure 5.14: Solid volume fraction vs height after 100 seconds of simulation time for various values of E for model of solid pressure by Chauchat et al. (2013) as , ∗ , with ∗ . and , compared with the solution for equation (5.4) for a particle bed solved by the forward Euler method.
Figure 5.14 shows that the particle bed, obtained by the flow solver is in agreement with the solution of the differential equation, given by equation (5.12), obtained by the Euler method. The solution only differs near the top of the bed. This is caused by the spurious velocities, present in the numerical solutions. The spurious velocities are created because at the top of the bed the governing equations, used in the flow solver, can never obtain a solution in agreement with the solution by the Euler method. Apart from the small errors near the bed surface, the solid volume fraction inside the particle bed is predicted correctly.
86
Results numerical simulations
1
*s = 0.3 *s = 0.4
height (m)
0.8
*s = 0.6
0.6 0.4 0.2 0 0 1
height (m)
0.8 0.6
0.2 0.4 0.6 Solid volume fraction s (-)
0.8
*s = 0.3 *s = 0.4 *s = 0.6
0.4 0.2 0 ‐12000 ‐10000 ‐8000 ‐6000 ‐4000 ‐2000 Solid Pressure Gradient (Pa/m)
0
Figure 5.15: Solid volume fraction and gradient of the solid pressure vs height after 5 seconds of simulation time for various values of ∗ for model of solid pressure by ∗ , with ∙ Pa and . Chauchat et al. (2013) as ,
The results for various values of ∗ are given in Figure 5.15. The values for solid volume fractions in the particle bed are larger for larger ∗ . Therefore, the height of the particle bed is larger when the value for ∗ is low. Large values for the solid volume fraction inside the particle bed result in a larger particle pressure gradient (see Figure 5.15: bottom figure), because the gradient of the particle pressure has to balance the larger net weight of the particles. The gradient of the particle pressure / can be written as the product of / and / . Therefore, a
Results numerical simulations
87
larger value for ∗ leads to a larger value of the gradient of the volume fraction / (see Figure 5.15: top figure). The solutions for ∗ 0.4, 0.5 and 0.6 diverged after 8.3, 0.3 and 7.8 seconds of simulation time, respectively. The result for ∗ 0.3 did not diverge within 100 seconds of simulation time. 1
= 3 = 2
height (m)
0.8 0.6 0.4 0.2 0 0
1
height (m)
0.8
0.1
0.2 0.3 0.4 0.5 Solid volume fraction s (-)
0.6
= 3 = 2
0.6 0.4 0.2 0 ‐10000
‐8000 ‐6000 ‐4000 ‐2000 0 Solid Pressure Gradient (Pa/m) Figure 5.16: Solid volume fraction and gradient of the solid pressure vs height after 5 seconds of simulation time for various values of for model of solid pressure by Chauchat ∗ et al. (2013) as , , with ∙ Pa and ∗ . .
An attempt has been made to obtain a numerical solution for =1,2,3,4 and 5, but only for =2 and =3 results have been obtained. The solution for =3 diverged after
88
Results numerical simulations
8.3 s. The solution for =2 did not diverge within 100 s of simulation time. The vertical distribution of the volume fraction and gradient of the solid pressure are shown in Figure 5.16. The particle pressure gradient / can be written as the product of / and / . Because the derivative of the particle pressure with respect to the solid volume fraction / is higher for 2, the gradient in solid volume fraction / is lower for 2. Variation of parameter shows that stability is increased for lower , because for 4 and 5 no results have been obtained. However, cannot be too low, because it can lead to instabilities at the top of the particle bed. At this location the model for the particle pressure has to allow for a particle pressure close to zero. When the chosen form for the particle pressure equals the form of Chauchat et al. (2013) i.e. P , E α α∗ , the parameter variation of E, ∗ and ζ shows that stability is increased for:
A high value for E A low value for α∗ A value of 2 or 3 for ζ
The reasons behind these trends are investigated in section 5.1.4.4 and 5.1.4.5.
Results numerical simulations
89
5.1.4.3 Direct implementation of the gradient of the solid pressure The solid pressure gradient can also be implemented in the numerical method directly, by writing the pressure gradient as with , ∗ . When a suspension with a solid volume fraction 0.30 is taken as an initial condition, this model diverges immediately. Therefore, this model is ∗ analysed for an initial condition of the solution for , , with ∗ 1 ∙ 10 Pa, 0.40, 3, after 5 s of sedimentation. For these simulations, the grid of 201x3x3 grid points is used, with a time step of 0.01s.
1
height (m)
0.8
Pp,stat = G(s) (s)
Pp,stat = f(s)
0.6 0.4 0.2 0 ‐0.1
0 0.1 0.2 Velocity fluid phase (m/s)
0.3
Figure 5.17: Velocity of the fluid phase vs height after 5.03 seconds for the models and . The solution for the model of , , , after a simulation time of 5s is taken as the initial condition.
Figure 5.17 shows a comparison of the vertical distribution of the fluid velocity in the domain for the implementation of the particle pressure by prescribing , and the implementation of the particle pressure gradient by prescribing . The numerical solution diverges after a few time steps. , Therefore, the results after three time steps is shown. When the particle pressure is prescribed by , , spurious oscillations in the distribution for the velocity occur at the discontinuities in the solid volume fraction at a height of 0.38m and 0.57m. When the gradient in particle pressure is modelled by prescribing , the gradient of the particle pressure at the discontinuity at the ,
90
Results numerical simulations
particle bed surface is overpredicted, see Figure 5.18. This overprediction causes large spurious oscillations in the velocity, as shown in Figure 5.17. In the current simulations, in which the particle pressure gradient was modelled by prescribing , the solutions diverged for all grid sizes and time step sizes. ,
1
Pp,stat = G(s) (s)
Pp,stat = f(s)
height (m)
0.8 0.6 0.4 0.2 0 ‐6
‐4 ‐2 0 2 Solid Pressure Gradient (Pa/m)
4 4
x 10
Figure 5.18: Gradient of solid pressure vs height after 5.03 seconds for the models and . , ,
Results numerical simulations
91
5.1.4.4 Error estimate at the surface of the particle bed Figure 5.19 shows the solution around the interface between the suspension and the particle bed. The numerical values at the vertices are listed in Table 5.3.
Figure 5.19: Contour plot, zoom at the interface between bed and suspension for the and . Results are shown after 5.03 seconds for models , , the models , and . ,
Vertex number (see Figure 5.19) 1 2 3 4 5 6
Solid volume fraction 0.431 0.424 0.330 0.302 0.300 0.300
Particle pressure (Pa)
Particle pressure gradient (Pa/m)
29.30 13.79 0 0 0 0
‐3352 ‐2930 ‐1379 0 0 0
Table 5.4: Values of variables at the vertices for the solution shown on the right‐hand side of Figure 5.19, for the model , .
92
Results numerical simulations
Inside the particle bed a static particle pressure will be present. The static particle pressure will create a gradient of the particle pressure inside the particle bed and in the first control volume above the bed. The gradient of the particle pressure in the control volume just above the particle bed can be approximated as:
,
,
,
2
(5.12)
.
This can be verified by the values in Table 5.3. For the present simulation 0.005 m, so the value of the particle pressure, , , in the control volume around the vertex just inside the particle bed, with a volume fraction larger than 0.4 (vertex 2, , 13.79 Pa), determines the value of the gradient of the particle pressure in the vertex just outside the particle bed (vertex 3, 13.79/ 2 ∙ , , 0.005 1379 Pa/m). The presence of a particle pressure in the control volume around the vertex just outside the particle bed (vertex 3), will decelerate the particles inside this control volume. Some of the particle pressure models do not allow low values of , in the control volume just inside the particle bed. This will result in a gradient of the particle pressure in the control volume just outside the particle bed that exceeds the weight of the particles at this location, causing large spurious oscillations in the velocities at this location, which can result in a diverging solution. This is often the ∗ case when the particle pressure is modelled by P , 1/C G e , (see ∗ Figure 5.11) as well as for the model P , E α α with ζ 1, which diverged within the first second from the start of the simulation. For calculations with different grid sizes, the predicted static particle pressure in the control volume just inside the particle bed, present in the numerator in , equation (5.12) will be close to zero for very fine grids. The particle pressure will decrease faster than the decrease of 2 , present in the denominator. Therefore, the solution is expected to converge when the grid is refined. When the gradient of the static particle pressure is modelled by , an error is made in the control volume just inside the particle bed where the pressure gradient can be approximated as: , , (5.13)
,
,
2
.
Both solid and fluid phase are accelerated due to a large overestimation of the gradient of the solid pressure in this control volume, see Table 5.5. Furthermore, for this model, the gradient of the solid pressure inside the control volume just inside the particle bed depends on the volume fraction of the solid phase in the control
Results numerical simulations
93
volume just outside the particle bed, rather than on the properties inside the particle bed. The overprediction of the gradient of the solid pressure increases with decreasing grid size, since only the denominator of equation (5.13) is affected when the grid size is reduced. Because of these reasons, when the gradient of the solid pressure is modelled with , the numerical error diverges after a , few time steps. In the present simulations, the numerical error diverged for all computations and grid sizes. Therefore, modelling the solid pressure directly by its gradient with , is to be discouraged.
Vertex number (see Figure 5.19)
Volume fraction
Particle pressure gradient (Pa/m)
1 2 3 4 5 6
0.449 0.468 0.385 0.183 0.295 0.299
29115 ‐37254 ‐58120 0 0 0
Table 5.5: Values of variables at the vertices for the solution shown on the left‐hand side of Figure 5.19, for the model . ,
94
Results numerical simulations
5.1.4.5 Stability The numerical stability inside the particle bed can also be assessed. Inside the particle bed, the gradient of the particle pressure has to carry the weight of the particles. Due to the addition of particles on top of the bed the pressure gradient will decrease a bit, causing the particles to move downwards due to gravity and Δα will be added to the solid volume fraction of the control volume in the bed. This difference in volume fraction can be approximated as:
(5.14)
.
Here is the time step and is the grid size. The velocity of the solid phase is determined by the drag relation. It will decrease for higher solid volume fractions, but will never be zero. This increase leads to a new particle pressure , Δ , which has to balance the weight of the particles for a stable numerical method, otherwise large gradients of the solid pressure will be predicted, that will exceed the weight of the particles:
~
(5.15)
.
This means that the derivative of the particle pressure needs to be of the same order of magnitude as the weight of the particles. This sensitivity can be assessed by regarding results of simulations with different particle diameters.
Particle diameter 0.25 mm 0.5 mm 1 mm 2 mm
Maximum Simulation time volume at divergence fraction 90 s 25.2 s 8.3 s 3.9 s
0.5514 0.5528 0.5525 0.5496
,
/
6.88∙104 Pa 7.00∙104 Pa 6.98∙104 Pa 6.71∙104 Pa
Table 5.6: Results for sedimentation of a suspension for different particle diameters. Pa, ∗ . and . ∙
Table 5.6 shows that the divergence of the solution occurs when the magnitude of the derivative of the particle pressure is around 7 ∙ 10 Pa. The sensitivity can also ∗ be assessed by changing the value of E in the model ,
Results numerical simulations
95
E (Pa) 0.5∙105 Pa 1∙106 Pa 2∙106 Pa 4∙106 Pa
Maximum Simulation time volume at divergence fraction 4.2 s 8.3 s >100 s >100 s
0.5525 0.5525 0.5235 0.4981
,
/
4.65∙104 Pa 7.00∙104 Pa 3.09∙104 Pa 1.92∙104 Pa
Table 5.7: Results for sedimentation of a suspension for different values of E for model of ∗ solid pressure by Chauchat et al. (2013) as , , ∗ . and .
Table 5.7 shows that if the constant E has a small value, large values of the derivative / are reached after shorter simulation times than for high values of E, , causing the solution to diverge. For higher values of E the solution is non‐diverging within 100 s of simulation time because large values of the derivative / , are not present in the flow solution. For the simulations with 1 ∙ 10 Pa on grids with 101, 201, 401 and 801 grid points in vertical direction the solution diverged after 8.3s, 8s, 7.9s and 8s respectively. For simulations on a 101x3x3 grid for time steps of 5 ∙ 10 , 1 ∙ 10 s and 2 ∙ 10 s resulted in divergence after 8s, 8.3s, and 8s, respectively. Therefore, the criterion in equation (5.15) does not appear to be dependent on grid size and time step size. For the model by Gidaspow and Syamlal (1985), the derivative of the particle pressure increases exponentially, causing the numerical solution to diverge when the particle bed exceeds a certain height. A model for the particle pressure in which the derivative of the particle pressure does not increase exponentially is to be preferred.
96
Results numerical simulations
5.1.5 Concluding remarks The numerical solutions predict the correct sedimentation velocities for the fluid phase and the solid phase inside the suspension. The numerical solution for different grid sizes shows that grid convergence can be obtained. The leading error in the numerical solutions are spurious oscillations in the velocity distribution present in control volumes with a high gradient of the volume fraction. This feature originates from the averaged governing equations and are reduced by grid refinement. The simulations show that it is possible to model a particle bed by implementation of a particle pressure that is dependent on the volume fraction of the solid phase . The particle pressure must be defined in such a way that at the interface between particle bed and surrounding flow, within the numerical solution the particle pressure can obtain a value close to zero, otherwise the solution diverges. Furthermore, in order to obtain numerical stability, the derivative of the particle pressure with respect to the volume fraction / needs to have the same , order of magnitude as the force it has to oppose, therefore, models for which this derivative is increasing rapidly are not useful. is favourable over modelling Modelling the solid pressure directly by , the gradient of the solid pressure with . Although being the , default option in CFX, in the present calculations, non‐diverging solutions have not been obtained for cases for which the gradient of the solid pressure was implemented directly as . ,
Results numerical simulations
97
5.2 Simulations of flow inside a hopper This section describes the results of flow simulations for a hopper‐like geometry. The aim of this investigation is to investigate whether the model described in chapter 2 can be used to make predictions on the filling time of a hopper and to investigate how flow parameters such as inlet velocity, particle diameter and solid volume fraction at the inlet of the hopper affect the filling time of the hopper. Van Rhee (2002) performed measurements and two‐dimensional flow simulations on sedimentation in a scale‐model hopper. The dimensions of this hopper were: length of 12 m, height of 2.25 m and width of 3.08 m. Typical inlet velocities were 0.03‐0.045 m/s and inlet solid volume fractions of 0.2‐0.3 in these experiments. Various inlet configurations have been considered, including a uniform distribution over the inlet of the hopper. The sand is present in a range of diameters. The particle size distribution is sampled at inlet as well as at outlet. Average particle sizes are in the range of 40‐160 m. Mixture velocities have been measured with Electromagnetic Velocity Meters, while solid volume fractions have been determined with Radioactive Density Meters. Solid volume fractions have been measured at the inlet and outlet, as well as at various locations at the hopper walls. Mixture velocities have also been measured at various locations near walls. At the start of these experiments, part of the hopper may be filled with a stationary sand bed and with water on top of the layer of sand. A nonzero outlet solid volume fraction at the outlet indicates that solid material leaves the hopper: overflow losses occur. Thus, the variation with time of the solid volume fraction at the outlet is an important parameter. A two‐dimensional computational model has also been developed by van Rhee (2002) that is rather specific to hopper sedimentation, based on two‐dimensional RANS‐equations for the mixture velocity. A standard k‐ turbulence model has been adopted that employs wall functions. The behaviour of the solid volume fractions of the various particle sizes is described by these convection‐diffusion equations, in which the diffusivity is based on the kinematic eddy viscosity for the mixture with an empirical correction factor. The velocities in these convection‐diffusion equations are obtained as follows. The horizontal velocities of the solid volume fractions are taken as equal to the horizontal mixture velocity, while the vertical velocities of the solid volume fractions are determined from the vertical mixture velocity and gravity‐induced slip velocities that depend on the solid volume fractions. As interparticle stresses are not accounted for in this model, the formation
98
Results numerical simulations
of a nearly stationary solid bed was described in a simplified manner. The evolution of the bed height with time has been based on a net sedimentation velocity that involves an empirically determined correction. The bed of particles is treated as a no‐slip wall, hence wall functions are employed. These wall functions are determined by the properties of the water. The comparison between results of this model and the experiments is termed to give fair resemblance for the concentration profiles. Measured and computed time‐ dependent velocity profiles show similar trends. Van Rhee (2002) also gives a literature overview of models that have been used to estimate the filling process of a hopper based on empirical relations, given by Dobbins (1944), Camp (1946), Groot (1981) and Vlasblom and Miedema (1995) These models are based on a two‐dimensional advection‐diffusion equation for a sand‐water mixture. The filling characteristics are based on estimates for the horizontal and vertical velocity components. Empirical relations have been added to take the effect of hindered settlement, turbulence and erosion on the diffusion and advection into account. The shortcomings of these models are that they are based on simplified relations for the velocities. The horizontal velocity profile is assumed to be uniform or logarithmic along the height of the hopper. The vertical velocity of the particles is based on an empirical relation for hindered settling with a constant solid volume fraction. Next to that, the inflow and outflow region are simplified or idealized.
5.2.1 Geometry description and boundary conditions The hopper geometry consists of a two‐dimensional geometry with a width of 5 meter and a height of 1 meter. In this way the ratio between the scale of the considered geometry and that of a hopper on a dredging ship is approximately 1:10. This scaling factor is chosen in such a way that the computation times in which the geometry fills with sand is in the order of days rather than weeks. The aspect ratio of 5 of the geometry is similar to that of a hopper on a dredging ship. With this aspect ratio it takes some (physical) time before the flow streamlines from inlet to outlet develop into straight lines and that in the first period of the simulation only the fluid phase (water) will be present at the outlet. The inlet has a height of 0.1 m and the outlet has a height of 0.2 m. The size of the inlet is smaller than that of the outlet so that the flow is not accelerated towards the outlet at the end of the filling process. The geometry is shown in Figure 5.20.
Results numerical simulations
99
Figure 5.20: The grid used for the prediction of flow in a hopper geometry.
The grid is created in such a way that it is almost equidistant in the direction of height and width in order to maintain similar resolution, as regions with shear move in time during the filling process. The total number of grid points is 87570, with approximately 90 grid points over the height of the domain and 350 over the width of the domain. The refinement towards the walls is chosen such that the values for lie in the range of 30 – 150 when the flow is still in suspension, which is needed for the wall functions that are applied near the wall (see section 2.2.4.2). At the inlet, the volume fractions of the solid and fluid phase, and , respectively, are specified as well as their (equal) velocities . At the outlet a uniform pressure is considered. The inlet and outlet are moved away from the main domain by an extension of the main domain so that the zero‐gradient condition at these boundaries does not affect the flow inside the main domain. Furthermore, if a uniform pressure boundary condition is applied at the outlet, the outlet needs to be placed horizontally, since the hydrostatic pressure inside the domain is unknown during the calculation. A vertical boundary with a specified uniform pressure can only be used when the hydrostatic pressure is known, which is not the case for these simulations, since the composition of the suspension at the outlet varies in time. At the bottom and the side walls of the domain a no‐slip condition is applied to both phases, which means that at the wall all the components of the velocity vector are zero. At the top boundary a free‐slip boundary condition is applied, stating that the velocity component normal to the boundary is zero, as well as that the shear stress is zero at the boundary. Also on the walls of the extensions toward inlet and outlet a free‐slip condition is applied, since these parts of the domain serve only as artificial extensions that are created to shift the locations of inlet and outlet conditions away from the domain of interest.
100
Results numerical simulations
5.2.2 Performance parameters In order to compare the results, the total mass of the solid phase inside the hopper and the elapsed time during the filling process can be scaled. The total mass is scaled , by the maximal volume that can be occupied by the solid phase, given by , where V is the total volume of the hopper geometry. The scaled solid mass is defined as:
,
(5.16)
.
,
Here, M is the total mass of the spatially averaged suspension inside the hopper, which is obtained from the local effective densities in the domain, V is the total volume of the hopper, and and are the densities of the solid and fluid phase, respectively. The scale in equation (5.16) corresponds to the mass of the solid phase: 0 corresponds with a hopper completely filled with water, 1 corresponds with a hopper in which the solid phase has reached its maximum volume fraction , everywhere in the domain. The maximum volume fraction , is determined by the solution of a static particle bed with a height that equals the height of the hopper geometry. The solution of this static particle bed is given by equation (5.4) in which the particle bed is assumed to be at rest, so that inside the particle bed the particle pressure is carrying the net weight of the particles. The ordinary differential equation is solved with the forward Euler method. The particle model in the form of Chauchat et al. ∗ (2013) by , , with, ∗ 0.4, 3. The value of is chosen equal to 1 ∙ 10 Pa or 4 ∙ 10 Pa for the particle pressure that is used in the flow simulations for the hopper geometry. The solutions for equation (5.4) over the height of the hopper geometry are presented in Figure 5.21.
Results numerical simulations
101
1
height (m)
0.8 0.6 0.4 0.2
6
E = 110 Pa 6
0 0
E = 410 Pa
0.1
0.2 0.3 0.4 0.5 Solid Volume Fraction s
0.6
Figure 5.21: Solid volume fraction vs height of the hopper for a static particle bed, as solution of equation (5.4), using the forward Euler method.
For the solutions presented in Figure 5.21, 0.405 is used as boundary condition at the top of the hopper geometry, then at the top of the bed, , 0.25 Pa and , 0.5 Pa for the particle pressures for the models with 1 ∙ 10 Pa and 4 ∙ 10 Pa, respectively. Theoretically, , 0 at the top of the particle bed, but since equation (5.4) is singular for , 0, a very small value has been used instead. The maximum volume fraction , is determined by the average value of the particle bed corresponding to a hopper geometry that is completely full, as given in Figure 5.21. These average values are , 0.551 and , 0.492, for the particle pressures models with 1 ∙ 10 Pa and 4 ∙ 10 Pa, respectively. The time is scaled by:
, ,
.
(5.17)
is the volumetric flow rate of Here, t is the simulation time, and , , the solid phase at the inlet. The scaling has been selected such that if all the solid particles entering the domain through the inlet remain inside the geometry, and none of them leave through the outlet, 1 at 1, and the hopper is completely filled.
102
Results numerical simulations
5.2.3 Parameter variations The influence of the conditions of the flow at the inlet of the hopper on the filling process can be investigated by a variation of the most important parameters. The parameters of interest are the particle diameter d, the solid volume fraction at the inlet , and the inlet velocity . The particle diameters d that have been used in the simulations in the present work can be categorized as fine sand and medium sand (Table 5.8).
Name
Size range (mm)
Very coarse soil
>63
Gravel Coarse soil Sand
Fine soil
Coarse gravel
20–63
Medium gravel
6.3–20
Fine gravel
2.0–6.3
Coarse sand
0.63–2.0
Medium sand
0.2–0.63
Fine sand
0.063–0.2
Silt
0.002–0.063
Clay
≤0.002
Table 5.8: Classification of grain sizes of soils, according to ISO 14688‐1:2002.
Simulations have been performed for a combination of the following parameters.
Particle diameter d: 0.1 mm, 0.2 mm, 0.3 mm, 0.5 mm. Solid volume fraction at inlet , : 0.1, 0.2, 0.3 and 0.4. Velocity at inlet : 0.5 m/s, 1 m/s, 1.5 m/s, 2 m/s.
The range of velocities is chosen such that the particles are not transported directly from inlet to outlet, but a particle bed has to be formed before the streamlines become approximate straight lines from inlet to outlet. The solid volume fraction , ranges from the nearly dilute regime with , 0.1 up to the dense particle regime with , 0.4. The tables below show the simulations with their simulation time t and the corresponding scaled time . Many simulations do not reach the chosen maximum simulation time of 200 s because the maximum particle pressure has been reached and the numerical solution diverges.
Results numerical simulations
103
Diameter d 0.2 mm , 0.1 0.2 0.3 0.4
200s; 0.68 200s; 1.36 170s; 1.74 130s; 1.78
0.3 mm
0.5 mm
34s; 0.34
18s; 0.25
Table 5.9: Overview of results for the performed simulations for various input parameters for an inlet velocity of 1 m/s. First item: total simulation time t in seconds; , with a value ∙ Pa in the model second item: total scaled simulation time for the particle pressure.
Table 5.9 shows results for the simulations for an inlet velocity 1 m/s, with a variation in the solid volume fraction , at the inlet. For this inlet velocity, solutions for larger particle diameters d diverged after short simulation times ( 1 ). For these simulations (Table 5.9, , 0.3, 0.3 mm; , 0.4, 0.5 mm) the hopper geometry is only partially filled with sand, resulting in an incomplete filling curve.
Diameter d 0.1 mm , 0.3
200s; 4.10
0.2 mm
0.3 mm
176s; 3.60
48s; 0.98
Table 5.10: Overview of results for the performed simulations for various input parameters for an inlet velocity of 2 m/s. First item: total simulation time t in seconds; , with a value ∙ Pa in the model second item: total scaled simulation time for the particle pressure.
Table 5.10 shows the results for the simulations for an inlet velocity of 2 m/s. For this inlet velocity, it is possible to obtain solutions up to particle diameters of 0.3 mm. Therefore, to investigate the influence of particle diameter d, this inlet velocity has been used.
104
Results numerical simulations
Diameter d 0.2 mm , 0.3
83s; 0.425
Table 5.11: Overview of results for the performed simulations for various input parameters for an inlet velocity of 0.5 m/s. First item: total simulation time t in seconds; second item: total scaled simulation time , with a value ∙ Pa in the model for the particle pressure.
When the inlet velocity is as low as 0.5 m/s it has not been possible to reach stable solutions for large simulation times, and the solution diverged when the hopper geometry is only half full. The cause of the divergence of the solution is the solid volume fraction inside the particle bed, which quickly obtains high values when the inlet velocity is low. When the volume fraction inside the particle bed reaches a high value, the numerical solution becomes prone to divergence (see section 5.1.4.5). Because the simulation times are not very long for particle diameters 0.3 mm and inlet velocities 1 m/s, some calculations have also been carried out in which the particle pressure, given by equation (5.9), is adjusted. The value for E has been increased from 1 ∙ 10 Pa to 4 ∙ 10 Pa. This implies that a concession is made in the prediction of the solid volume fraction in the particle bed, which will be around 0.50 instead of around values up to 0.55. The benefit is that the solution procedure is more stable and does not diverge.
Diameter d 0.2 mm (m/s) 0.5 1 1.5 2
200s; 1.03 200s; 2.05 200s; 3.07 200s; 4.10
0.5 mm 200s; 1.03
Table 5.12: Overview of results for the performed simulations for various input parameters for a volume fraction at the inlet of , . . First item: total simulation , with a value ∙ time t in seconds; second item: total scaled simulation time Pa in the model for the particle pressure.
Table 5.12 shows that for the particle pressure model, given by equation (5.9) with 4 ∙ 10 Pa, the solutions are stable and a result for an inlet velocity as low as 0.5 m/s has been obtained.
Results numerical simulations
105
Diameter d 0.2 mm , 0.2 0.3 0.4
200s; 2.73 200s; 4.09 200s; 5.47
Table 5.13: Overview of results for the performed simulations for various input parameters for an inlet velocity of 2 m/s. First item: total simulation time t seconds; second item: total scaled simulation time , with a value ∙ Pa in the model for the particle pressure.
The volume fraction at the inlet , is also varied (Table 5.13) for simulations in which the particle pressure is modelled by equation (5.9) with 4 ∙ 10 Pa. The results can be compared to the results for a particle pressure model in which 1 ∙ 10 Pa (Table 5.9).
106
Results numerical simulations
5.2.4 Flow solution The flow solution can be characterized by various types of flow occurring during the filling process. These types of flow will be highlighted in this section. The flow patterns during the predicted filling process of the simulation for particle diameter 0.2 mm, velocity at the inlet 1 m/s and volume fraction at the inlet , 0.30 are discussed first, since most of the flow phenomena observed in this numerical simulation are present in the results of all simulations. In the subsequent sections the changes in flow behaviour and filling characteristics that are due to other choices for the parameters will be discussed.
1
mscaled
0.8 0.6 0.4 0.2 0 0
0.5
1 tscaled
1.5
2
Figure 5.22: Scaled mass inside the hopper as a function of scaled time for m/s, solid volume fraction at inlet particle diameter . mm, inlet velocity . , with a value ∙ Pa in the model for the particle pressure. The , squares indicate the points in time to which reference is made in this section. The dashed line: ideal filling curve for which all the particles that enter the hopper remain inside the hopper.
The filling curve for the flow with particle diameter 0.2 mm, velocity at the inlet 1 m/s and volume fraction at the inlet , 0.30 is shown in Figure 5.22. The ideal filling curve, a linear relation between and , for which all the particles that enter the hopper through the inlet remain inside the hopper, is shown
Results numerical simulations
107
by the dashed line. At the early stage of the filling process, the filling curve follows the ideal curve. After some time ( 0.5 , the filling curves starts to deviate from the ideal filling curve because particles are transported towards the outlet. The decreases slowly, and the scaled time‐rate of increase of the scaled mass mass approaches an asymptotic value of around 0.8. For the flow beyond this asymptotic value for scaled time all particles that enter the hopper at the inlet are transported towards the outlet. Therefore there is no further increase in mass inside the hopper. In this section, the filling process of the hopper will be analysed chronologically, at the moments in time highlighted with the black squares in Figure 5.22. The differences in flow behaviour at various moments in time are considered, and the causes for deviation of the filling curve from the ideal filling curve are addressed.
Figure 5.23: Top: Solid volume fraction after 7 s, . . Streamlines for the solid phase are displayed with black color, streamlines for the fluid phase are with white color. Bottom: Magnitude of water velocity after 7 s, . . Particle diameter m/s, solid volume fraction at inlet , . , ∙ . mm, inlet velocity Pa in the model for the particle pressure.
108
Results numerical simulations
Figure 5.23 shows the early stage of the filling process. In the figure on top, at a simulation time of 7 seconds, at 0.07, the suspension enters at the inlet on the left‐hand side of the domain and the flow turns sharply downwards due to the effect of gravity on the particles and a flow starts to develop at the bottom of the domain. Note that in the flow downward near the wall, on the left‐hand side of the domain, the flow is accelerating, which is also shown in Figure 5.24. The solid and fluid phase have velocities in the same direction and the particles are not slowed down by a fluid phase moving in opposite direction, as for one‐dimensional sedimentation, analysed in section 5.1, for which the downward motion of the particles creates an upward motion of fluid between the particles.
Figure 5.24: Water velocity vectors and a contour plot of the solid volume fraction after 7 s. . , for particle diameter . mm, inlet velocity m/s, solid . , ∙ Pa in the model for the particle volume fraction at inlet , pressure. Left‐portion of the hopper.
Results numerical simulations
109
Because the hopper geometry is not a closed domain, the incoming flow through the inlet pushes the water away towards the outlet, see Figure 5.25, instead of pushing it upwards, as is the case for sedimentation in a sedimentation column. The sedimentation velocity for sand in water for a particle diameter of 0.2 mm and a solid volume fraction of 0.30 is only 3.5 mm/s. In the downward flow near the wall on the left‐hand side, the particles are accelerated to a velocity of 2.15 m/s, dragging along the water. This flow behaviour makes clear that estimates of filling times by sedimentation velocities are not very accurate, since the flow behaviour inside a geometry with an inlet and an outlet and a the flow in a closed geometry, such as a sedimentation column, is very different.
Figure 5.25: Water velocity vectors and a contour plot of the solid volume fraction after 7 s, . , for particle diameter . mm, inlet velocity m/s, solid volume fraction at inlet , . , ∙ Pa in the model for the particle pressure. Right‐portion of the hopper.
110
Results numerical simulations
The flow entering near the inlet is forced to flow near the wall on the left‐hand side of the domain by a large flow circulation of the water in the centre of the domain in counter‐clockwise direction, as shown in Figure 5.24. The flow of water from the centre of the domain towards the inlet is initiated by the downward motion of the heavy particles due to gravity. Because the sand is moving downwards, water has to take its place, which can only be achieved by a motion of water from the centre of the domain towards the inlet. The flow after 20 seconds of simulation time, at 0.20, is shown in Figure 5.26. At this point in time the filling curve, given in Figure 5.22, is still linear. The flow that has entered through the inlet is still accelerated downwards near the wall at the left‐hand side of the domain. The flow close to the bottom wall, however, is decelerating quickly, because a layer with higher solid volume fraction, in the range 0.30 ‐ 0.45, has been created further upstream. The layer corresponds to a high suspension viscosity and particle stresses are present, because the solid volume fraction near the wall exceeds the solid volume fraction ∗ for which the particle stresses are non‐zero. This layer is therefore blocking the incoming flow from the left. It forces the incoming flow to move upwards. The water drags the particles upwards, resulting in the blob‐like shape in the solid volume fraction contour plot presented in Figure 5.26. Because the layer with increased viscosity at the bottom of the domain is initially located in the bottom right corner of the domain, and grows in size towards the left hand side of the domain, the position of this blob‐like shape is moving from right to left as well.
Results numerical simulations
111
Figure 5.26: Water velocity vectors and a contour plot of the solid volume fraction after 20 s. . , for particle diameter . mm, inlet velocity m/s, solid . , ∙ Pa in the model for the particle volume fraction at inlet , pressure. Left‐portion of the hopper.
The flow on the right‐hand side of the domain, after 20s, at 0.20, is shown in Figure 5.27. Because the suspension viscosity in the layer at the bottom of the domain is substantially higher than in the water on top, the velocities in this layer are low. The upward flow from down left towards the outlet drags some particles with it, but only a negligible amount of sand actually reaches the outlet at this stage of the filling process.
112
Results numerical simulations
Figure 5.27: Water velocity vectors and a contour plot of the solid volume fraction after . , for particle diameter . mm, inlet velocity m/s, solid 20 s. volume fraction at inlet , . , ∙ Pa in the model for the particle pressure. Right‐portion of the hopper. Note that the size of the velocity vector triangles are displayed at a larger scale than the velocity vector triangles in Figure 5.26 for higher visibility.
At a simulation time of 40 s, at 0.41, shown in Figure 5.28, the thickness of the very viscous, solid layer at the bottom of the domain has increased so much that at this moment in time particles are carried along to the outlet. This causes the filling curve, given in Figure 5.22, to start to deviate from the ideal, linear filling curve. The flow that enters at the inlet is still bent downwards, but it is only accelerated up to 1.15 m/s, just around the bend downstream of the inlet, a velocity only slightly higher than the inlet velocity 1 m/s. Somewhat later, when the particles are moving near the wall on the left‐hand side of the domain in downward direction, they are decelerating, because the solid volume fraction in this part of the domain has increased compared to earlier stages in the filling process, retarding the flow due to its larger viscosity and mass.
Results numerical simulations
113
Figure 5.28: Water velocity vectors and a contour plot of the solid volume fraction after 39 s. . , for particle diameter . mm, inlet velocity m/s, solid volume fraction at inlet , . , ∙ Pa in the model for the particle pressure.
Between a simulation time of 39 s, 0.40, up to 72 s, 0.74, the flow is similar to the flow presented in Figure 5.28. The particle bed on the bottom of the domain slowly increases in height, and so does the viscous layer on top of the bed. A portion of the particles is carried towards the outlet, leading to the deviation of the filling curve from the linear filling characteristic. The development of the flow from 40 s, 0.41 onwards is represented in Figure 5.29. It shows that the particle bed extends towards the bottom left corner, increasing the local solid volume fractions and viscosities, decreasing local water velocities near the bottom of the domain. This leads to lower downward velocities just after the flow enters the domain at the inlet, shown by the velocity vectors. At 65 s, 0.66, in Figure 5.29 on the right, a small region of flow circulation develops, just below the inlet, separating the flow from the wall.
114
Results numerical simulations
50 s,
0.51
60 s,
0.61
65 s,
0.66
Figure 5.29: Water velocity vectors and a contour plot of the solid volume fraction for particle diameter . mm, inlet velocity m/s, solid volume fraction at inlet . , ∙ , at various moments , in time.
Around 72s, 0.74, given in Figure 5.30, this region of flow separation has grown tremendously within a few seconds. The flow at the inlet has suddenly changed direction; it no longer bends downwards directly when it enters the main domain, but goes straight ahead more or less horizontally.
Results numerical simulations
115
Figure 5.30: Water velocity vectors and a contour plot of the solid volume fraction after 72 s. . , for particle diameter . mm, inlet velocity m/s, solid . , ∙ Pa in the model for the particle volume fraction at inlet , pressure. Left‐hand side of the domain.
Between 72 s and 100 s the recirculation area on the left hand side of the domain, as shown in Figure 5.30, slowly decreases in size, because of the growth of the particle bed at the bottom left corner of the domain. This continues until after 100 s, 1.02, the flow in Figure 5.31 (top) is reached. Between a simulation time of 100s, 1.02 and 170 s, 1.73 (Figure 5.31), the flow patterns do not change much, while the height of the particle bed continues to increase slowly. To the right of the region at the inlet, the streamlines are approximately straight lines from this region towards the outlet.
116
Results numerical simulations
Figure 5.31: Water velocity vectors and a contour plot of the solid volume fraction after 100 s. . , (top) and 170 s. . , (top) for particle diameter . mm, inlet velocity m/s, solid volume fraction at inlet , . , ∙ Pa in the model for the particle pressure.
Between 100 s and 170 s, as time increases, the time‐rate of increase of the scaled mass inside the hopper decreases, as is shown in Figure 5.22. This is caused by the increase of bed height, narrowing the passage towards the outlet, increasing the velocities inside this passage. This is shown in Figure 5.32, which presents the water velocity vs the height of the domain at 2.5 m from the inlet, i.e. halfway the domain. The increased velocity will have a detrimental effect on the filling rate of the hopper, since the particles have less time to sediment. Figure 5.32 also shows the growth of the bed height with time, since inside the particle bed the water velocity is approximately zero. The increase of bed height decreases as function of time.
Results numerical simulations
117
1
height (m)
0.8 0.6
t = 100 s , tscaled = 1.02
0.4
t = 120 s , tscaled = 1.22
0.2
t = 140 s , tscaled = 1.43
0 0
t = 160 s , tscaled = 1.63
0.1 0.2 0.3 0.4 0.5 0.6 Velocity fluid phase in horizontal direction (m/s)
0.7
Figure 5.32: Water velocity vs height in the midsection of the hopper at various simulation times for the flow solution with particle diameter . mm, inlet velocity m/s, solid volume fraction at inlet , . , ∙ Pa in the model for the particle pressure.
At 172.2 s, the solid volume fraction in the bottom right corner equals 0.59 and the solution diverges. As explained in section 5.1, for the model for the particle pressure used in present method, the numerical solution can diverge easily when the solid volume fraction becomes this high. The simulation of the filling process of a hopper geometry shows that the flow patterns largely depend on regions of flow circulation and the distribution of the solid volume fraction inside the domain. The flow is directed around regions with large solid volume fraction (Figure 5.26), because in these regions, flow velocities are generally low. The main cause of the change of flow patterns is the growth of the particle bed (Figure 5.29 and Figure 5.30). It can cause a reduction in velocities in regions of flow circulations, or can cause these regions to become smaller (Figure 5.30 and Figure 5.31). A direct quantitative comparison of the measurements by Van Rhee (2002) and the current simulations is unfortunately not (yet) possible. The geometry of the hopper is different: the geometry of the current model has been selected to be much smaller
118
Results numerical simulations
than the test hopper, for reasons of computational times. Van Rhee (2002)used a geometry with a length, height and width of 12 m, 2.25 m and 3.08 m, respectively. In current calculations, a two‐dimensional geometry with a length and height of 5 m and 1 m has been used. The initial state of the hopper, partly filled with water and sand, is also different, as this state in the experiments is hard to reproduce. In the experiments a range of particle sizes were present, while in the current flow simulations only a single particle size has been considered. Therefore, only a qualitative comparison is feasible here between the experimental results of van Rhee (2002) and the current simulations. A schematic overview of the flow in a hopper is given by van Rhee (2002) is reproduced in Figure 5.33.
Figure 5.33: Schematic overview of flow in a hopper, with (1): inlet region, (2) particle bed, (3) suspension layer, (4) current towards the overflow, (5) remaining area. Figure taken from Van Rhee (2002), c gives an estimation of the solid volume fraction as a function of the height of the hopper geometry and u gives an indication of the .velocity as a function of the height of the height of the hopper geometry.
Comparison of Figure 5.33 and the flow solution in Figure 5.28 show that the simulation in present work is in accordance with this schematic overview, although a clear distinction between region 4 and 5 is difficult to point out. According to van Rhee (2002) the filling process of the hopper consists of three stages:
The first stage in which all sand stays inside the hopper geometry The second stage in which overflow losses start to occur, referred to as the overflow phase
Results numerical simulations
119
The third stage in which a ‘river‐like’ flow above the sand bed develops from the inlet towards the overflow, referred to as the final phase
In the present results, these three stages are also present. The first stage ranges from 0 up to 0.40 . The flow solution for 0.40 is shown in Figure 5.28. The second stage, referred to by van Rhee (2002) as the overflow phase can be regarded as a transitional phase between the first phase and third phase. The streamlines of the flow are altered in this stage, by the process described in Figure 5.29. Figure 5.30 shows the final phase, referred to by van Rhee (2002) as the river‐ like flow. Note that in the experiments by Van Rhee (2002), at the start of the filling process the hopper geometry was already partially filled with sand. In that case, it is expected that the transition, described in Figure 5.29, towards a flow which no longer bends downwards after entering the domain, occurs at an earlier moment in time, since the presence of the sand bed will slow down the flow. The measurements by Van Rhee (2002) show that the concentration of the solid phase in the overflow increases gradually in time. In the present work, the concentration of sand in the overflow is related to the slope of the filling curve in Figure 5.22. When the slope of the filling curve equals the slope of the ideal filling curve, the concentration of sand in the overflow is zero. When the slope of the filling curve is zero, the concentration of sand in the overflow equals the concentration of sand at the inlet. Comparison between the filling curve from the present results and the measured overflow concentration show that the phenomenology of the filling process in both situations is similar. Measured concentration profiles by Van Rhee (2002) can be compared with the result from the current simulation for a solid volume fraction at the inlet , 0.26. For this purpose the present numerical result is compared to the results by Van Rhee (2002) for a solid volume fraction at the inlet of , 0.26.
120
Results numerical simulations
height (m)
1
tscaled=0.19
0.8
tscaled=0.35
0.6
tscaled=0.66
tscaled=0.50 tscaled=0.82
0.4 0.2 0 0
0.1
0.2
0.3
s
0.4
0.5
0.6
Figure 5.34: Solid volume fraction vs height of the hopper geometry, halfway the domain at various simulation times for the flow solution with particle diameter . mm, inlet velocity m/s, solid volume fraction at inlet , . , ∙ Pa in the model for the particle pressure, compared with the experimental results of Van Rhee (2002), for a particle diameter range of . . mm, flow rate at inlet . m3/s, inlet velocity . m/s, solid volume fraction at inlet , . .
Figure 5.34 compares the flow solution for with particle diameter 0.2 mm, inlet velocity 1 m/s, solid volume fraction at inlet , 0.30 with the experimental measurements by Van Rhee (2002). Although the flow conditions for these two situations are quite different, differences and similarities can be assessed. Important differences are the different dimensions of the geometry, the smaller flow rate and flow velocity at the inlet and the differences in particle sizes. The ideal filling time, for which 1 at time 1, correspond to an unscaled time of 1270 s and 98 s, for the experiments and for the present numerical results, respectively. The velocity at the inlet u 0.045 m/s used in the experiments is much smaller than the inlet u 1 m/s, used in the present numerical simulation. However, reported measured horizontal velocities in the experiments, measured in the layer above the particle bed in which the particles are still suspended, measured at a horizontal position of ¼ of the width of the hopper,
Results numerical simulations
121
are in the order of 0 ‐ 0.25 m/s. For the result of the current simulation, the horizontal velocities present in the layer above the particle bed in which the particles are still suspended are in the order of 0 – 0.2 m/s. The reason that the velocities near the particle bed in the experiments have the same order of magnitude as the velocities in present numerical simulation is that the height of the geometry in the experimental setup is much larger (2.25 m) than the height of the geometry used for the numerical simulation (1 m). Because of the larger height of the geometry in the experimental setup, the increase in velocity of the particles just after the inlet, due to gravitational acceleration, will be much higher. It shows that the horizontal velocities inside the suspension close to the particle bed are mainly determined by the height of the hopper. The larger velocities present in the flow in the experiment also causes the suspended layer to have a larger height (Figure 5.34). The streamlines of the flow are always directed from the bottom‐left corner of the hopper geometry towards the upper right corner of the geometry. When the velocity at the bottom‐left corner, due to the gravitational acceleration is large, as is the case for the experiments, the particles can be carried towards a larger height and the layer above the particle bed in which suspended particles are present is large. The large suspended layer is more pronounced at earlier moments in time, 0.19 and 0.35 , because the experiments start with a hopper that is not completely filled with water, but is approximately half full. This initial setup results in larger flow velocities, since the incoming suspension falls through air, resulting in larger flow velocities. The larger layer of suspended particles is also caused by the usage of a range of particle diameters. Smaller particles are carried upwards more easily. This effect also results in a slope in the solid volume fraction as a function of the height of the domain, shown in Figure 5.34. For the experimental results, the measured solid volume fraction inside the flow at locations above the particle bed is measured to increase with time, from 0.22 at 0.35 to 0.32 at 0.82. For the numerical simulation, this increase in solid volume fraction with time is only present in the first phase of the filling process, between , 0.19 and 0.35 . Later in the filling process, the solid volume fraction predicted in the region above the particle bed, is approximately constant, equal to the solid volume fraction , 0.30. Similar results are obtained in an experiment by Van Rhee (2002) at a lower inlet volume rate, shown in Figure 5.35.
122
Results numerical simulations
Figure 5.35: Solid volume fraction vs height of the hopper geometry, halfway the domain at various simulation times, with s, . for the experimental results of Van Rhee (2002), with a particle diameter range of mm, flow rate at inlet . m3/s, inlet velocity . m/s, solid volume fraction at inlet . . Figure taken from Van Rhee (2002). ,
The experiment for which the results are shown in Figure 5.35, has different inlet conditions ( 0.1 m3/s, , 0.20), than the experiment for which the results are shown in Figure 5.34 ( 0.137 m3/s, , 0.26). Similarly to the results presented in Figure 5.34, at the start of the filling process, the suspension is present over the whole height of the domain, due to the presence of high velocities in the first part of the experiment. However, for this experiment, the top line in Figure 5.35, corresponding to the situation with a large particle bed, corresponds to a scaled time of 0.90. It means that for this experiment, almost no deviation occurs from the ideal filling curve, for which 1 at time 1. At a later stage in the filling process the solid volume fraction in the flow above the bed exceeds the solid volume fraction at the inlet, , 0.19, over the whole region above the bed. For the experiment for which the results are shown in Figure 5.35, this happens after 0.40. This is in contrast with the results of the numerical simulations for which a layer with a very small solid volume fraction at the top of the domain is always present. It is not clear why the solid volume fraction of the suspension increases in this part of the filling process, during its way from inlet towards the outlet.
Results numerical simulations
123
The reported solid volume fraction at the outlet is much lower for the experiment with 0.1 m3/s, , 0.20, (on average , 0.05) than for the experiment 0.137 m3/s, , 0.26 (on average , 0.11). It shows that there is with a large dependence between overflow losses and the number of particles entering the domain per unit time. Comparison between the numerical simulations and the experiments has shown that although the filling time of the hopper geometry in the experimental setup is much larger, the observed flow does show resemblance to the numerical simulation because of the larger height of the geometry, resulting in a larger increase in velocities of the particles after entering the hopper geometry.
124
Results numerical simulations
5.2.5 Parameter variations In the preceding section the flow phenomena of the filling process of the hopper have been highlighted. In this section the influence of the flow parameters on the filling curves of the hopper are analysed. The parameters that are varied in a systematic way are the particle diameter d, the solid volume fraction at the inlet , and the inlet velocity .
5.2.5.1 Variation of the particle diameter The results for the flow can be analysed for suspensions with various particle diameters d. The particle diameters considered here are 0.1 mm, 0.2 mm and 0.3 mm. The flow phenomena for different particle diameters will be addressed. 1
mscaled
0.8 0.6 0.4 d = 0.1 mm d = 0.2 mm d = 0.3 mm
0.2 0 0
1
2
tscaled
3
4
5
Figure 5.36: Scaled mass inside the geometry as a function of scaled time / , solid volume fraction at inlet for various particle diameter d. Inlet velocity . , ∙ Pa in the model for the particle pressure. The linear dashed line: , ideal filling curve for which all the particles that enter the hopper remain inside the hopper.
Results numerical simulations
125
Figure 5.36 shows the filling curves for various particle diameters d. The filling curves are characterized by three parts. For the first part, for small scaled times , the filling curve is linear and follows the ideal filling curve. In this part of the filling process, the rate of increase of scaled mass is high. After some time, particles are transported towards the outlet, causing the filling curve to deviate from the ideal line. For smaller particle diameters d, this deviation from the ideal filling curve starts at an earlier moment in time. The flow carries smaller particles more easily towards the outlet, resulting in a larger particle spillage. The last part of the filling process is characterized by a low time‐rate of increase of the scaled mass : the scaled mass is approaching an asymptotic value. When the particle diameter d is small, the slope of the filling curve in this part of the filling process is also small. This section highlights the causes of these trends. .
. s,
s,
.
Figure 5.37: Vector plot of the water velocity and contour plot of the solid volume fraction for . mm, m/s, , . , ∙ Pa in the model for the particle pressure. at the early stage of the filling process.
126
Results numerical simulations
Figure 5.37 shows the early stage of the filling process for the flow solution for particle diameter 0.1 mm. The figure at the top shows the characteristic flow pattern in the early stage of the filling process, during which a counter‐clockwise recirculation zone close to the inlet forces the flow from the inlet to flow near the wall on the left‐hand side of the domain. The bottom figure in Figure 5.37 shows the flow when it is deviating from the linear filling curve, characterized by a region of circulation at the left hand side of the domain. The change in flow behaviour from the flow pattern in the top figure to the flow pattern in the bottom figure is again initiated by the growth of the particle bed and viscous layer near the bottom left corner, decreasing the velocities in this region, causing the flow at the inlet to go more or less straight ahead instead of bending downwards. The region of flow circulation present in the left‐hand side of the bottom figure of Figure 5.37 grows in time, until the point in time that the width of the recirculation region equals the width of the domain, as shown in the top figure in Figure 5.38. This is also the moment in time that the increase of scaled mass becomes constant. Afterwards, most particles are directly transported from the inlet towards the outlet by straight streamlines from inlet to outlet, leading to a very low increase of mass in time (Figure 5.38; bottom).
Results numerical simulations
127
. s,
200 s,
.
.
Figure 5.38: Vector plot of the water velocity and contour plot of the solid volume fraction at the last stage of the filling process for . mm, m/s, , . , ∙ Pa in the model for the particle pressure.
The changes in flow patterns for the simulation with particle diameter 0.2 mm, shown in Figure 5.39 show that the changes in flow patterns occur at equal points in scaled time for diameter 0.1 mm and for diameter 0.2 mm. The top and bottom figure of Figure 5.39 are similar to the top figure of Figure 5.37 and the top figure of Figure 5.38, respectively, with the difference that throughout the process more sand remains inside the hopper, resulting in a higher particle bed. In the bottom figure of Figure 5.39, at the point in time for which the streamlines are about to form straight lines from inlet to outlet, a substantial particle bed has been created, whereas at the same moment in scaled time and same flow pattern, for a diameter of 0.1 mm (Figure 5.38), only a very small layer of particles on the bottom of the domain is present, because up to this point in scaled time, for the flow with a particle diameter of 0.1 mm, many particles have been transported towards the outlet already.
128
Results numerical simulations
19.5 s,
.
47.6 s,
.
Figure 5.39: Vector plot of the water velocity and contour plot of the solid volume fraction for . mm, m/s, , . , ∙ Pa in the model for the particle pressure.
Similar results are obtained for particle diameter 0.3 mm (Figure 5.40). The flow patterns are similar to the simulations with smaller diameters, but the number of particles that remain inside the hopper throughout the filling process is larger. At the moment when the streamlines are about to form straight lines from inlet to outlet (Figure 5.40; bottom), the geometry is already filled for more than two thirds of its maximum obtainable value.
Results numerical simulations
129
19.5 s,
.
47.6 s,
.
Figure 5.40: Vector plot of the water velocity and contour plot of the solid volume fraction for . mm, m/s, , . , ∙ Pa in the model for the particle pressure.
The variation of the particle diameter d shows that the flow patterns are not influenced by the particle diameter d and that transitions from one flow pattern to another take place at approximately the same moments in time , only the number of particles that are carried to the outlet is larger for particles with smaller diameter d, hence the longer filling times.
130
Results numerical simulations
5.2.5.2 Variation of solid volume fraction at inlet The solid volume fraction at the inlet , can be varied to assess its effect on the filling curves of the hopper. Figure 5.41 shows the filling curves for various solid volume fraction , . Note that the total simulation times for all of these simulations are about 200 s, but because of the scaling, the simulations for small , terminate at small .
1
mscaled
0.8 0.6 0.4
s,in = 0.1 s,in = 0.2
0.2 0 0
s,in = 0.3 s,in = 0.4 0.5
1 tscaled
1.5
2
Figure 5.41: Scaled mass inside the hopper as a function of scaled time for various solid volume fractions , . Particle diameter . mm. Velocity at inlet m/s, ∙ Pa in the model for the particle pressure. The linear dashed line: ideal filling curve for which all the particles that enter the hopper remain inside the hopper.
The filling curves are again characterized by three stages; a linear stage at the start for which the filling curve follows the ideal filling curve; a second stage for which the curve deviates from the ideal filling curve; a third stage characterized by a low time‐rate of increase of , for which the curve slowly approaches its asymptotic value. The filling curves show that for larger solid volume fractions , at the inlet, the first stage of the filling process is extended. In the last stage of the filling process, the time‐rate of increase of is smaller for large solid volume fractions , .
Results numerical simulations
131
This section discusses the causes of these trends of the filling curves. Note that the simulation behaviour for , 0.30 has already been discussed in section 5.2.4. s,
.
s,
.
s,
.
Figure 5.42: Vector plot of the water velocity and contour plot of the solid volume fraction at various moments in time for . mm, m/s, , . , ∙ Pa in the model for the particle pressure.
Figure 5.42 shows the flow for a solid volume fraction , 0.10. The top figure shows the flow pattern for which the flow that enters through the inlet bends downwards. A particle bed is created at the bottom with a layer with high viscosity with 140 s, , on top. This flow pattern continues to exist until 0.49, in the middle figure. Here the flow detaches from the wall on the left‐hand side
132
Results numerical simulations
of the domain. The new flow pattern does not change until the end of the simulation in the bottom figure. s,
s,
s,
.
.
.
Figure 5.43: Vector plot of the water velocity and contour plot of the solid volume fraction at various moments in time, for . mm, m/s, , . , ∙ Pa in the model for the particle pressure.
Figure 5.42 and Figure 5.43 show the effect of the solid volume fraction at the inlet . At this , on the flow behaviour. The top figures show the flow for equal point in time an equal amount of solid mass has entered the hopper. The flow cases are qualitatively similar. For both flows the flow that enters through the inlet bends downwards and on the bottom right‐hand side of the domain a particle bed is
Results numerical simulations
133
created with a layer with high viscosity with a solid volume fraction of , on top. When the solid volume fraction , is high, the acceleration of the flow near the left‐hand side wall due to gravity is higher, leading to much higher flow velocities in the bottom left corner of the domain. This is the reason that for lower volume fractions , the particle bed is wider, stretching out over a larger area of the bottom wall. Analogously, the flow for , 0.1 detaches from the wall at an earlier point in time than for , 0.2, which is shown in the middle figures of Figure 5.42 and Figure 5.43. Because flow velocities in the bottom corner are low for low , , the flow towards the outlet lacks the momentum that is needed to carry the particles, creating a much smaller viscous layer, even though for lower solid volume fractions the drag coefficient of the particles is small. Another minor effect that causes the higher velocities in the viscous layer for higher solid volume fraction at the inlet , is that more water has to move to the outlet because the particles require more space. This water moves from the particle bed towards the outlet through the viscous layer, increasing the local velocities. These effects become even more pronounced for an inlet solid volume fraction of , 0.4, as shown in Figure 5.44. The increase in momentum due to gravity creates a large region of flow circulation with much higher velocities than in the flow fields for , 0.1 and 0.2 , shown in Figure 5.42 and Figure 5.43, respectively. Because of this , strong flow circulation, the flow detaches from the wall at higher scaled time . The detachment of the flow from the wall near the inlet on the left‐hand side of the domain results in flow streamlines that are much more straight, resulting in a larger number of particles that is taken towards the outlet. This is shown in the filling curves in Figure 5.41. After the moments in time 0.49, 0.60, 0.74, 0.76 for the flows for , 0.1, 0.2, 0.3, 0.4, respectively, the filling curves quickly become approximate straight lines with constant filling rates. It is only in this stage of the filling process that a lower solid volume fraction at the inlet , leads to a higher rate of increase of the scaled as a function of scaled time , due to a higher particle drag coefficient when the solid volume fraction is high.
134
Results numerical simulations
. s,
.
s,
.
Figure 5.44: Vector plot of the water velocity and contour plot of the solid volume fraction at various moments in time for . mm, m/s, , . , ∙ Pa in the model for the particle pressure.
Results numerical simulations
135
5.2.5.3 Variation of the inlet velocity When the particle pressure is provided by the model by Chauchat et al. (2013) with 1 ∙ 10 Pa, it is not possible to obtain a solution for inlet velocities smaller than 1 m/s, because the solution diverges after short simulation times. Therefore, simulations have been carried for 4 ∙ 10 Pa instead of 1 ∙ 10 Pa. The filling curves of these simulations are given in Figure 5.45.
1
mscaled
0.8 0.6 0.4
uinlet = 0.5 m/s uinlet = 1 m/s
0.2 0 0
uinlet = 1.5 m/s uinlet = 2 m/s
1
2
tscaled
3
4
5
Figure 5.45: Scaled mass inside the hopper vs scaled time time for various inlet velocities , , with . mm and , . , in which the particle pressure is ∗ obtained by , with ∙ Pa, , ∗ . . The linear dashed line: ideal filling curve for which all the particles that enter the hopper remain inside the hopper.
The observed trend for various values of the inlet velocity is as expected. A larger inlet velocity leads to a larger spillage, because an increased number of particles are carried towards the outlet. Note that for 4 ∙ 10 Pa the maximum solid volume fraction , , which is used to determine the filling curve is lower (see Figure 5.21). The only flow solution that shows differences with the flow solutions discussed in preceding sections is the solution for 0.5 m/s. It is shown in Figure 5.46. The filling curve for an inlet velocity of 0.5 m/s is linear. The flow
136
Results numerical simulations
pattern remains the same throughout the simulation. In the early stage of the filling process, the velocities are much lower than for other cases, leading to a particle bed at rest at the right‐hand side of the domain, with no viscous layer on top. . s,
. s,
.
.
Figure 5.46: Vector plot of the water velocity and contour plot of the solid volume fraction at various moments in time, for . mm, . m/s, , . , ∙ Pa in the model for the particle pressure.
Results numerical simulations
137
5.2.6 Flow modelling In this section the sub‐models that have been used to obtain a flow solution are discussed. The flow near the wall is addressed, as well as the formation of the particle bed with the corresponding particle stresses.
5.2.6.1 Flow near the wall The velocity of the (turbulent) flow near the wall is determined by wall functions, as described in section 2.2.4.2. The effect of these wall functions on the flow solution can be analysed. The flow solution for 0.2 mm, 1 m/s, , 0.30, after 150 s is considered. The flow variables are investigated along a vertical line halfway the width of the domain, at 2.5 m.
Figure 5.47: Flow solution for . mm, m/s, , . . Flow solution after . , ∙ Pa in the model for the particle pressure. The vertical 150 s, line halfway the domain indicates the location from which the data for the graphs in Figure 5.48, Figure 5.49 and Figure 5.50 are taken.
Although a particle bed has formed at the bottom of the domain and the velocity tends to go to zero inside the particle bed (see Figure 5.48), close to the wall a non‐ zero velocity is present, with a magnitude of 1 ∙ 10 m/s. This velocity of the fluid phase is caused by the wall treatment. In all simulations, the grid is created in such a way the values for (equation (2.62)), lie in the range of 30 – 150 when the flow is still suspended and the particle bed has yet to be formed. When the particle bed has formed, the value of decreases dramatically, caused by the increase of the fluid viscosity , which is used to calculate the value of . Theoretically, for values of 11.06 the wall stresses have to be predicted by . However, in the
138
Results numerical simulations
current numerical implementation, for small values of the ‘scalable’ wall treatment of CFX is used, for which the relation ∗ is used, in which ∗ , given by equation (2.64) is dependent on the turbulent kinetic energy k, , with ∗ max 11.06, ∗ . Since the values for ∗ are very small, ∗ 11.06 is used when a particle bed is present, hence an overestimated and a spurious velocity is created. 1
height (m)
0.8 0.6 0.4 0.2 0 0
0.1 0.2 0.3 0.4 0.5 Velocity in horizontal direction (m/s)
0.6
Figure 5.48: Velocity of the fluid phase along a vertical line at x= 2.5 m after 150 s, . , for . mm, m/s, , . , ∙ Pa in the model for the particle pressure.
1
height (m)
0.8 0.6 0.4 0.2 0 0
0.1
0.2 0.3 0.4 0.5 Solid volume fraction s
0.6
0.7
Figure 5.49: Solid volume fraction of the solid phase along a vertical line at x= 2.5 m after 150 s, . for . mm, m/s, , . , ∙ Pa in the model for the particle pressure.
Results numerical simulations
139
The graph in Figure 5.49, of the solid volume faction vs the height of the domain shows that close to the bottom wall, at the grid point at the wall and the grid point adjacent to the wall, in the first layer normal to the wall, a spurious change in solid volume fraction exists. A sudden increase in the solid volume fraction is present in the grid point at the wall, and a small decrease in solid volume fraction is present in the grid point adjacent to the wall. This change in solid volume fraction has its effect on the distribution of the solid pressure profile.
1
Solid Pressure PP Solid shear stress s,p
height (m)
0.8
s,p = s PP s,p = PP
0.6 0.4 0.2 0 0
1000
2000 3000 Pressure (Pa)
4000
5000
Figure 5.50: Solid pressure and solid shear stresses of the solid phase along a vertical line at x= 2.5 m after 150 s for . mm, m/s, , . , . , ∙ Pa in the model for the particle pressure.
The reason that this sudden change exists, is because the spurious velocity, created by the wall functions, results in a large shear stress in the solid phase. Since the inter‐ particulate shear stress τ , is related to the solid pressure, the solid pressure is increased as well. The shear stress in the solid phase increases with particle pressure. Because the shear rate inside the particle bed is very low, it should be given by τ , η P where η is the static friction coefficient given by η tan 20° , see equation (2.18), paragraph 2.2.2.2. Because of the high shear rate at the bottom of the domain the particle stresses are overestimated in the first cell, resulting in a predicted particle stress lying between the lines τ , η P and τ, η P , where η is the friction coefficient for very large shear rates.
140
Results numerical simulations
Figure 5.51: Contour plot of the pressure and particle pressure for m/s, , . . Flow solution after 150 s, . , ∙ for the particle pressure.
. mm, Pa in the model
Figure 5.51 shows the contour plots for the pressure p and the particle pressure for the flow simulation after 150 s, 1.54 with 0.2 mm, 1 m/s, 0.30. The contour plot of the solid volume fraction for this solution at the , same moment in time is given in Figure 5.47. The magnitude of the particle pressure at the interface between bed and the fluid on top is determined by the shear stress τ, P and at the bottom by the shear stress resulting from the wall treatment. Due to the incorrectness of the prediction of the shear stress at the wall, the particle pressure in the bed cannot adjust to the solution in which it is in balance with the net particle weight. A small downward velocity of the particles are still present, see Figure 5.52. However, the model is able to predict the particle shear stresses at the surface of the particle bed, applied by the surrounding flow.
Results numerical simulations
141
1
height (m)
0.8 0.6 0.4 0.2 0 ‐0.02
‐0.015 ‐0.01 ‐0.005 0 Velocity sand in vertical direction (m/s) Figure 5.52: Sand velocity in vertical direction along a vertical line at x= 2.5 m after 150 s, . for . mm, m/s, , . , ∙ Pa in the model for the particle pressure.
It has been attempted to avoid the problems with wall functions by applying a free slip condition at the wall for the fluid phase, and a no slip condition for the solid phase, since the turbulent flow quantities are solved for the fluid phase and converted to the solid phase afterwards. Figure 5.53 shows that when a free slip condition is applied at the bottom wall, a larger number of particles is taken to the outlet than when a no‐slip condition is applied. The reason for this is the boundary condition at the bottom wall. For the case of a free‐slip boundary condition, a zero‐ gradient condition is applied for the turbulent kinetic energy and the turbulent dissipation . With a wall function, the boundary condition is a fixed value of close to zero.
142
Results numerical simulations
Figure 5.53: At the top: Flow solution for a no‐slip condition at the bottom wall. Bottom: Flow solution for a free‐slip condition for the fluid phase at the bottom wall. 50 s, . , . mm, m/s, , . , ∙ Pa in the model for the particle pressure.
The application of a zero‐gradient boundary condition for the turbulent quantities at the bottom wall results in a solution in which the eddy viscosity, and thus the shear rate component du/dh has to be increased inside the particle bed (Figure 5.55), in comparison to the flow solution for which a no‐slip condition has been applied at the bottom wall. This results in a particle bed that is always in motion, the velocity profile needs to have a certain slope, and this slope can never become zero (Figure 5.54).
Results numerical simulations
143
1
height (m)
0.8 0.6 0.4 0.2 0 0
No slip Free slip 0.05 0.1 0.15 Velocity fluid phase in horizontal direction (m/s)
0.2
Figure 5.54: Velocity of the fluid phase along a vertical line at x= 2.5 m after 50 s for a no‐ slip condition and a free‐slip condition for the fluid phase at the bottom wall , . , . mm, m/s, , . , ∙ Pa in the model for the particle pressure.
1
height (m)
0.8 0.6 0.4 0.2 0 0
No slip Free slip 10
20 30 40 50 Eddy viscosity f,T (Pa s) Figure 5.55: Eddy viscosity along a vertical line at x= 2.5 m after 50 s, . , m/s, , . , ∙ Pa in the model for the particle pressure. . mm,
144
Results numerical simulations
When a free‐slip boundary condition for the fluid phase is applied at the walls, the filling curve shows a larger deviation from the ideal filling curve than when a no‐slip boundary condition is applied. This is shown in Figure 5.56.This is caused by the predicted velocities inside the particle bed. 0.8
0.7 0.6 mscaled
0.5 0.4 0.3 0.2 No‐slip boundary condition Free‐slip boundary condition
0.1 0 0
0.2
0.4
0.6 0.8 1 1.2 tscaled Figure 5.56: Scaled mass inside the hopper as a function of scaled time for a no‐slip condition and a free‐slip condition at the walls. Particle diameter . mm, inlet velocity m/s, solid volume fraction at inlet , . , with a value ∙ Pa in the model for the particle pressure. The dashed line: ideal filling curve for which all the particles that enter the hopper remain inside the hopper.
This shows that a free‐slip boundary condition is not suitable for this type of simulations, since it employs a zero‐gradient for the turbulent quantities, artificially imposing a high shear rate at the wall, which in its turn prevents a particle bed from being formed.
Results numerical simulations
145
5.2.6.2 Particle shear stresses The need of the model for the particle shear stress τ , P (see section 2.2.2) can be shown by the comparison of results from a calculation in which these stresses are present and a calculation in which these shear stresses are set to zero, by taking 0. The flow solution for both situations is shown in Figure 5.57
Figure 5.57: Top: flow solution with particle stresses present. Bottom: flow solution obtained without particle shear stresses, after 40 s, . , . mm, m/s, , . , ∙ Pa in the model for the particle pressure. The vertical line halfway the domain indicates the location from which the data for the graphs in Figure 5.58 and Figure 5.59 are taken.
When the particle stresses are omitted the particles cannot come to rest because the flow is always in motion. This is because inside the particle bed there is no (large) interparticle stresses , present (Figure 5.59), which is needed to keep the particle bed in place. Also, the influence of the wall treatment on the velocity is larger, see Figure 5.58, because of the lower viscosity of the flow close to the wall. Hence, a large velocity will be predicted near the wall. Hence, the model for particle pressure in the form of τ , P is needed to model the flow correctly, resulting in a bed in which the velocities are approximately zero. Such a model cannot be omitted.
146
Results numerical simulations
1
height (m)
0.8 0.6 0.4
With particle shear stresses Without particle shear stresses
0.2 0 ‐0.2
‐0.1 0 0.1 0.2 Velocity solid phase in horizontal direction (m/s)
Figure 5.58: Velocity of the fluid phase along a vertical line at x= 2.5 m after 40 s, . for . mm, m/s, , . , ∙ Pa in the model for the particle pressure. 1
With particle shear stresses Without particle shear stresses
height (m)
0.8 0.6 0.4 0.2 0 0
200 400 600 800 Interparticulate shear stress (Pa) s,p
1000
Figure 5.59: Interparticulate shear stress , along a vertical line at x= 2.5 m after 40 s, . , for . mm, m/s, , . , ∙ Pa in the model for the particle pressure.
Results numerical simulations
147
5.2.7 Concluding remarks The simulations on a hopper geometry show that the method is able to predict the filling curve i.e. the mass of sand as a function of time, of the hopper. The prediction of the filling process of a hopper geometry shows that the flow patterns largely depend on regions of flow circulation and the distribution of the solid volume fraction inside the domain. The flow is directed around regions with large solid volume fraction, because in these regions flow velocities are generally low, due to the high suspension viscosity and high particle stresses that are present in regions with high solid volume fractions. It shows that accurate models for viscosity and inter‐particulate stresses are important in order to predict the correct flow behaviour. The filling process is characterized by three stages. During the first stage the filling curve is linear and follows the ideal filling curve. In this part of the filling process, the time‐rate of increase of scaled mass is high. The second stage consists of a deviation from the ideal filling curve since particles are transported towards the outlet. In this stage the flow behaviour changes slowly, and the flow streamlines will gradually change into approximately straight lines from inlet towards outlet. After the formation of the flow pattern of approximately straight streamlines from inlet towards outlet, the flow patterns do not change anymore. This is the last stage of the filling process and it is characterized by a low time‐rate of increase of mass inside the hopper, for which the scaled mass is approaching an asymptotic value. The filling curves of the hopper geometry are influenced by the conditions at the inlet of the hopper: velocity at the inlet , solid volume fraction at the inlet , and particle diameter d. Variation of the particle diameter d shows that the flow patterns are not influenced by the particle diameter d and that transitions from one flow pattern to another take place at approximately the same moments in scaled time, only the number of particles that is carried to the outlet is larger for smaller diameter d, throughout the filling process, with a very small time‐rate of increase of mass in the last stage for flows with small particle diameters. Variation of the solid volume fraction at inlet , shows that for large solid volume fractions the first stage of the filling process, for which the rate of increase of mass inside the hopper is high, is extended. The changes in flow patterns occur at larger scaled times when the solid volume fraction is high. In the last stage of the filling process for a lower solid volume fraction at the inlet , leads to a higher time‐rate of increase of the scaled as a function of scaled time . In
148
Results numerical simulations
general, the scaled mass inside the hopper is larger for a given time when the solid volume fraction at the inlet , is high.
The observed trend for various values of the inlet velocity is as expected. A larger inlet velocity leads to a larger spillage, because an increased number of particles are carried towards the outlet. The model is able to predict the formation of a bed, including particle pressure and particle stresses. However, when the derivative of the particle pressure with respect to the solid volume fraction becomes too high, it is needed to switch to an alternative formulation of the particle pressure because of divergence of the numerical solution procedure. The particle pressure needs to be adjusted so that the predicted values for the solid volume fraction present inside particle bed is lower. The flow solution near the wall is correct when the particles are still suspended, but with the current wall functions spurious variations in stresses in the grid points close to the wall can be predicted when a particle bed is formed. This cannot be corrected by applying free–slip conditions at the wall. A particle pressure in the form of τ , P is needed to model the flow correctly. With such a model it is possible to predict the formation of a bed of particles. The phenomenology of the flow behaviour is similar to the experiments by Van Rhee (2002). The flow behaviour inside the geometry as well as the changes of flow in time have the same characteristics. Quantitative comparisons are difficult to make because of the differences in volume flow rate and because in the experiments by Van Rhee (2002) the hopper geometry has been partially filled with sand at the start of the filling process. Contrary to the model by van Rhee (2002) that has been specifically developed to describe hopper sedimentation, the current model is more general and can be used to describe other high‐density (dredging) flows (such as in centrifugal pumps). In comparison to the mixture‐based model by van Rhee (2002), the current model has been developed with the aim to describe relevant physical phenomena in more detail. Therefore, the two phases, solid and water, are treated as separate continua with separate mass and momentum equations, from which solid and water velocities and stresses are determined in a coupled manner. This is essential in order to describe bed formation, including solid pressure and solid shear stresses, in a physically meaningful manner. The current model involves both static and dynamic interparticle stresses. Required closure relations (such as for the momentum transfer between the phases and for the dynamic interparticle stresses)
Results numerical simulations
149
are based on recent developments reported in the scientific literature. Near the bed the solid concentration is high, and hence the suspension viscosity is (very) high as well. This effect is incorporated in the current model. The model by van Rhee (2002) can account for the difference in behaviour of various particle sizes. With the current model, this is not (yet) possible.
150
Results numerical simulations
6 CONCLUDING REMARKS AND RECOMMENDATIONS In this thesis a numerical simulation method based on a two‐fluid model for dense‐ phase dredging flows has been developed, with the aim of analysing the flow inside dredging equipment, such as the flow inside a hopper, and predicting the performance characteristics. In this chapter conclusions as well as recommendations for future work are given.
6.1 Conclusions A numerical simulation method has been obtained, based on a derivation of the governing equations for two‐phase flow, the application of constitutive equations and the implementation of a numerical method for numerically solving these equations, through user defined functions in the commercial CFD package Ansys
Concluding remarks and recommendations
151
CFX 14.0. As test cases, the numerical method has been used to simulate sedimentation, as well as flow inside a hopper. Based on the research of this thesis, the following conclusions have been formulated.
6.1.1 Governing equations The two‐fluid model, based on the conservation of mass and momentum for each of the two phases separately, is used in this work and has shown to be a useful model for dense‐phase dredging flows. This model is able to describe the flow when the particles are suspended, as well as when an almost stationary particle bed is formed.
6.1.2 Constitutive equations In order to close the system of equations, as given by the governing conservation equations, constitutive equations are needed, which describe the behaviour of the two‐phase fluid. Constitutive models, relating the material behaviour of the mixture of sand and water inside the flow to flow variables, have been implemented in the two‐fluid model. The parameters that need to be described by constitutive equations are: the (dynamic) viscosity of the fluid and solid phase, the momentum transfer between the two phases, the inter‐particulate stresses and a turbulence model. The present work focussed on the (dynamic) viscosity of the fluid phase and that of the solid phase and the inter‐particulate stresses. The constitutive equations for turbulence and momentum transfer between the two phases have been adopted from literature. The division of the dynamic viscosity of the suspension as a whole between the dynamic viscosity of the solid and fluid phase is a difficult issue in the current model. A derivation has been carried out in Appendix A which indicates that the viscosity of the suspension as a whole has to be divided between the two phases and that it is incorrect to assign the viscosity of the suspension as a whole to the viscosity of the fluid phase only. However, the proportion in which this division has to be made is still unknown.
6.1.2.1 Suspension viscosity The viscosity of suspensions is analysed experimentally utilizing a concentric cylinder rheometer. In the experimental work, carried out with neutrally buoyant particles, parameters that determine the behaviour of the suspension have been varied, using the same particulate and liquid material for all experiments. The solid volume fraction, particle diameter, liquid viscosity, and shear rate, have been varied systematically.
152
Concluding remarks and recommendations
The viscosity of suspensions is often assumed to depend only on the solid volume fraction and the maximum solid volume fraction of the particulate phase , . The current experimental results show that this description does not hold in general: the suspension viscosity also depends on the shear rate (non‐Newtonian behaviour), the particle diameter d and the viscosity of the suspending liquid . It has been shown that the dependence of the relative viscosity on shear rate can be represented quite well by the model of Ostwald‐de Waele. For low solid volume fractions , the behaviour is close to Newtonian. The suspensions show shear thinning behaviour, except at high solid volume fractions for the suspensions based on the smallest particles with a suspending liquid with high viscosity (when shear thickening behaviour was observed). This shear thinning behaviour becomes more pronounced at higher solid volume fractions. The results obtained for suspensions based on a liquid with a high viscosity are consistent with those reported in the literature. The relative viscosity is (practically) independent of particle diameter d. For suspensions based on a liquid with a low viscosity, a different behaviour is observed, in which the relative viscosity also depends on the particle diameter d. The relative viscosity is also significantly higher for systems with a low viscosity of the suspending liquid than for systems with a high liquid viscosity. The apparent maximum solid volume fraction , is determined by the value at which the relative viscosity diverges for increasing solid volume fraction. This maximum solid volume fraction , is substantially lower when the viscosity of the suspending liquid is low. In the present experimental work, the maximum solid volume fractions , at which the relative viscosity diverges, ranges from , 0.52 0.57 in experiments in which the viscosity of the suspending liquid is low, which is substantially lower than the range , 0.54 0.60 found for experiments in which the liquid viscosity is high.
6.1.2.2 Inter‐particulate stresses In the present work, an investigation has been carried out into a model for the particle pressure, needed to model the formation of a nearly stationary particle bed when the volume fraction of the particles reaches its maximum obtainable value. The particle pressure is described as a function of the solid volume fraction, in which the particle pressure increases sharply when the solid volume fraction approaches the maximum volume fraction. Models for the particle pressure available in literature (Gidaspow and Syamlal (1985), Gidaspow and Ettehadieh (1983), Bouillard et al. (1989)) often result in numerical instability. In order to investigate the numerical stability, a systematic study on the model for the particle pressure has been made. To obtain stability, the derivative of the particle pressure with respect
Concluding remarks and recommendations
153
to the volume fraction, / , needs to be of the same order of magnitude as , the force it has to oppose. Therefore, models for which this derivative is increasing rapidly are not suitable for obtaining a stable numerical solution method for a particle bed that is growing in size. Furthermore, the model for the particle pressure needs to be defined in such a way that the particle pressure becomes nearly zero at the interface between the particle bed and the flow above the bed, otherwise the solution diverges. The numerical implementation of the model for the solid pressure in the form is favourable over modelling of the solid pressure gradient directly , using . Although the latter is the default option in CFX, no non‐ , diverging solutions have been obtained for calculations in which the pressure gradient was implemented directly as . , The particle shear stresses have been modelled by the model of Pouliquen et al. (2006) and Jop et al. (2006), in which the inter‐particulate shear stress τ , , depends on the particle pressure and a friction coefficient , which depends on the solid volume fraction and the shear rate of the solid phase. The model of the inter‐ particulate shear stress is shown to be important in the formation of a particle bed inside a hopper. When these inter‐particulate shear stresses are not included, no physically meaningful flow solutions can be obtained.
6.1.3 Simulations of sedimentation The numerical simulations of sedimentation in a sedimentation column showed that correct sedimentation velocities can be predicted. Furthermore, it showed that grid convergence can be obtained. The simulations also showed that it is possible to model a bed of particles by implementing a model for the particle pressure. By changing the parameters of the model for the particle pressure, a model with increased numerical stability has been obtained.
6.1.4 Simulations of flow inside a hopper The numerical simulations of the flow inside a geometry representative for a hopper show that the numerical method is able to predict the filling curve, i.e. the mass as function of time. The method is able to predict the deviation of the filling curve from the ideal filling curve. The results of the simulations of the filling process of a hopper show that the flow patterns are characterized by regions of flow circulation and by the distribution of the solid volume fraction inside the domain. The flow is directed around regions with large solid volume fraction because in these regions, flow
154
Concluding remarks and recommendations
velocities are generally low, due to the high suspension viscosity and particle stresses. It shows that in order to predict the correct flow behaviour, models for viscosity and inter‐particulate stresses are important. The filling process is characterized by three stages. For the first stage the filling curve is linear and follows the ideal filling curve. In this stage of the filling process, the time‐rate of increase of the scaled mass is high. The second stage consists of a deviation from the ideal filling curve and particles are transported towards the outlet, causing the filling curve to fall below the ideal line. In this stage the flow behaviour changes slowly, and the flow streamlines will become approximately straight lines directly from inlet towards outlet. Once the flow pattern of approximately straight streamlines from inlet towards outlet has formed, the flow pattern does not change anymore. This is the last stage of the filling process and it is characterized by a low time‐rate of increase of mass inside the hopper, i.e. the scaled mass is approaching an asymptotic value. The filling curves of the hopper geometry are influenced by the conditions at the inlet of the hopper: particle diameter d, solid volume fraction at the inlet , and velocity at the inlet . Variation of the particle diameter d shows that the flow patterns are not influenced by the particle diameter d and that the transitions from one flow pattern to another take place at approximately the same (scaled) time. Only during the whole filling process the number of particles that are transported towards the outlet is larger for smaller diameter d.. Variation of the solid volume fraction at inlet , shows that for large solid volume fractions the first stage of the filling process, for which the time‐rate of increase of mass inside the hopper is high, is extended. The transitions in flow patterns occur at larger scaled times when the solid volume fraction is high. In the last stage of the filling process a lower solid volume fraction at the inlet , leads to a higher time‐rate of increase of the scaled mass . In general, the scaled mass inside the hopper is larger for a given time when the solid volume fraction at inlet , is high. The numerical method is able to predict the formation of a bed at the bottom of the hopper plausibly, including particle pressure and particle stresses. However, when the derivative of the particle pressure with respect to the solid volume fraction reaches large values, it is necessary to switch to an alternative formulation of the particle pressure because of divergence of the numerical solution procedure. The flow solution near the wall is represented correctly when the particles are still suspended, but when a particle bed is formed spurious variations in shear stresses can be generated in the first control volume adjacent to the wall. This cannot be
Concluding remarks and recommendations
155
prevented by applying free–slip conditions at the wall. Furthermore, the model for the particle pressure and particle shear stresses in the form of τ , P is needed to predict the formation of a bed of particles. When such a model is omitted no plausible flow solution is obtained.
6.2 Recommendations Based on the findings in the present research, the following recommendations for feature work are formulated.
6.2.1 Governing equations and constitutive equations An imperfection of the two‐fluid model used in the present work is that it is not able to describe the flow correctly at locations with high gradients in the volume fraction. This issue has to be addressed in future work. In the two‐fluid model, the viscosity of the suspension as a whole needs to be divided over the two phases. In the present work, it has been derived that it is incorrect to assign the viscosity of the suspension as a whole to the viscosity of the fluid phase or to the viscosity of the of the solid phase only. However, the proportion of this division requires further study.
6.2.2 Numerical implementation In the present work, the flow behaviour near the wall, predicted by the ‘scalable’ wall treatment by CFX, is not predicted correctly when a particle bed is formed. In future work, the governing equations can be cast in a framework in which it is possible to adjust the wall treatment. An adjustment of the wall treatment, employing when is small, might result in improved predictions of velocity and shear stress near the wall. Within a framework in which the boundary conditions can be changed, they can be improved, for example by employing alternative boundary conditions, such as a ‘frictional’ boundary condition of the solid phase, instead of the current no‐slip condition. The numerical stability of the model for the particle pressure is a problematic issue. Although substantial improvement has been made, by obtaining a ‘tuned’ model for the particle pressure, instead of the models available in literature, future work is needed to improve the stability even more in case larger scale geometries are to be considered.
156
Concluding remarks and recommendations
Detailed grid convergence studies should also be performed for the simulations of hopper filling.
6.2.3 Numerical simulations The performed numerical simulations have been obtained using a scaled hopper geometry with a scale of approximately 1:10 between the size of the employed computational domain and the size of a hopper inside a typical dredging ship. Calculations have to be made which make it possible to scale the current results to the flow inside a real‐size hopper inside a dredging ship. Simulations with various domain sizes with the same ratio of / should be performed. The resulting changes in the filling curves can be extrapolated in order to obtain an estimate of the filling curve of a real hopper. The present work focussed on changes in flow behaviour by changes of the flow conditions at the inlet of the domain. It is also possible to investigate the difference in flow behaviour by changes in the geometry of the hopper. Some suggestions are the change of the positions of inlet and outlet, the change of direction of the inlet (horizontal/vertical) and multiple inlet positions. Also three‐dimensional simulations may be performed, albeit time consuming, in order to investigate whether three‐dimensional effects affect the filling characteristics.
6.2.4 Validation experiments The numerical simulations can be validated by performing further experiments. These experiments can focus on the determination of the modelling parameters and on the flow inside a hopper.
6.2.4.1 Model parameters Small scale laboratory tests should be performed in order to determine the material properties of the sand and water mixture. An example of such parameters are the friction coefficients in the model for the inter‐particulate shear stresses, and , which can be obtained for each classification of sand grain size as well as sand grain size distributions. Current values for and are taken from Jop et al. (2006), who determined the values of and employing dry particles. It should be investigated how an interstitial liquid affects the values of the friction coefficients and . The maximum particle volume fraction can be determined experimentally. In the present work the particles are assumed to be spherical. It can
Concluding remarks and recommendations
157
be investigated how non‐spherical particles affect the material behaviour and how the models for viscosity and interparticle shear stresses have to be adjusted when non‐spherical particles are considered.
6.2.4.2 Hopper The results of numerical simulations of the flow inside a hopper should be compared with experimental results on a (small‐scale) hopper geometry (such as those of van Rhee (2002)) in order to assess the range of validity of the developed model. With such an experiment, the described flow patterns may be validated, as well as the location and growth of the bed of particles. Experiments can be performed with various inlet velocities, volume fractions at the inlet and particle diameters. Also, a solid volume fraction, consisting of a range of particle sizes, i.e. multi‐disperse distribution, can be used to investigate the validity of modelling the solid phase by a sequence of mono‐disperse suspensions and whether constitutive laws, such as the momentum transfer due to drag forces, need to be corrected in case a distribution of particle sizes is to be considered. Although the developed simulation method has been used to simulate hopper filling, it should be investigated whether it is suitable to predict the performance of for example dredging pumps.
158
Concluding remarks and recommendations
7 BIBLIOGRAPHY Abbott, J. R., N. Tetlow, A. L. Graham, S. A. Altobelli, E. Fukushima, L. A. Mondy and T. S. Stephens (1991). "Experimental observations of particle migration in concentrated suspensions: Couette flow." Journal of Rheology 35: 773‐795. Abedian, B. and M. Kachanov (2010). "On the effective viscosity of suspensions." Int. J. Eng. Sci.(48): 962‐965. Acrivos, A. and E. Herbolzheimer (1979). "Enhanced sedimentation in settling tanks with inclined walls." J. Fluid Mech. 92: 435‐457. Anderson, T. B. and R. Jackson (1967). "A fluid mechanical description of fluidized beds. Equations of motion." Ind. Eng. Chem. Fundam. 6: 527‐539. Bagnold, R. A. (1954). "Experiments on a gravity‐free dispersion of large solid spheres in a Newtonian fluid under shear." Proc. R. Soc. Lond. A. 225: 49‐63. Barnes, H. A. (1995). "A review of the slip (wall depletion) of polymer solutions, emulsions and particle suspensions in viscometers: its cause, character, and cure." J. Non‐Newtonian Fluid Mech. 56: 221‐251. Barth, T. J. and D. C. Jespersen (1989). "The design and application of upwind schemes on unstructured meshes." AIAA Paper 89‐0366. Batchelor, G. K. (1972). "Sedimentation in a dilute suspension of spheres." J. Fluid Mech. 52: 245‐268.
Bibliography
159
Batchelor, G. K. and J. T. Green (1972). "Determination of bulk stress in a suspension of spherical particles to order c2." J. Fluid Mech. 56: 401‐427. Beetstra, R., M. A. van der Hoef and J. A. M. Kuipers (2007). "Drag force of intermediate Reynolds number flow past mono‐ and bidisperse arrays of spheres." AIChE J. 53: 489‐501. Bird, R. B., W. E. Stewart and E. N. Lightfoot (2007). Transport Phenomena. New York, John Wiley & Sons. Bouillard, J. X., R. W. Lyczkowski and D. Gidaspow (1989). "Porosity distributions in a fluidized bed with an immersed obstacle." AIChE J. 35: 908‐922. Boycott, A. E. (1920). "Sedimentation of blood corpuscles." Nature 104. Boyer, F., E. Guazelli and O. Pouliquen (2011). "Unifying suspension and granular rheology." Phys. Rev. Lett. 107(188301). Brennen, C. E. (2005). Fundamentals of Multiphase Flows. Cambridge, UK, Cambridge University Press. Burgers, J. M. (1942). "On the influence of the concentration of a suspension upon the sedimentation velocity." Proc. Kon. Ned. Akad. Wet. 44. Buscall, R. (2010). "Letter to the editor: wall slip in dispersion rhoemetry." J. Rheol. 107: 1177‐1183. Camp, T. R. (1946). "Sedimentation and the design of settling tanks " Trans. ASCE 111: 895‐936. Campbell, C. S. (2006). "Granular material flows ‐ an overview." Powder Technology 162: 208‐229. Chang, C. and R. L. Powell (1994). "Effect of particle‐size distributions on the rheology of concentrated bimodal suspensions." J. Rheol. 38: 85‐98. Chauchat, J., G. Sylvain, D. V. B. Pham and K. D. Nguyen (2013). "Modelling sedimentation–consolidation in the framework of a one‐dimensional two‐phase flow model." Journal of Hydraulic Research 51:3: 293‐305. Chialvo, S., J. Sun and S. Sundaresan (2012). "Bridging the rheology of granular flows in three regimes." Physical Review E 84(021305). Chong, J. S., A. D. Christiansen and A. D. Baer (1971). "Rheology of concentrated suspensions." J. Appl. Polym. Sci. 15: 2007‐2021. Costa, P., F. Picano, L. Brandt and W. P. Breugem (2016). "Universal scaling laws for dense particle suspensions in turbulent wall‐bounded flows." arXiv.org( arXiv:1601.02440 [physics.flu‐dyn]). Dai, S.‐C., ;, E. Bertevas, F. Qi and R. I. Tanner (2013). "Viscometric functions for noncolloidal sphere suspensions with Newtonian matrices." Journal of Rheology 57: 493‐510.
160
Bibliography
Davis, R. H. and A. Acrivos (2003). "Sedimentation of Non‐Colloidal Particles at Low Reynolds Numbers." ann. Rev. Fluid Mech. 17: 91‐118. Deboeuf, A., G. Gauthier, J. Martin, Y. Yurkovetsky and J. F. Morris (2009). "Particle Pressure in a Sheared Suspension: A Bridge from Osmosis to Granular Dilatancy." Physical Review Letters 102(108301). Dobbins, W. E. (1944). "Effect of turbulence on sedimentation." ASCE Trans. 109: 629‐656. Drew, D. A. (1983). "Mathematical modeling of two‐phase flow." Ann. Rev. Fluid Mech. 15: 261‐291. Drew, D. A. and L. Passman (1999). Theory of Multicomponent Fluids. New York, Springer‐Verlag. Eilers, H. (1941). "Die Viskosität von Emulsionen hochviskoser Stoffe als Funktion der Konzentration." Kolloid Z. 97: 313‐321. Einstein, A. (1906). "Eine neue Bestimmung der Moleküldimensionen." Ann. Phys. 19: 230‐247. Enwald, H., E. Peirano and A.‐E. Almstedt (1996). "Eulerian two‐phase flow theory applied to fluidization." Int. J. Multiphase Flow 22: 21‐66. Ferrini, F., D. Ercolani, B. De Cindio, L. Nicodemo, L. Nicolais and S. Ranaudo (1979). "Shear viseosity of settling suspensions." Rheol. Acta 18: 289‐296. Forterre, Y. and O. Pouliquen (2008). "Flows of dense granular media." Ann. Rev. Fluid Mech. 40: 1‐24. Gadala‐Maria, F. and A. Acrivos (1980). "Shear‐induced structure in a concentrated suspension of solid spheres." Journal of Rheology 24: 799‐814. Gamonpilas, G., J. F. Morris and M. M. Denn (2016). "Shear and normal stress measurements in non‐Brownian monodisperse and bidisperse suspensions." Journal of Rheology 60. Gidaspow, D. (1994). Multiphase flow and fluidization: Continuum and kinetic theory descriptions. New York, USA, Academic Press. Gidaspow, D. and B. Ettehadieh (1983). "Fluidization in two‐dimensional beds with a jet II‐Hydrodynamic modelling." I & EC Fundam. 22: 193‐201. Gidaspow, D. and M. Syamlal (1985). Solid‐gas critical flow. AIChE Meeting, Chicago. Goddard, J. D. (1982). "Memory materials without characteristic time and their relation to the rheology of certain particle suspensions." Adv. Colloid Interface Science 17: 241‐262. Groot, J. M. (1981). Rapport Beunbezinking, Koninklijke Boskalis Westminster. Guazelli, E. and J. F. Morris (2012). A physical introduction to suspension dynamics. Cambridge, UK, Cambridge University Press.
Bibliography
161
Herschel, W. H. and R. Bulkley (1926). "Konsistenzmessungen von Gummi‐ Benzollösungen." Kolloid Z. 97: 291‐300. Hill, W. D. (1974). Boundary enhanced sedimenation due to settling convection. Ph.D., Carnegie‐Mellon University. Horri, B. A., P. Ranganathan, C. Selomulya and H. Wang (2011). "A new empirical viscosity model for ceramic suspensions." Chem. Eng. Sci. 66: 2798‐2806. Ishii, M. and M. Zuber (1979). "Drag coefficient and relative velocity in bubbly, droplet or particulate flows." AIChE Journal 25: 843‐855. Jackson, R. (2000). The dynamics of fluidized particles, Cambridge University Press. Jeffrey, D. J. (1973). "Conduction through a random suspension of spheres." Proc. R. Soc. Lond. Series A, Mathematical and Physical 335: 355‐367. Jeffrey, D. J. and A. Acrivos (1976). "The rheological properties of suspensions of rigid particles." AICHE J. 22: 417‐432. Jinescu, V. V. (1974). "The rheology of suspensions." Int. Chem. Eng. 14: 397‐420. Jop, P., Y. Forterre and O. Pouliquen (2006). "A constitutive law for dense granular flows." Nature 441: 727‐730. Joseph, D. D. and T. S. Lundgren (1990). "Ensemble averaged and mixture theory equations for incompressible fluid‐particle suspensions." Int. J. Multiphase Flow 16: 35‐42. Kapoor, B. and A. Acrivos (1995). "Sedimentation and sediment flow in settling tanks with inclined walls." J. Fluid Mech. 290: 39‐66. Kolkman, B. (2009). Modeling dense‐phase dredging flows, University of Twente. Kolmogorov, A. N. (1941). "The local structure of turbulence in incompressible viscous fluid for very large Reynolds numbers." Dokl. Akad. Nauk SSSR 30: 299‐303. Konijn, B. J., O. B. J. Sanderink and N. P. Kruyt (2014). "Experimental sudy of the viscosity of suspensions: Effect of solid fraction, particle size and suspending liquid." Powder Technology 266: 61‐69. Koos, E. (2009). Rheological measurements in liquid‐solid flows, PhD thesis California Institute of Technology. Koos, E., E. Linares‐Guerrero, M. L. Hunt and C. E. Brennen (2012). "Rheological measurements of large particles in high shear rateflows." Phys. Fluids 24(013302). Krieger, I. M. and T. J. Dougherty (1959). "A mechanism for non‐Newtonian flow in suspensions of rigid spheres." Trans. Soc. Rheol. 3: 137‐152. Kunitz, M. (1926). "An empirical formula for the relation between viscosity of solution and volume of solute." J. Gen. Physiol. 9: 715‐725. Kynch, G. J. (1952). "A theory of sedimentation." Trans. Faraday Soc. 48: 166‐176.
162
Bibliography
Launder, B. E. and B. I. Sharma (1974). "Application of the energy‐dissipation model of turbulence to the calculation of flow near a spinning disc." Lett. Heat Mass Transf. 1: 131‐138. Leighton, D. and A. Acrivos (1987). "The shear‐induced migration of particles in concentrated suspensions." J. Fluid Mech. 181: 415‐439. Liu, D. M. (2000). "Particle packing and rheological property of highly concentrated ceramic suspensions: maximum packing determination and viscosity prediction." J. Mater. Sci. 35: 5503‐5507. Majumdar, S. (1988). "Role of underrelaxation in momentum interpolation for calculation of flow with nonstaggered grids." Numerical Heat Transfer 13(1): 125‐ 132. Mari, R., R. Seto, J. F. Morris and M. M. Denn (2014). "Shear thickening, frictionless and frictional rheologies in non‐Brownian suspensions." Journal of Rheology 58: 1693‐1724. Maron, S. H. and P. E. Pierce (1956). "Application of Ree‐Eyring generalized flow theory to suspensions of spherical particles." J. Colloid Sci. 11: 80‐95. Maude, A. D. and R. L. Withmore (1958). "A generalized theory of sedimentation." Br. J. Appl. Phys. 9. Mewis, J. and M. J. Wagner (2009). "Thixotropy." Adv. Colloid Interf. Sci. 147‐148: 214‐227. Mooney, M. (1951). "Viscosity of concentrated suspensions." J. Colloid Sci. 6: 162‐ 170. Morris, J. F. and F. Boulay (1999). "Curvilinear flows of noncolloidal suspensions: The role of normal stresses." journal of Rheology 43. Mueller, S., E. W. Llewellin and H. M. Mader (2010). "The rheology of suspensions of solid particles." Proc. R. Soc. Lond. A. 466: 1201‐1228. Nakamura, H. and K. Kuroda (1937). "La cause de l’accélération de la vitesse de sedimentation des suspensions dans les recipients inclinés." Keijo J. Med. 8: 256‐ 296. Ni, F., W. J. Vlasblom and A. Zwartbol (1999). Effect of high concentration on characteristics of a slurry pump. Proceeding of the 14th International Conference of Slurry Handling and Pipe line Transport. Niemann, J. and E. Laurien (2001). "Computing virtual mass by direct numerical simulation." Z. Angew. Math. Mech. 81: S555‐S556. Ostwald, W. (1929). "Ueber die rechnerische Darstellung des Strukturgebietes der Viskosität." Kolloid Z. 47: 176‐187.
Bibliography
163
Ovarlez, G., F. Bertrand and S. Rodts (2006). "Local determination of the constitutive law of a dense suspension of noncolloidal particles through magnetic resonance imaging." Journal of Rheology 50. Phillips, R. J., R. C. Armstrong, R. A. Brown, A. L. Graham and J. R. Abbott (1992). "A constitutive equation for concentrated suspensions that accounts for shear‐induced particle migration." Phys. Fluids A 4: 30‐40. Picano, F., B. W.P. and L. Brandt (2015). "Turbulent channel ow of dense suspensions of neutrally buoyant spheres." J. Fluid Mech. 764: 463‐487. Pope, S. B. (2000). Turbulent Flows. Cambridge, UK, Cambridge University Press. Pouliquen, O., C. Cassar, P. Jop, Y. Forterre and M. Nicolas (2006). "Flow of dense granular material: towards simple constitutive laws." J. Stat. Mech.(P07020). Prasad, D. and H. K. Kytömaa (1995). "Paricle stress and viscous compaction during shear of dense suspensions." Int. J. Multiphase Flow 21: 775‐785. Richardson, J. F. and W. N. Zaki (1954). "Sedimentation and fluidization ‐ part I." Trans. Instn. Chem. Engnrs. 32. Roscoe, R. (1952). "The viscosity of suspensions of rigid spheres." Br. J. Appl. Phys. 3: 267‐269. Rutgers, R. (1962). "Relative viscosity and concentration." Rheol. Acta 2: 305‐348. Sanderink, O. B. J. (2012). Experimental study and modelling on the behaviour of suspensions. Enschede, The Netherlands, Department of Mechanical Engineering, University of Twente. Sangani, A. S. and A. Acrivos (1981). "Slow flow through a periodic array of spheres." Int. J. Multiphase Flow 8: 343‐360. Savage, S. B. and S. McKeown (1983). "Shear stresses developed during rapid shear of concentrated suspensions of large spherical particles between concentric cylinders." J. Fluid Mech. 127: 453‐472. Schiller, L. and A. Naumann (1933). "A drag coefficient correlation." Zeits. V.D.I. 77: 318‐320. Senepati, P. K., B. K. Mishra and A. Parida (2010). "Modelling of viscosity for power plant ash slurry at higher concentrations: effect of solids volume fraction, particle size and hydrodynamic interactions." Powder Technol. 197: 1‐8. Shapiro, A. P. and R. F. Probstein (1992). "Random packings of spheres and fluidity limits of monodisperse and bidisperse suspensions." Phys. Rev. Lett. 68: 1422‐1425. Stickel, J. J. and R. L. Powell (2005). "Fluid mechanics and rheology of dense suspensions." Annu. Rev. Fluid Mech. 37: 129‐149. Tanner, R. I. and S.‐C. Dai, ; (2016). "Particle roughness and rheology in noncolloidal suspensions." Journal of Rheology 60.
164
Bibliography
Taylor, G. I. (1923). "Stability of a viscous liquid contained between two rotating cylinders." Philos. Trans. R. Soc. Lond. A. 223: 289‐343. Tenneti, S., S. Garg and S. Subramaniam (2011). "Drag law for monodisperse gas‐ solid systems using particle‐resolved direct numerical simulation of flow past fixed assemblies of spheres." Int. J. Multiphase Flow 37: 1072‐1092. Trulsson, M., B. Andreotti and P. Claudin (2012). "Transition from the viscous to inertial regime in dense suspensions." Physical Review Letters 109(118305). van der Hoef, M. A., M. Van Sint Annaland, N. G. Deen and J. A. M. Kuipers (2008). "Numerical simulation of dense gas‐solid fluidized beds: A multiscale modeling strategy." Annu. Rev. Fluid Mech. 40: 47‐70. Van Rhee, C. (2002). On the sedimentation process in a trailing suction hopper dredger, TU Delft. Van Wijngaarden, L. (1976). "Hydrodynamic interaction between gas bubbles in a liquid." J. Fluid Mech. 77: 27‐44. Vand, V. (1948). "Viscosity of solutions and suspensions II: experimental determination of the viscosity‐concentration function of spherical suspensions." J. Phys. Colloid Chem. 52: 300‐314. Vlasblom, W. J. and S. A. Miedema (1995). A theory for determining sedimentation and overflow losses in hoppers. Proc. of the 14th World Dredging Congress. Amsterdam. Von Kármán, T. (1930). "Mechanische Änlichkeit und Turbulenz." Nachrichten von der Gesellschaft der Wissenschaften zu Göttingen 5: 58‐76. Wen, C. Y. and Y. H. Yu (1966). Mechanics of Fluidization. Chem. Eng. Prog. Symp. Series. 62: 100‐111. White, F. M. (1974). Viscous fluid flow. New York, McGraw‐Hill. Wilcox, D. C. (2006). Turbulence modeling for CFD, DCW Industries, Inc. Wildemuth, C. R. and M. C. Williams (1984). "Viscosity of suspensions modelled with a shear‐dependent maximum packing fraction." Rheol. Acta 23: 627‐635. Zarraga, I. E., D. A. Hill and L. J. D.T. (2000). "The characterization of the total stress of concentrated suspensions of noncolloidal spheres in Newtonian fluids." Journal of Rheology 44: 185‐220. Zhang, D. Z. and A. Prosperetti (1994). "Averaged equations for inviscid disperse two‐phase flow." J. Fluid Mech. 267: 185‐219.
Bibliography
165
8 APPENDICES
Appendices
167
Appendix A The averaged equations for two‐ phase flow This appendix describes the derivation of the averaged equations for two‐phase flow. The derivation given by Enwald et al. (1996) is followed. A control volume is considered which consists of a fluid phase f and a solid phase s. Both phases are separated by interface , the boundary between the fluid and solid phase. No mass transfer between the two phases is assumed. Such a control volume is shown in Figure 8.1.
Figure 8.1: Control volume of particles suspended in a fluid.
Local instantaneous equations and jump conditions When both phases are considered as a continuum, the local instantaneous continuity equations and momentum equations are:
⋅ ⋅
(A‐ 1)
0, ⋅
.
(A‐ 2)
Here, is the density, is the velocity, is the stress tensor and is the gravitational acceleration. Subscript k can be the fluid phase f or the solid phase s, for which the equations are valid in the region with the fluid phase and in the region with the solid phase , respectively. At the interfaces , separating fluid and solid phase, the jump condition for the continuity equation is:
168
Appendices
∙
(A‐ 3)
0.
Here is the velocity of the interface, and and are defined as the unit normal vector at the interface, pointing outward of phase f and s, respectively. Equation (A‐ 3) implies that when travelling with the interface, both solid and fluid phase have no velocity component perpendicular to the interface, since there is no mass transfer between the phases. The jump condition for the momentum equation at the interface reads:
∙
∙
(A‐ 4)
.
This can be interpreted as the third law of Newton. The force applied by the fluid phase on the solid phase is equal to the force applied by the solid phase on the fluid phase.
Averaging procedure The instantaneous momentum, continuity and jump equations can be written as macroscopic equations by applying an averaging procedure. The most general averaging procedure uses the ensemble average, which defines the averaged quantity 〈 〉 of an arbitrary quantity :
〈 〉
(A‐ 5)
.
Here dP(µ) is the probability of observing process µ and ε is the set of all possible realizations. A useful aid to construct the equations describing two‐phase flow is the phase indicator function. This function is defined as:
1 0
,
∈ ∉
(A‐ 6)
.
and are the volumes occupied by the Here, , is the location and time, fluid and solid phase, respectively, at time t. For example, 1 means that , at time tx, location is occupied by the interstitial fluid. The average of the phase indicator function is equal to the average occurrence of phase k, which is defined as the volume fraction :
〈
〉
(A‐ 7)
.
The variables in the momentum and continuity equations are averaged in the follow‐ ing way:
Appendices
169
〈
〉
〈
〉
〈
(A‐ 8)
,
〉
(A‐ 9)
,
(A‐ 10)
.
Here, density and stress tensor are weighted with the phase indicator function (phasic average), and velocity is weighted with the phase indicator function times the density (Favre or mass‐weighted average). The averaged fluid density 〉, can be interpreted as the average probability of observing a fluid density, 〈 divided by the probability of observing the fluid phase, 〈 〉. The averaged equations can be obtained by multiplying the momentum and continu‐ ity equations by the phase indicator function, equation (A‐ 7). Subsequently, the terms in the equations are ensemble averaged. For example, when the instantaneous continuity equation, (A‐ 1), is multiplied by the phase indicator function and the ensemble average of the equation is taken, this gives:
〈
〉
〈
⋅
〉
(A‐ 11)
0.
This can be written in a different way using the product rule of differentiation:
〈
〉
〈 ⋅
〉
〈
⋅
〉
0.
(A‐ 12)
Material derivative of the phase indicator function The third term on the left‐hand side can be recognized as the material derivative / / ∙ of the phase indicator function, which signifies the change of a variable when travelling with the flow. When travelling with the flow within a phase, the phase indicator function does not change, since only flows with no mass transfer between the phases are considered. The material derivative at the interface needs some more consideration, since it is not straightforward to see how it needs to be interpreted. At the interface, the spatial derivative of the phase indicator function is discontinuous. The gradient of the phase indicator function, , only has a non‐zero value at the interface AI separating the two phases. Its direction is always normal to the interface, and it can therefore be expressed as:
170
Appendices
(A‐ 13)
.
Here, is the unit normal pointing outward from the region with phase k. The spatial derivative of the phase indicator normal to the interface is discontinuous. Its magnitude can be expressed by:
(A‐ 14)
.
Here is the Dirac’s delta function, which has the property
(A‐ 15)
.
/ , can be non‐zero at the The time derivative of the phase indicator function, interface AI, but is only non‐zero at the interface if the velocity of the interface is in the direction of the location where the face indicator function is evaluated. For example, when the phase indicator function is evaluated just at the fluid side of the interface, thus 1, its time derivative, / is only non‐zero if the normal component of the velocity of the interface ∙ is negative. The material derivative of the phase indicator function can be written in a different way, using the instantaneous jump equation (A‐ 3) which states that at the interface ⋅ ⋅ .
⋅
⋅
(A‐ 16)
.
Drew (1983) derived the following relation between the time derivative and spatial derivative at the interface:
⋅
(A‐ 17)
.
Equation (A‐ 17) shows that the rate of change of the phase indicator function is in balance with the velocity of the interface and the spatial derivative of the phase indicator function. Or in other words, when travelling with the interface and evaluating the phase indicator function just at the fluid side, the phase indicator function is always at the brink of change. The material derivative of the phase indicator is zero everywhere, also at the interface AI. This is a useful property that will be used in the derivation of the averaged equations.
Appendices
171
Averaged equations Since the material derivative of the phase indicator is always zero, Equation (A‐ 12) becomes:
〈
〉
〈 ⋅
〉
Substitution of the averaged density , and velocity 9), gives the averaged continuity equation:
(A‐ 18)
0.
, equations (A‐ 8) and (A‐
⋅
(A‐ 19)
0.
The averaged momentum equation is derived in a similar way. Multiplication of the instantaneous momentum equation, (A‐ 2), with the phase indicator function and ensemble averaging each term gives:
〈
〉
〈
〉
⋅
〈
〉
⋅
〈
(A‐ 20)
〉.
Using again the product rule for differentiation and the property that the material derivative of the phase indicator function is always zero, this can be written as:
〈
〉
〈 ⋅ 〈
Substituting the averaged variables this becomes:
〉 〉
⋅
and
〈
〈
〉.
, using equations (A‐ 8) and (A‐ 9)
〉
〈 ⋅
(A‐ 21)
〉
⋅
(A‐ 22)
.
The convective part on the left hand side of the momentum equation can be rewritten by expressing the local phase velocity by a Reynolds‐like decomposition:
(A‐ 23)
,
with a fluctuation around the averaged velocity on the left hand side of equation (A‐ 22) gives
172
〈
〉
〈
〉
. Expanding the second term
〈
〈
〉 〉.
Appendices
(A‐ 24)
In the last term, we can use the averaging property 〈 〈 〉〉 〈 〉〈 〉, and make the 〉 0, because is a velocity fluctuation. By defining a assumption that 〈 Reynolds‐like stress tensor as
〈
〉
〈 〉
with 〈
〉
(A‐ 25)
,
, equation (A‐ 24) becomes :
〈
〉
The first term on the right hand side of equation (A‐ 22), 〈 more attention. It can be written as:
〈
〉
⋅
(A‐ 26)
.
∙〈
〉
〈
∙
⋅
〉, requires some (A‐ 27)
〉,
, using the Here, the first term on the right hand side can be expressed as ∙ averaged stress tensor from equation (A‐ 10). Before these terms are refined further, first, the averaged jump equation is discussed. Recall the instantaneous jump equation at the fluid‐solid interface, equation (A‐ 4). This equation can be ensemble averaged in the following way:
〈
〉
∙
〈
(A‐ 28)
〉.
∙
/ , is Dirac’s delta function, given by equation (A‐ 14). It is Here, assumed that when the product of the Dirac’s delta function and the traction vector is averaged, as is done in equation (A‐ 28), it results in the average contribution of the traction vector over the averaging domain. The Dirac’s delta function can also be used to write the gradient of the phase indicator as , as given by equation (A‐ 13). Hence, the averaged jump equation in equation (A‐ 28) can also be written as:
〈
〉
∙
〈
(A‐ 29)
〉.
∙
The right hand side of equation (A‐ 29) is present in the momentum equation via equation (A‐ 27). It can be understood as the influence of the presence of the traction forces on the interfaces on the surrounding flow. It is often called the momentum transfer:
〈 〈
Appendices
∙ ∙
〉 〉
→ →
, .
(A‐ 30)
173
Here, the momentum transfer → is the ‘force per unit volume’ by the fluid phase on the solid phase. Equation (A‐ 30) is the equivalent of Newton’s third law, which states that action equals minus reaction. Summarizing, the momentum equations for fluid and solid phase are:
⋅
(A‐ 31)
∙
→
,
and:
⋅
(A‐ 32)
∙
→
,
respectively.
Alternative derivation An alternative derivation is presented in the book of Brennen (2005). This derivation uses a less formal approach. For example, the continuity equation is derived by considering a control volume containing two‐phase flow in a similar way as shown in Figure 8.1. The control volume is assumed to be a unit cube, with faces perpendicular to the x‐,y‐, and z‐directions. The mass flow of component k is through one of the faces perpendicular to the i‐direction is given by the normal component of . Now the continuity equation is derived by simply stating that when there is no mass transfer between the two phases, the increase of the mass of one phase within the control volume, , is determined by the divergence of the term.
⋅
(A‐ 33)
0,
All the variables in this equation are the volume‐averaged variables over the unit cube. The momentum equation is derived, employing the same unit cube, as:
⋅
.
(A‐ 34)
Here, is the sum of the forces acting on phase k. For the determination of the forces on each phase, a control volume is taken, containing both phases, with the boundary of the control volume always in the continuous phase, not crossing any dispersed particles. This is done to avoid the difficulty of defining tractions within the particles, which have to be determined if
174
Appendices
the control volume is arbitrary and particles at the boundary of the control volume can be cut through.
Figure 8.2: Control volume of particles suspended in a fluid, as used by Brennen (2005).
With the control volume set up as in Figure 8.2, the forces on each phase can be determined. The forces on the continuous phase are gravitational forces, the traction forces on the boundary of the domain and the forces on the particles → :
∙ ̿
→
(A‐ 35)
.
Note that in this equation the volume fraction of the fluid phase is not present in the pressure term and the deviatoric stress tensor term, since the boundary of the domain lies within the fluid phase only. The forces on the particulate phase are the gravitational forces and the forces from the fluid on the particles:
→
(A‐ 36)
.
The forces from the fluid on the particles are separated into a buoyancy force and a force → , due to other effects such as relative motion between the phases, such as the drag force:
→
→
(A‐ 37)
.
The momentum equation for the fluid phase becomes:
Appendices
175
⋅
(A‐ 38)
∙ ̿
→
.
The momentum equation for the solid phase is:
⋅
(A‐ 39) →
.
All variables in these equations are the averaged variables, averaged over the control volume. These equations differ from the momentum equations obtained earlier, see equations (A‐ 31) and (A‐ 32). The deviatoric part of the stress tensor in the equation for the fluid is not multiplied by a factor and there is no deviatoric stress tensor present in the solid phase, only a buoyancy force. The difference between these equations is caused by the assumption that the boundary of the control volume only cuts through the fluid phase and does not cut through any particles. Although this derivation appears to avoid difficulties, it has some peculiarities. Firstly, the usual assumption that the equations have to hold for any arbitrary control volume is lost by the assumption that the boundary of the control volume always lies within the fluid phase. Secondly, as soon as a particle leaves such a control volume, the particle crosses the boundary, the assumption that the whole boundary lies in the fluid phase is lost and the validity of the equations is lost. Thirdly, the momentum equations for the solid phase given by equation (A‐ 39), and the continuity equation of the solid phase given by equation (A‐ 33) have been derived by using two different control volumes. When the control volume in Figure 8.2 is also used to derive the continuity equation, this does not lead to a meaningful result, since no particles ever cross the boundary and the continuity equation for the solid phase is not obtained. Since some debatable assumptions have been made in order to derive the momentum equations (A‐ 38) and (A‐ 39), these equations will not be used in this thesis. Instead, equations (A‐ 31) and (A‐ 32) , derived earlier, are used.
176
Appendices
Appendix B Constitutive models for the stress tensors and their viscosities The stress tensor , present in the local instantaneous momentum equation (A‐ 2) can be expressed in terms of its hydrostatic part and its deviatoric part: (B‐ 1) ̿
̿ .
It is present in the averaged momentum equations (A‐ 31) and (A‐ 32) in the term 〉. The ∙ , originally expressed in local instantaneous variables as ∙ 〈 fluid and solid phase are assumed to share a single pressure p, an assumption that is needed to close the system of equations describing the flow. This pressure can be used to write:
〈
〉
(B‐ 2)
.
where is the pressure shared by the two phases. Hence, we find:
〈
〉
(B‐ 3)
.
, arising after substitution of equation (B‐ 3) in the The term in the momentum equation (A‐ 31) can be split into two parts using the chain rule of differentiation, as and . The part is a term similar to momentum transfer, since . This term is often neglected because it is only considered to be important for stratified flows only, but not for dispersed flows. It is also neglected in the present work. Thus for the fluid phase, we have: (B‐ 4) 〉 ∙〈 .
For the solid phase, the instantaneous pressure is usually split into a hydrodynamic pressure, assumed to be equal to the pressure , shared with the fluid phase, and a solid pressure . , i.e. . describing the inter‐particulate forces. An average solid pressure can be defined as the solid pressure (also known as particle pressure) ≡ 〈 , 〉, which yields:
∙〈
〉
(B‐ 5)
.
. Here, the second term on the right hand side is sometimes written as Since this term is modelled by an empirical model it does not matter which form is chosen. However, care should be taken which form the author of the specific empirical model had in mind. The solid pressure is only present in the momentum
Appendices
177
equation for the solid phase. The term present in the momentum equation for the solid phase is sometimes referred to as the buoyancy force, since it is in agreement with Archimedes’ principle. Enwald et al. (1996) state that the averaged stress tensors of both the fluid and the solid phase are often modelled as a Newtonian fluid:
̿
2 1 2
2 3
,̿
∙
(B‐ 6) (B‐ 7)
.
is based on the average velocity. The use of the symbol The strain rate tensor by Enwald et al. (1996) in equation (B‐ 6) is confusing, since this viscosity represents the viscosity of the fluid based on the macroscopic flow variables, and will be some sort of mixture viscosity, which can depend on the volume fraction of the particles, for example. Therefore, it is better write equation (B‐ 6) with a macroscopic viscosity , so that a clear distinction is made between the viscosity associated with the strain rate tensor of the macroscopic, averaged flow and the instantaneous, microscopic fluid viscosity . The assumption that is made to arrive at equation (B‐ 6) from the averaging procedure is:
〈
̿ 〉
2
2 3
∙
̿
(B‐ 8)
Note that equation (B‐ 8) is an assumption. It cannot be derived analytically from the averaging procedure. In literature, often , the viscosity of the suspension as a whole is presented. As noted by Enwald et al. (1996), it is not evident how to divide this viscosity as a whole between the two phases, but often a linear relationship is employed: (B‐ 9) ,
Here the viscosity of the suspension is divided proportionally over the two phases by equating and , resulting in . To check whether this assumption is meaningful, the flow solution for dilute suspensions, originally derived by Einstein (1906) is analysed in the subsequent section.
178
Appendices
Derivation of the viscosities of the different phases for dilute suspensions In this section an attempt is made to derive a useful description for viscosities and for dilute suspensions. Firstly, the flow field around a single particle in Stokes flow is analysed. Secondly, a dilute suspension inside a control volume is considered, resulting in a description of and for a dilute suspensions. Thirdly, the outcome of this analysis is compared with results of other analyses available in literature. Einstein (1906) considered a fluid in a plane shear flow and investigated how this plane shear flow is perturbed when a solid, rigid sphere is inserted. The sphere is assumed to follow the flow, so that at the mid‐plane of the sphere, the velocity of the sphere is equal to that of the undisturbed fluid. Because the whole sphere has the velocity of the mid‐plane, the velocity of the top half of the sphere will be lower than that of the unperturbed fluid and the velocity of the bottom half of the sphere will be higher than the unperturbed fluid. For simplicity, the mid‐plane is assumed to have zero velocity. The flow is assumed to be incompressible, steady and the particle Reynolds number is assumed to be small, hence it satisfies the (linear) Stokes equations. A no‐slip boundary condition applies at the surface of the sphere. Far away from the particle, at infinite distance, the perturbed velocity field around the particle is assumed to be equal to the original, unperturbed velocity field without particles present. The plane shear flow can be decomposed in a rotational flow and a straining flow:
∙ 1 2 1 2
(B‐ 10)
∙
(B‐ 11)
,
(B‐ 12)
.
Here, is the velocity vector, is the position vector relative to the centre of the sphere, is a constant, symmetric, traceless tensor known as the rate of strain tensor and is a constant, antisymmetric traceless tensor, known as the rotation tensor.
Appendices
179
Figure 8.3: Decomposition of a plane shear flow in a rotational flow and a straining flow.
Solutions for the velocity and pressure field around a particle in rotational flow and around a particle in straining flow can be found, with the appropriate boundary conditions. Due to the linearity of the Stokes equations and the boundary conditions, these solutions can be superposed to find the flow solution around a particle in plane shear flow. The solution for the velocity field and pressure field around such a particle can be found by using decaying harmonics, see for example Guazelli and Morris (2012). Solutions for the pressure field indicate the disturbance pressure, i.e. the changes in the pressure field of the undisturbed flow after the insertion of a particle. For the rotational flow solution, when the particle is free to rotate with the flow, there is no disturbance, so ∙ , and the particle is rotating with the same rotational speed as the flow. The pressure field is not disturbed. Since this flow solution is purely rotational, there is no rate of strain present in the velocity field and the stresses on the particle surface are zero. The flow solution for a particle in a straining flow field is given by:
∙
∙
| | 5 ∙ ∙ 2| |
(B‐ 13)
| |
| |
.
Here, is the radius of the spherical particle. Figure 8.4 shows a particle in a velocity field, given by .
180
Appendices
Figure 8.4: Left: Velocity field around a particle inserted in a plane shear flow. In red: the unperturbed velocity field, in blue: the perturbed velocity field due to the particle. Right: Streamlines around a particle inserted in a plane shear flow.
Figure 8.4 shows the flow solution of a particle in a plane shear flow. The left side of the figure shows that the magnitude of the fluid velocity is reduced throughout the domain. The right side of the figure shows that near the particle closed streamlines are formed. The disturbance pressure, created by insertion of a particle in a straining flow field is given by:
5 2
∙
∙
(B‐ 14)
| |
(p‐p )/( liq du/dy)
2
y/rsphere
1
1
0
0
‐1
‐1
‐2 ‐2
‐2
‐1
0
x/rsphere
1
2
Figure 8.5: Normalized pressure distribution around a particle in a suspension in plane shear flow, in z=0.
Appendices
181
The traction ∙ at the particle surface needs to be determined, in which the stress tensor is given by with ̿ 2 . It consists of the pressure p and the shear . Hence, the gradient of the velocity with stress, given by 2 field needs to be evaluated at | | :
||
5
|
5
∙
∙
∙
2
2
(B‐ 15)
,
where equation (B‐ 13) has been used for the velocity field with the outward normal on the sphere surface:
1 2 5 2
| |
5 2
∙
∙
5
. Using
(B‐ 16)
∙
∙
The pressure can also be evaluated at the particle surface:
||
5
|
∙
∙
(B‐ 17)
This gives for the traction ∙ on the particle surface:
∙
5
(B‐ 18)
∙
1 has been used. For an undisturbed plane shear flow in which only the Here, ∙ velocity in x‐direction is non‐zero and depends on y only, i.e. in which the only non‐ zero values of the strain tensor are and , both equal ½ / , the corresponding traction vectors are shown in Figure 8.6.
182
Appendices
1
y/rsphere
0.5 0 ‐0.5 ‐1 ‐1.5
‐1
‐0.5
0 x/rsphere
0.5
1
1.5
Figure 8.6: Traction vectors acting at the surface of the cross section of a particle inserted in a plane shear flow, as given by equation (B‐ 18), / = 1.
The net force acting on such a particle can be obtained by integration of the traction vectors over the surface. For the evaluation of this integral, spherical coordinates are used. The spherical coordinates are given by (see also Figure 8.6): (B‐ 19)
The unit normal on a sphere is given by:
(B‐ 20)
Of interest is the x‐component of ∙ , which is given by equation (B‐ 19):
∙
(B‐ 21)
5
Integration of the x‐component over the surface of the sphere in contact with the fluid gives the force in x‐direction that is exerted by the flow on the sphere.
Appendices
183
Figure 8.7: Schematic of a spherical particle cut by a horizontal plane.
Expressing
5
(B‐ 22)
5
as
, it follows after some algebra that:
5
(B‐ 23)
5 The force exerted by the fluid on the bottom part of the sphere points in negative x‐ direction. This could also have been concluded from Figure 8.6. The force applied by the fluid on the bottom part of the particle is balanced by a force applied by the top part of the sphere on the bottom part of the sphere, acting on the cut surface , since the particle is in equilibrium. This force, acting on the cut surface , equals an average particle stress , multiplied by the area of the cut surface. Therefore the average particle stress , can be calculated by division of the force , given by : equation (B‐ 23) by the surface area π
184
,
(B‐ 24)
5
Appendices
Einstein (1906) showed that the part of the velocity associated with the strain tensor of the perturbed velocity field u can be approximated. An unperturbed velocity field in pure strain is given by: (B‐ 25)
∙ .
,
The perturbed velocity field can be approximated, valid sufficiently far away from the particle, as: (B‐ 26) ~ ∙ . ,
This is also shown in Figure 8.4, in which the velocity vectors in the perturbed velocity field, displayed in blue colour, are smaller than the velocity vectors in the unperturbed velocity field displayed in red colour. The part of the perturbed velocity field associated with pure strain can be approximated by equation (B‐ 26). This means that the flow around the particles needs to be determined as if the particles were inserted in an unperturbed velocity field in which the part of the velocity field associated with pure strain is larger. The strain rate in the unperturbed velocity field is approximately 1/ larger than that in the perturbed velocity field, as given in equations (B‐ 25) and (B‐ 26). This effect needs to be accounted for in the determination of the shear stresses and . The solution of the flow around a spherical particle suspended in a fluid in shear flow can give insight in how to divide the viscosity of a suspension between the solid and fluid phase. This is analysed in the following example. A suspension in shear flow is considered. The suspended particles are spherical and all have the same size. A unit cube is taken as a control volume. A schematic of this control volume is given in Figure 8.8.
Figure 8.8: Schematic of a unit cube control volume containing a suspension in plane shear flow, with an apparent shear rate of du/dh over the height of the control volume.
Appendices
185
It is assumed that the suspension is dilute and the equations of Einstein can be used, so that the velocity and pressure fields around the particles and the traction on the particles are given by equations (B‐ 13) and (B‐ 14), respectively. Furthermore, it is assumed is that there is a velocity gradient over the height of the box, given by du/dh in Figure 8.8. The corresponding strain rate of the apparent velocity field is given by a constant, symmetric, traceless tensor . This strain rate corresponds to the perturbed velocity field as given in equation (B‐ 26). A fraction of of the top surface will be covered by particles, and a fraction of of the surface will be covered by suspending fluid. Particles at the top boundary of the control volume are cut horizontally as in Figure 8.7. The average shear stress , , acting on the horizontal section of particles that are cut through will be non‐zero, since the force acting on the horizontal cut has to balance the traction vectors acting on the bottom of the particle, located inside the control volume. This particle stress is derived analytically from the flow solution of a particle in straining flow, given by equation (B‐ 23). Note that in this case, particles are inserted in an undisturbed straining field given by / , thus the stress on an individual particle will be:
,
,
(B‐ 27)
5
The total stress acting on the top surface of the control volume is given by , , since the control volume is a unit cube. Comparing this stress with the stress 2 when no particles are present gives the augmentation factor , of the viscosity due to the presence of the particles. The total shear stress on the upper surface of the control volume is given by the sum of the shear stresses in the solid and fluid phase, hence the augmentation factor in exerted stress on the boundary of the domain is given by:
,
/ 1
,
5 2
(B‐ 28)
/ 1
.
This augmentation factor is in agreement with the relation of Einstein (1906) which . states that the augmentation equals 1 Abedian and Kachanov (2010) obtained a similar theoretical lower bound for the relative viscosity for systems with monodisperse spherical particles, based on the use of variational methods for Stokes flow. This bound states that the relative viscosity satisfies 1 / 1 , the same result as obtained in equation (B‐ 28). Equation (B‐ 28) shows that when particles are added to a fluid in pure shear, there is an increase in shear stresses in the fluid phase, the first term on the right hand
186
Appendices
side of equation (B‐ 28) and there are shear stresses present in the solid phase which are directly related to the strain rate in the fluid. Therefore, this derivation gives a useful insight how to divide the total suspension viscosity between the two phases if the two phases are modelled separately. When Enwald et al. (1996) are followed, and the stress tensors of both phases are modelled as a Newtonian fluid:
̿
2
(B‐ 29)
,̿
∙
both phases need to have a non‐zero viscosity in order to be able to model these stresses. Therefore, in the present work, both phases are assumed to share one suspension viscosity, which is divided proportionally over the volume fractions of the two phases as proposed by Enwald et al. (1996).
Alternative derivation Joseph and Lundgren (1990) attempted to derive an expression for the deviatoric part of the fluid stress tensor analytically. They start with the statement that:
〈
〉
2
〈2
〉
〈
(B‐ 30)
〉.
2
Here is the local rate of strain tensor and is the local instantaneous viscosity. They state that the solid phase is rigid, and therefore strain rate tensor is zero in the solid phase, and therefore 〈 2 〉 equals zero. By stating that the averaged rate of strain tensor of the instantaneous velocity 〈 〉 equals the rate of strain tensor of the averaged velocity 〈 〉 they find:
〈
2
〉
〈
2
(B‐ 31)
〉,
where 〈 〉 can be expressed in terms of the averaged velocities the averaged velocity over the whole control volume:
〈
and
is
(B‐ 32)
,
〉
.
hence,
〈
2
〉
(B‐ 33)
.
2
Summarizing, averaging the stress tensor according to Joseph and Lundgren (1990), gives
〈
〉
Appendices
̿
2
(B‐ 34)
,
187
This stress tensor differs from the one given by Enwald et al. (1996) in equation (B‐ 6). Although the derivation by Joseph and Lundgren (1990) looks straightforward at first glance, some disputable steps have been made. This can be made clear by writing equation (B‐ 30) in its original form, in which the stress tensors of both phases are yet only divided in a pressure and deviatoric stress tensor:
〈
̿ 〉
〈 ̿
̿ 〉
〈
̿ 〉.
(B‐ 35)
Equation (B‐ 35) can only be written in the form of (B‐ 30) if the deviatoric stress tensors of both solid and fluid phase can be modelled as a Newtonian fluid and if both instantaneous viscosities of the fluid and solid phase have the same value. This is a questionable assumption, because considered here is the instantaneous shear stress within the solid phase. Stresses inside a particle are usually not modelled by a Newtonian fluid model. In the next step, from equation (B‐ 30) to (B‐ 31), because 〉 is dropped from the in the solid phase is always zero, the term 〈 2 equation. The disappearance of this term is a consequence of their assumption that the solid stress can be modelled as a Newtonian fluid. The step between equation (B‐ 30) and (B‐ 31) is equivalent to the expression 〈 ̿ 〉 0, which is an invalid assumption. Note that viscosity in equation (B‐ 34) is the local instantaneous viscosity. Since the deviatoric stress tensor for the solid phase is already set to zero in this derivation, this derivation would always result in a suspension viscosity that equals the instantaneous viscosity in the fluid phase, which is incorrect, since the viscosity of a suspension is dependent on the volume fraction of the particulate phase.
Summary The analytical solution also shows that derivations of averaged equations in which the stresses in the solid phase are not taken into account are questionable, since stresses in the solid phase are always present, even in dilute flows. Examples are the derivation by Joseph and Lundgren (1990), in which the shear stresses in the solid phase are set to zero, and the equation presented by Brennen (2005), in which the shear stresses in the solid phase have disappeared due to the choice of a non‐ arbitrary control volume. In the present work, both phases are assumed to share a single suspension viscosity, which is divided proportionally over the volume fractions of the two phases as proposed by Enwald et al. (1996). In this way the stresses inside both fluid and solid phase are accounted for.
188
Appendices
Appendix C Implementation of the user defined functions in the numerical model The following functions are modelled by user defined functions in CFX: Momentum transfer due to drag Momentum transfer due to virtual mass Suspension viscosity Solid particle pressure Solid particle shear stress Their implementation is summarized in this section.
Momentum transfer due to drag The momentum transfer due to drag is often expressed using a drag coefficient
1 2
→
:
(C‐ 1)
.
Here and are the particle reference area and the particle volume, respectively. The drag coefficient is given by:
24
10
1
0.413 24
1.5 (C‐ 2)
1
3
.
8.4
, 1
10
following Beetstra et al. (2007). For details, see section 2.2.3. The particle Reynolds number is defined such that it is non‐zero in order to prevent divisions by zero:
, 1 ∙ 10
Appendices
(C‐ 3)
.
189
Momentum transfer due to virtual mass The employed virtual mass coefficient is given by the relation of Niemann and Laurien (2001):
1 2
3.26 2
7.7 2
(C‐ 4)
.
Suspension viscosity The viscosities are determined by the relation of Krieger and Dougherty (1959) is used. The viscosity of the whole suspension is a function of the volume fraction of the solid phase and the maximal volume fraction of the solid phase . , ,
1
,
,
,
(C‐ 5)
with α , 0.55. The suspension viscosity is divided proportionally between the phases: . In order to avoid numerical difficulties at the asymptote of the equation for , the equation is cut‐off at 0.54. For volume fractions α larger than 0.54 , is approximated by a second order polynomial. The first and second derivative of the polynomial match the first and second derivative of at 0.54.
Solid particle pressure The particle pressure consists of a dynamic part, depending on the shear rate , given by the model of Pouliquen et al. (2006) and Jop et al. (2006):
,
,
,
,
(C‐ 6)
,
with , 0.4 and , 0.55. The static part of the particle pressure, depending on the volume fraction α , given by the model of Chauchat et al. (2013) is:
190
,
∗
.
Appendices
(C‐ 7)
Here 1 ∙ 10 Pa, α∗ 0.4 and ζ 3. Sometimes a value 4 ∙ 10 Pa has been used. A comparison of the model of Chauchat et al. (2013) with other static particle pressure models can be found in section 5.2.
Particle stresses The particle stresses , 2 (2006) and Jop et al. (2006).
are obtained from the model of Pouliquen et al.
,
,
,
,
(C‐ 8)
.
In order to avoid divisions by zero, the shear rate γ is computed as γ max 2 : ,1 ∙ 10 . The friction coefficient is given by:
,
, , ,
(C‐ 9)
,
, ,
.
Here, the static friction coefficient is given by friction coefficient is given by 30° and
20° , and the dynamic 0.279.
Appendices
191
9 ACKNOWLEDGEMENTS The work carried out in this project was carried out in the programme ‘Maritiem Innovatie Programma’, project number MAR 08009, supported by Royal IHC Merwede and Rijksdienst voor Ondernemend Nederland (previously called AgentschapNL) in cooperation with MTI Holland B.V. and TU Delft. I would like to thank the supporters for giving the opportunity to carry out this research. I would like to thank my supervisor and co‐promotor Niels Kruyt for his guidance, help and ideas during the project. You invested a lot of time in this project and I like to thank you for that. Also I would like to thank my promotor Harry Hoeijmakers for his support. Your detailed revisions of my work during my project helped me a lot. I would like to thank everybody from the EFD group for their collegiality. I will retain good memories of some nice discussions with the mensa lunch crew. I would like to thank my family for their support throughout the years. Last but not least, I would like to thank Maria for her love, support and patience.
Acknowledgements
193