1 2 3
0F1F2FPREDICTING THE DIVERSION LENGTH OF CAPILLARY BARRIERS USING STEADY STATE AND TRANSIENT STATE NUMERICAL MODELING: CASE STUDY OF THE SAINT-TITE-DES-CAPS LANDFILL FINAL COVER
4
Benoit Lacroix Vachon1, Amir M. Abdolahzadeh2, and Alexandre R. Cabral3*
5 Abstract:
7
Covers with capillary barrier effect (CCBE) have already been proposed to meet regulatory
8
requirements for landfill final covers. Modeling of CCBE may be a relatively complex and time
9
consuming task. Simpler, albeit conservative, design tools – such as steady state numerical
10
analyses – can be, in certain cases, justifiable and have a positive impact in the practice. In this
11
study, we performed numerical simulations of the experimental CCBE constructed on the Saint-
12
Tite-des-Caps landfill (Quebec). The CCBE consists of a capillary barrier, composed of sand and
13
gravel, on top of which a layer of deinking by-products (DBP) was installed as a protective layer
14
(also to control seepage). The addition of a protective layer over the infiltration control layer
15
(such as a capillary barrier) is required nearly everywhere. In many European countries, such as
16
Germany and the Netherlands, a thick “recultivation” layer is required. The results of numerical
17
simulations were compared to the in situ behaviour of the Saint-Tite CCBE as well as to
18
analytical solutions. The effectiveness of the capillary barrier was assessed by quantifying the
19
diversion length (DL), which reflects the lateral drainage capacity of the CCBE, i.e. the capacity
20
to drain water laterally. The latter, if collected, prevents seepage into the waste mass. This study
ed pt
ce
Ac
6
n io rs
ve
1
P.Eng, M.Sc.A. Groupe Qualitas inc., member of the SNC-LAVALIN group, Montreal, QC, Canada. Formerly with the Department of Civil Engineering, Université de Sherbrooke. P.Eng., Ph.D. AECOM, Montreal, QC, Canada. Formerly with the Department of Civil Engineering., Université de Sherbrooke. 3 Department of Civil Engineering, Faculty of Engineering, Université de Sherbrooke, 2500, boul. de l’Université, Sherbrooke, QC J1K 2R1, Canada. * Corresponding author: A.R. Cabral (
[email protected]). 2
1
21
shows that, when the seepage rate reaching the top layer of the capillary barrier is controlled, it is
22
possible to predict the worst case scenario in terms of seepage (and therefore predict the shortest
23
DL) using steady state numerical simulations. These simpler-to-perform numerical simulations
24
could be adopted, at least in a pre-feasibility study for cases with a similar profile as the one at
25
the Saint-Tite-des-Caps experimental CCBE.
26 27
Key words: Landfills, Deinking by-products, Final covers, Alternative cover design.
29
ce
Ac
28
Résumé :
31
Des recouvrements avec effet de barrière capillaire (CCBE) ont déjà été proposés pour répondre
32
aux exigences législatives des recouvrements finaux des sites d’enfouissement. La modélisation
33
d’une CCBE est une tâche relativement complexe et qui peut demander du temps. La possibilité
34
d’effectuer des modélisations numériques plus simples, comme les analyses en régime
35
permanent, tout en offrant une solution conservatrice et éprouvée, pourrait avoir un impact
36
positif dans la pratique. Dans la présente étude, des simulations numériques de la CCBE
37
expérimentale installée au site d’enfouissement de Saint-Tite-des-Caps (Québec) ont été
38
réalisées. La CCBE est constituée d’une barrière capillaire, composée de sable et de gravier, au-
39
dessus de laquelle une couche de sous-produits de désencrage (DBP) a été installée. Cette
40
dernière agissait comme couche de protection et de contrôle des infiltrations. L’ajout d’une
41
couche de protection au-dessus de la barrière capillaire est généralement exigé dans les
42
règlements concernant l’enfouissement de matières résiduelles. Dans certains pays européens,
43
dont l’Allemagne et Les Pays-Bas, on exige une couche épaisse dénommée « recultivation
ed pt
30
n io rs
ve
2
layer ». Les résultats des simulations numériques sont comparés au comportement in situ de la
45
CCBE ainsi qu’à certaines solutions analytiques. L’efficacité de la barrière capillaire a été
46
évaluée en quantifiant la longueur de transfert (DL), qui reflète la capacité de drainage latérale de
47
la CCBE. L’eau drainée latéralement doit être captée, évitant ainsi sa percolation vers la masse
48
de déchets. La présente étude démontre que, lorsqu’on contrôle le débit de percolation atteignant
49
la couche supérieure de la barrière capillaire, il est possible de prédire le pire scénario
50
d’infiltration (et donc de prédire la DL la plus courte) par le biais de simulations numériques en
51
régime permanent. Ces simulations numériques plus simples à réaliser pourraient être adoptées,
52
du moins dans le cadre d’une étude de préfaisabilité pour des cas ayant un profil semblable à
53
celui du recouvrement final de la plateforme expérimentale de Saint-Tite-des-Caps.
ce
Ac
44
ed pt
54 55
Mots-clés : Lieux d’enfouissement sanitaire, sous-produit de désencrage, barrière capillaire,
56
recouvrement final, recouvrement alternatif.
ve
57
n io rs
3
1
Introduction
59
Covers with capillary barrier effect (CCBE) have been proposed as an alternative final cover
60
system for mine residues and waste disposal facilities (Stormont, 1996; Barth and Wohnlich,
61
1999; Morris and Stormont, 1999; von Der Hude et al., 1999; Khire et al., 2000; Bussière et al.,
62
2003; Kämpf et al., 2003; Wawra and Holfelder, 2003; Aubertin et al., 2006). Regulatory
63
requirements in countries such as Germany and the Netherlands include the addition of a thick
64
layer (“recultivation layer”) overlying the capillary barrier (e.g. Giurgea et al., 2003; Hupe et al.,
65
2003) in final covers for solid waste landfills. Relatively fine-textured soils can be employed and
66
therefore become a seepage control layer.
ce
Ac
58
ed pt
67
In inclined CCBE, the moisture retaining layer (MRL) diverts (or drains) the rainfall that seeps
69
through the top-most layers of the cover system downslope. The maximum lateral flow the MRL
70
can divert, the diversion capacity (Qmax), is attained at a critical zone along the interface called
71
the breakthrough zone. Beyond this zone, capillary forces no longer retain the accumulated water
72
within the MRL; in other words, moisture starts to infiltrate into the capillary break layer (CBL).
73
This transfer of water becomes more accentuated at the diversion length, DL (Ross, 1990), where
74
the downward flow into the CBL (and ultimately into the waste mass) reaches a value equal to
75
the seepage flow rate.
n io rs
ve
68
76 77
The fundamental design parameters for a CCBE system and the determination of its associated
78
DL are the hydraulic conductivity functions – often derived from the water retention curves
79
(WRC) - of the various layer materials, slope of the cover system, length of the slope, climatic
80
conditions and allowable seepage flow rate. Several authors have discussed how the water 4
81
storage and lateral diversion capacity of a capillary barrier is affected by factors such as the
82
material properties and thickness, cover configuration, slope of the interface, and climatic
83
conditions (Morris and Stormont, 1998; Zhan et al., 2001; Tami et al., 2004; Parent and Cabral,
84
2006; Yanful et al., 2006; Aubertin et al., 2009).
85 Depending on climatic conditions, the amount of precipitation that infiltrates through the surface
87
may exceed the water storage capacity of the MRL and the diversion capacity of the CCBE,
88
thereby limiting lateral drainage within the MRL and hence reducing the diversion length.
89
Abdolahzadeh et al. (2011a; 2011b) suggested adding a seepage control layer on top of the MRL
90
in order to limit the seepage flow rate to a maximum equal to the saturated hydraulic
91
conductivity of the seepage control layer. It needs, nonetheless, to be acknowledged that the
92
maximum flow rate may be dictated by the presence of cracks within the seepage control layer.
ed pt
ce
Ac
86
93
ve
In this study, transient state numerical simulations were performed based on the experimental
95
CCBE constructed on the Saint-Tite-des-Caps landfill (Lacroix Vachon et al., 2007;
96
Abdolahzadeh et al., 2008; Abdolahzadeh et al., 2011a; Abdolahzadeh et al., 2011b). The results
97
of the numerical simulations under transient state were compared to the response of the
98
experimental CCBE for a typical year (Abdolahzadeh et al., 2011a; Abdolahzadeh et al., 2011b),
99
to the results obtained by steady state numerical simulations, to the results obtained using a well-
100
known analytical solution (Ross, 1990), and to the results obtained using an adaptation of the
101
latter (Parent and Cabral, 2006).
n io rs
94
102
5
Transient-state numerical simulations better define the behaviour of a CCBE and therefore
104
constitute a more precise design tool. This is partly attributed to the fact that the precipitation
105
rate changes continuously, thus the seepage flow rate reaching the top of the CCBE and the
106
suctions at the interface between the MRL and CBL change accordingly. As a consequence, it is
107
expected that the diversion length varies continuously and the design process needs to consider
108
these naturally-occurring variations. Despite this fact, the results reported in this paper show that
109
when the seepage flow rate level can be controlled, a steady state analysis can predict the worst-
110
case scenario in terms of diversion length, and can therefore be considered at least for the pre-
111
design (feasibility) phase of a project.
ce
Ac
103
112
2
114
Materials and Methods 2.1
ed pt
113
Composition of the materials
ve
The longitudinal profile of the 10-m wide and 30-m long experimental cover installed at the
116
Saint-Tite-des-Caps landfill site was presented by Abdolahzadeh et al. (2011a), who describe the
117
instrumentation installed in it. The upper layer, constructed with random fill, protects the lower
118
layers and is required by Quebec landfill regulations. The immediately underlying layer consists
119
of deinking by-products DBP (0.6 m) and forms a hydraulic barrier (or seepage control barrier).
120
The lower part of the experimental final cover includes a capillary barrier made up of a layer of
121
sand (0.4 m) superposed over a layer of gravel (0.2 m).
n io rs
115
122
6
The water retention curve of DBP (whose Gs = 2.0) was obtained using a pressure plate modified
124
by Parent (2006) to test highly compressible materials (Cabral et al., 2004; Parent et al., 2004;
125
Parent et al., 2007). The experimental results and a fitting curve using the Fredlund and Xing
126
(1994) model are presented in Figure 1. The corresponding Fredlund and Xing (1994) parameters
127
fitting curve and the saturated volumetric water content (θs) value for DBP are presented in
128
Table 1. The porosities (n) of all the materials are equal to their saturated volumetric water
129
contents (θs in Table 1). The WRCs of the sand (Gs=2.65) and gravel (Gs=2.65) were obtained
130
by means of drainage columns (Lacroix Vachon, 2008; Abdolahzadeh et al., 2011a).
Ac
123
131
ce
The van Genuchten model (1980) was selected as the regression model for the sand and gravel
133
(Figure 1a) and their corresponding van Genuchten parameters are presented in Table 1. Data for
134
the WRC of the waste was taken from the GeoStudio (Geo-Slope Int. Ltd., 2004) database. The
135
main hydraulic properties of the waste, including the van Genuchten (1980) corresponding
136
parameters, are also summarized in Table 1, which also presents the air entry values (ψAEV) and
137
water entry values (ψWEV) of most of the different materials employed. These values were
138
determined using the Brooks and Corey (1964) graphical method.
ed pt
132
n io rs
ve
139 140
The saturated hydraulic conductivity (ksat) of DBP is equal to 1.0 x 10⁻⁸ m/s, as obtained by
141
Bédard (2005), Burnotte et al. (2000) and Planchet (2001). The saturated hydraulic conductivity
142
of the sand, 1.5 x 10⁻⁴ m/s, was estimated using the Hazen (1911) formula, with a cross-check
143
using the neural network in the RETC code (van Genuchten et al., 1991). For the gravel, the ksat
144
(1.5 x 10⁻³ m/s) was also estimated with the Hazen (1911) formula, with a cross-check using the
145
Chapuis (2004) method. The ksat values are presented in Table 1. The k-fct of the sand, gravel
7
146
and waste, shown in Figure 1b, were obtained using the van Genuchten (1980) model, based on
147
the Mualem (1976) formulation.
148 In the present study, the effect of hysteresis of the WRC was not considered; only the drying
150
curve was used. Zhang et al. (2009) showed that pore water pressure distributions in modeled
151
capillary barriers, as well as the DL location, are influenced by whether or not hysteresis is
152
considered. While it can be important for fine sands, an investigation performed by Maqsoud et
153
al. (2004) showed that for coarse-grained materials, this effect is much less important.
Ac
149
154
ce
155
ed pt
156 157
Table 1: Hydraulic properties of the materials used in numerical simulations of the Saint-Titedes-Caps experimental CCBE.
158
ve
159 160
Figure 1: a) Water retention curve (WRC); and b) k-fct of the materials used in numerical simulations.
n io rs
161 162 163
2.2
Analytical solutions and numerical modeling
164
2.2.1
165
Various equations can be used to evaluate the DL, such as those proposed by Ross (1990),
166
Steenhuis et al. (1991), Morel-Seytoux (1994) and Walter et al. (2000). Ross (1990) developed
167
analytical relationships for the DL and Qmax of a capillary barrier and applied equations based on
168
constant infiltration into the fine layer and semi-infinite layers of soil. According to the Ross
8
Analytical solutions
169
(1990) model, water that accumulates at the interface between the MRL and the CBL only starts
170
to flow down when suction reaches a critical value. Steenhuis et al. (1991) suggested that the
171
. This critical suction value can be considered the water entry value (WEV) of the CBL, i.e. ψ𝐶𝐶𝐶 𝑊𝑊𝑊
172
parameter corresponds to the suction value at which the downward flow into the CBL (qd)
173
becomes equal to the seepage flow rate (q). Various studies have shown that the critical suction
174
value definition suggested by Steenhuis et al. (1991) is more widely retained (Walter et al., 2000;
175
Bussière et al., 2002; Nakafusa et al., 2012).
Ac
176
Based on the Ross (1990) model, the critical suction value is the suction at which the k-fcts of the
178
MRL and CBL intersect. According to this analytical solution, the fine-grained material drains
179
all the water down to the point where the critical suction value is attained. Abdolahzadeh et al.
180
(2011b; 2011a), Parent and Cabral (2006), among others, presented evidence – based on field
181
data and numerical simulations - that the downward flow into the CBL occurs gradually, often in
182
a sigmoidal manner with distance. Considering this, Parent and Cabral (2006) developed a
183
methodology based on the Ross (1990) model and proposed an empirical equation to quantify
184
seepage flow into the CBL, taking into consideration a progressive downward flow into the
185
coarse-grained material.
ed pt
ce
177
n io rs
ve
186 187
2.2.2
Numerical simulations
188 189
Numerical modeling of the Saint-Tite-des-Caps CCBE was performed in two distinct steps. In
190
the first, the hydrological behaviour of the first two layers was investigated using Visual HELP
191
(v. 2.2.03; Schlumberger Water Services), which considers the climate-dependent processes of 9
192
precipitation, evapotranspiration and runoff. Visual HELP simulated the annual percolation rates
193
reaching the top of the sand/gravel capillary barrier. In the second step, the unsaturated flow
194
through the CCBE was simulated using SEEP/W (v. 2007; Geo-Slope Int. Ltd.). The simulated
195
annual percolation rates obtained by Visual HELP were introduced in SEEP/W as an upper
196
hydraulic boundary condition, for transient numerical simulations. For the steady state numerical
197
simulation, the percolation rate value was fixed at 1 x 10⁻⁸ m/s, i.e. the ksat of DBP.
198 2.2.3
Ac
199
Seepage flow rate reaching the capillary barrier: role of the seepage control layer
ce
200
Abdolahzadeh et al. (2011a) analyzed field data from Saint-Tite-des-Caps experimental CCBE
202
and found that the DBP layer diverts water laterally over a very short distance (less than 2.6 m),
203
remaining saturated most of the time and along almost the entire length of the CCBE.
204
Consequently, the DBP layer controls the amount of seepage reaching the sand/gravel capillary
205
barrier. In order to evaluate this amount of seepage, the software Visual Help was used. Climatic
206
data was obtained using a weather station (Vantage Pro; Davis Instruments) and was completed
207
using the Visual HELP database (data from Quebec City). The main input data for the Visual
208
HELP simulations are summarized in Table 2. A 5% slope was assigned to the model. The field
209
capacity and wilting point moisture content input parameters, which are used to define moisture
210
storage and unsaturated hydraulic conductivity, were obtained using the WRC. In all unsaturated
211
layers, the initial moisture content was assumed equal to the wilting point value (Webb, 1997).
212
Based on the results obtained from the Visual HELP simulations, the median year was adopted
213
as typical year.
ed pt
201
n io rs
ve
214 10
215 216
Table 2: Summary of HELP simulations input.
217 218
2.2.4
Geometry and boundary conditions of the capillary barrier model
219 Only the capillary barrier system consisting of sand and gravel that superimposes a layer of
221
typical municipal solid waste was modelled in the present study. Given the fact that the DBP
222
remained saturated at its base, a seepage boundary condition at the top of the sand layer was
223
considered. The geometry and dimensions for the slightly inclined capillary barrier modelled
224
herein are illustrated in Figure 2. The arbitrary thickness of the waste layer (0.5 m) was of little
225
importance in the final results, given the coarse nature of this layer; i.e. the waste was not able to
226
transmit any significant suction to the gravel layer, given the simulated seepage flow rate. The
227
mesh density was adapted to improve the solution accuracy in critical zones, particularly at the
228
sand-gravel interface (Chapuis, 2012). As it can be observed in Figure 2, various mesh densities
229
were adopted. The vertical thickness of the elements near the sand-gravel interface and waste
230
layer were 0.09 m and 0.25 m respectively. The horizontal length of the elements was similar
231
throughout the model. A zero seepage horizontal flow was adopted at the upstream vertical
232
boundary, which corresponds to the reality of the field experiment. A rectangular form was
233
considered because it helped to achieve numerical stability. To avoid boundary effects on the
234
right side of the model, the toe of the capillary barrier model was extended up to 200.0 m
235
horizontally (Figure 2).
ed pt
ce
Ac
220
n io rs
ve
236
11
Three types of boundary conditions were used to simulate the Saint-Tite-des-Caps CCBE and are
238
illustrated in Figure 2. At the downstream end of the model, two drains were located in the sand
239
and gravel layers. These drainage outlets were simulated by applying a unit hydraulic gradient
240
boundary. The physical meaning of this boundary condition was that the seepage flow rate that
241
passed through the drainage outlet boundary at a given suction value was equal to the coefficient
242
of permeability of the soil corresponding to that suction value (Tami et al., 2004). The water
243
table was placed at the base of the waste layer, at a depth of 110 cm from the ground surface
244
layer. A zero pressure boundary condition was imposed, representing the worst case (in fact,
245
virtually impossible) scenario. It is assumed that maximum suction the wastes can transmit to the
246
CBL is low enough so that the suction at the CBL-MRL interface is not affected by it.
247
Accordingly, the shape of the WRC of the wastes does not affect the behaviour of the capillary
248
barrier.
249
ed pt
ce
Ac
237
ve
For the transient analysis, the initial pressure head at each node was obtained from the steady
251
state simulation. The behaviour of the capillary barrier model was analyzed using wet initial
252
conditions. This was considered as the worst condition, insofar as the capillary barrier model had
253
a low storage capacity.
n io rs
250
254 255 256 257
Figure 2: Basic model, geometry, dimensions, and boundary conditions of the Saint-Tite-desCaps CCBE.
12
258 259
3
260
Results 3.1
Potential seepage flow rates
Lysimeters were installed in the sand layer to monitor the maximum amounts of water entering
262
the sand/gravel capillary barrier for several years. A verification of their functionality was
263
performed by Abdolahzadeh et al. (2011b), who concluded that, except for short periods of time,
264
the lysimeters performed properly, i.e. suctions were equal to zero at the base and, at the top,
265
their values were the same inside and immediately on the outside; in other words, there were no
266
differences in total heads that could cause deviation or concentration of flow. As can be seen in
267
Figure 3, field observations clearly indicated that the maximum seepage flow rate throughout
268
2006 (adopted year) did not exceed 1.0 x 10⁻⁸ m/s, i.e. the ksat of DBP.
ed pt
ce
Ac
261
ve
269 270
n io rs
271 272 273 274
Figure 3: Evolution of seepage flow rates reaching the top of the sand/gravel capillary barrier by lysimeters installed in the sand layer at the Saint-Tite-des-Caps experimental CCBE, for year 2006 (adapted from Abdolahzadeh et al., 2008).
275 276
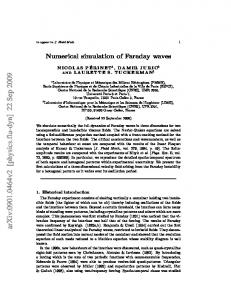
The results of the Visual HELP simulations are presented in Figure 4 for a typical simulated
277
year. Seepage rate values equal to 1.9 x 10⁻⁸ m/s were sometimes obtained by the modeling
278
process. Since they were not corroborated by field observations (Figure 3), seepage values
279
greater than 1.0 x 10⁻⁸ m/s were set to 1.0 x 10⁻⁸ m/s. The seepage flow rates adopted as the
13
280
upper boundary condition for the unsaturated flow simulations under transient state are indicated
281
in Figure 4.
282 283 284
Figure 4: Visual HELP modeling results of the seepage flow rates through the DBP layer during a typical year.
285 286
3.2
Unsaturated flow simulations to determine DL
Ac
One of the goals of the numerical simulations was to estimate the approximate location of the
288
diversion length along the sand/gravel capillary barrier. For practical purposes, instead of a
289
region, the DL is associated herein with a precise distance from the top of the slope. The DL is
290
located where the suction along the sand/gravel interface reaches the critical suction value ψWEV
291
of the CBL (Steenhuis et al., 1991). From this location downslope, the suction at the interface
292
tended to stabilize. In the present study, the diversion length was evaluated using 5 different
293
approaches: 1) field data gathered from the Saint-Tite-des-Caps experimental CCBE; 2) a steady
294
state numerical simulation; 3) a transient-state numerical simulation; 4) the Ross (1990)
295
analytical model; and 5) the Parent and Cabral (2006) analytical model.
ed pt
ce
287
n io rs
ve
296 297
During the spring and summer of 2006, the DL at the Saint-Tite-des-Caps experimental CCBE
298
was evaluated based on lysimeter, tensiometer and water content data. According to
299
Abdolahzadeh et al. (2011b), the DL was located between 23.0 and 29.0 m (Figure 5). As
300
observed by Abdolahzadeh et al. (2011a), suction values did stabilize downslope from the
301
approximate DL region.
302
14
303
The seepage flow rates obtained from the transient and steady state analyses are also presented in
304
Figure 5. It can be observed that when the flow rate value falls below 1.0 x 10⁻⁸ m/s, the DL
305
given by the transient analysis increased accordingly. The lowest DL value obtained from the
306
transient analysis was equal to the value obtained from the steady state analysis (DL = 19.0 m).
307 For the sake of comparison, the DL obtained using the Ross (1990) and Parent and Cabral (2006)
309
models are also included in Figure 5. The Parent and Cabral (2006) model, with a DL=20.0 m,
310
compared very well with the steady state DL, while the Ross (1990) model gave a very
311
conservative DL value equal to 16.0 m. The very conservative nature of the DL by the Ross
312
model results in part from the fact that this model is based on an “all-or-nothing” type of
313
approach when it comes to determining the transfer capacity of the MRL and the diversion
314
length.
315
ed pt
ce
Ac
308
ve
In concluding, the lowest value of DL from the transient state analysis was equal to the DL
317
obtained by modeling the CCBE under steady state and this value was quite close to what was
318
actually observed in the field for the typical year analyzed. It is therefore tempting to conclude
319
that steady state analyses could be a practical and effective choice for the design of CCBEs.
320
Indeed, this can be the case under the following circumstances: when a CCBE is designed to
321
minimize water infiltration and when a low permeability layer is installed above the MRL as a
322
means to control the maximum seepage reaching it. Therefore, the maximum seepage flow
323
reaching the MRL is equal to the ksat of the seepage control layer. Zhang et al. (2004) observed
324
that in order to maintain negative pore-water pressure values in a slope, it is important to reduce
325
the infiltration flux through the use of a suitable type of cover system at the ground surface. Lim
n io rs
316
15
326
et al. (1996) carried out a field instrumentation program to monitor negative pore-water pressure
327
values in residual soil slopes in Singapore that were protected by different types of surface
328
covers. The changes in matric suction due to changes in ground surface moisture flux were found
329
to be least significant under a canvas-covered slope and most significant in a bare slope. Several
330
relatively impermeable surface covers can be adopted.
331 332
Ac
Figure 5: Evolution of the diversion length, as a function of the seepage flow rate (modified Visual HELP results, indicated as “adopted”; see Figure 4) and evolution of DL obtained by transient and, steady state analysis, as well as by using the Parent and Cabral (2006) and Ross (1990) models.
ce
333 334 335 336 337
ed pt
The level of confidence associated with the DL values obtained is intimately related to the level
339
of confidence associated with the properties of the materials, the boundary conditions and initial
340
conditions imposed on the model. It is therefore noteworthy that the DL obtained perfectly
341
corroborates what was obtained by Abdolazadeh et al. (2011a) using lysimeter and tensiometer
342
data. The accurateness of the material’s properties was assessed by Abdolahzadeh et al. (2011b).
343 344
4
345
The design of CCBE is complex due to its transient behaviour, and several studies conclude that
346
numerical simulations under transient states may better define the response of CCBE than those
347
obtained from steady-state numerical or analytical solutions. Nevertheless, steady state solutions
348
(numerical or analytical), associated with simplified assumptions and combined with particular
16
Conclusion
n io rs
ve
338
349
boundary conditions, may allow engineers to make reasonable predictions using simple tools,
350
thereby circumventing the difficulties and time involved to model a system under transient state.
351 The most important result of the research reported in this paper is that the DL obtained under
353
steady state coincided with the worst-case scenario (in terms of diversion length) predicted by
354
transient analysis, for the particular conditions of the Saint-Tite-des-Caps experimental CCBE.
355
And it is relevant to note that the predicted DL was confirmed by field data. The present study
356
concluded that steady state numerical analysis or an analytical solution such as Parent and Cabral
357
(2006) predicts a conservative diversion length and, therefore, it is possible to use them during
358
the preliminary design phase of a cover system that controls seepage into the waste mass.
ce
Ac
352
ed pt
359 360
Acknowledgements
361
ve
Funding for this study was provided by Cascades Inc. and the Natural Sciences and Engineering
363
Research Council (NSERC) (Canada) under the University–Industry Partnership grant number
364
CRD 192179 and by NSERC under the second author’s Discovery Grant. The authors also
365
acknowledge help provided by Jean-Guy Lemelin, in the design of the experimental cells,
366
installation of the measuring system and actual testing.
n io rs
362
367 368
References
369
17
370
Abdolahzadeh, A.M., Lacroix Vachon, B. and Cabral, A.R. (2008). Hydraulic barrier and its
371
impact on the performance of cover with double capillary barrier effect In 61st Canadian
372
Geotechnical Conference. Edmonton. 21-24 Sept., CD-Rom.
373
Abdolahzadeh, A.M., Vachon, B.L. and Cabral, A.R. (2011a). Evaluation of the effectiveness of
374
a cover with capillary barrier effect to control percolation into a waste disposal facility.
375
Canadian Geotechnical Journal, 48(7), 996-1009. Abdolahzadeh, A.M., Vachon, B.L. and Cabral, A.R. (2011b). Assessment of the design of an
377
experimental cover with capillary barrier effect using 4 years of field data. Geotechnical
378
and Geological Engineering, 29(5), 783-802.
ce
Ac
376
Aubertin, M., Cifuentes, E., Apithy, S.A., Bussière, B., Molson, J. and Chapuis, R.P. (2009).
380
Analyses of water diversion along inclined covers with capillary barrier effects.
381
Canadian Geotechnical Journal, 46(10), 1146-1164.
ed pt
379
Aubertin, M., Cifuentes, E., Martin, V., Apithy, S., Bussiere, B., Molson, J., Chapuis, R.P. and
383
Maqsoud, A. (2006). An investigation of factors that influence the water diversion
384
capacity of inclined covers with capillary barrier effects. Carefree, AZ, United States,
385
Geotechnical Special Publication 147, American Society of Civil Engineers, Reston, VA
386
20191-4400, United States, 613-624.
n io rs
ve
382
387
Barth, C. and Wohnlich, S. (1999). Proof of effectiveness of a capillary barrier as surface sealing
388
of sanitary landfill. In 7th International Waste Management and Landfill Symposium.
389
Edited by R. Cossu, R. Stegman, and T.H. Christensen. Sant Margarita di Pula, Italy,
390
389-392.
18
391
Bédard, D. (2005). Effet du fluage à long terme des sous-produits de désencrage dû à la perte de
392
masse et son effet sur la compression et la conductivité hydraulique. M.Sc.A Thesis,
393
Université de Sherbrooke, Sherbrooke, 166 p.
394
Brooks, R.H. and Corey, A.T. (1964). Hydraulic properties of porous media. Hydrology paper
395
no. 3, Colorado State University, Fort Collins, Colorado. Burnotte, F., Lefebvre, G., Cabral, A., Audet, C. and Veilleux, A. (2000). Use of deinking
397
residues for the final cover of a MSW landfill. In 53rd Canadian Geotechnical
398
Conference. Montreal. October 15-18, 2000, Vol. 1, 585-591.
Ac
396
Bussière, B., Aubertin, M. and Chapuis, R.P. (2002). A laboratory set up to evaluate the
400
hydraulic behavior of inclined capillary barriers. In International Conference on Physical
401
Modelling in Geotechnics. Edited by R. Phillips, P.J. Guo, and R. Popescu. St. John’s,
402
Newfoundland. July 2002, 391-396.
ed pt
ce
399
Bussière, B., Apithy, S., Aubertin, M. and Chapuis, R.P. (2003). Diversion capacity of sloping
404
covers with capillary barrier effect. In 56th Annual Canadian Geotechnical Conf., 4th Joint
405
IAH-CNC and CGS Groundwater Specialty Conf. & 2003 NAGS Conference, Winnipeg,
406
Canada, p. 8,
n io rs
ve
403
407
Cabral, A.R., Planchet, L., Marinho, F.A. and Lefebvre, G. (2004). Determination of the soil
408
water characteristic curve of highly compressible materials: case study of pulp and paper
409
by-product. Geot. Testing Journal, 27(2), 154-162.
410
Chapuis, R.P. (2004). Predicting the saturated hydraulic conductivity of sand and gravel using
411
effective diameter and void ratio. Canadian Geotechnical Journal, 41(5), 787-795.
412
Chapuis, R.P. (2012). Influence of element size in numerical studies of seepage: unsaturated
413
zones, transient conditions. Geotechnical News, BiTech, Dec., 34-37 p.
19
414
Fredlund, D.G. and Xing, A.Q. (1994). Equations for the soil-water characteristic curve.
415
Canadian Geotechnical Journal, 31(4), 521-532.
416
Geo-Slope (2004). SEEP/W User's Manual,
417
Giurgea, V.I., Hötzl, H. and Breh, W. (2003). Studies on the long-term performance of an
418
alternative surface-sealing system with underlying capillary barrier In Sardinia 2003 - 9th
419
International Landfill Symposium. Edited by R. Cossu and R. Stegmann. St-Margarita di
420
Pula, Italy. Oct. 2003, CISA, Paper 307 - CD-Rom. Hazen, A. (1911). Discussion of “Dams on Sand Foundations" from A.C. Koening. ASCE, 73.
422
Hupe, K., Heyer, K.-U., Becker, J.F., Traore, O., Noetzel, S. and Stegmann, R. (2003).
423
Investigations of alternative landfill surface sealing systems in test fields In Sardinia
424
2003 - 9th International Landfill Symposium. Edited by R. Cossu and R. Stegmann. St-
425
Margarita di Pula, Italy. Oct. 2003, CISA, Paper 582 - CD-Rom.
ed pt
ce
426
Ac
421
Kämpf, M., Holfelder, T. and Montenegro, H. (2003). Identification and parameterization of
ve
427
flow processes in artificial capillary barriers. Water Resources Research, 39(10), 21-29. Khire, M.V., Benson, C.H. and Bosscher, P.J. (2000). Capillary barriers: Design variables and
429
water balance. Journal of Geotechnical and Geoenvironmental Engineering, 126(8), 695-
430
708.
n io rs
428
431
Lacroix Vachon, B. (2008). Les écoulements dans les milieux non saturés et leurs applications
432
aux couvertures avec effet de barrière capillaire installées dans un site d'enfouissement
433
sanitaire Dissertation Thesis, Université de Sherbrooke, Sherbrooke, 138 p.
434
Lacroix Vachon, B., El-Ghabi, B. and Cabral, A.R. (2007). Évaluation préliminaire de
435
l’efficacité du recouvrement avec double effet de barrière capillaire installé au site de St-
20
436
Tite-des-Caps, Qc. In 60th Canadian Geotechnical Conference. Ottawa. 21-24 Oct., Vol.
437
CD-Rom. Lim, T.T., Rahardjo, H., Chang, M.F. and Fredlund, D.G. (1996). Effect of rainfall on matric
439
suctions in a residual soil slope. Canadian Geotechnical Journal, 33(4), 618-628.
440
Maqsoud, A., Bussière, B. and Aubertin, M. (2004). Hysteresis effects on the water retention
441
curve: a comparison between laboratory results and predictive models. In 57th Canadian
442
Geotechnical Conference and the 5th Joint CGS-IAH Conference. Quebec City, Canada,
443
CGS, Vol. Session 3A, 8-15.
Ac
438
Morel-Seytoux, H.J. (1994). Steady-state effectiveness of a capillary barrier on a sloping
445
interface. In 14th Hydrology Days. Edited by H.J. Morel-Seytoux. Atherton, CA,
446
Hydrology Days Publications, 335-346.
ed pt
447
ce
444
Morris, C.E. and Stormont, J.C. (1998). Evaluation of numerical simulations of capillary barrier
448
field tests. Geotechnical and Geological Engineering, 16, 201-213.
ve
Morris, C.E. and Stormont, J.C. (1999). Parametric study of unsaturated drainage layers in a
450
capillary barrier. Journal of Geotechnical & Geoenvironmental Engineering, 125(12),
451
1057-1065.
452
n io rs
449
Mualem, Y. (1976). A new model for predicting the hydraulic conductivity of unsaturated porous
453
media. Water Resources Research, 12, 513-522.
454
Nakafusa, S., Kobayashi, K., Morii, T. and Takeshita, Y. (2012). Estimation of water diversion
455
provided by capillary barrier of soils. In 5th Asia-Pacific Conference on Unsaturated Soils
456
2012. Pattaya, Thailand. Feb. 29 - March 2, 2012, Geotechnical Engineering Research
457
and Development Center, Vol. 2, 643-647.
21
458
Parent, S.-É. (2006). Aspects hydrauliques et géotechniques de la conception de barrières
459
capillaires incluant des matériaux recyclés hautement compressibles. Dissertation/Thesis
460
Thesis, Université de Sherbrooke, Sherbrooke, 114 p.
461
Parent, S.-É. and Cabral, A.R. (2006). Design of inclined covers with capillary barrier effect.
462
Geotechnical and Geological Engineering Journal, 24, 689-710. Parent, S.-É., Cabral, A.R. and Zornberg, J.G. (2007). Water retention curves and hydraulic
464
conductivity functions of highly compressible materials. Canadian Geotechnical Journal,
465
44(10), 1200-1214.
Ac
463
Parent, S.-É., Cabral, A.R., Dell' Avanzi, E. and Zornberg, J.G. (2004). Determination of the
467
hydraulic conductivity function of a highly compressible material based on tests with
468
saturated samples. Geot. Testing Journal, 27(6), 1-5.
ed pt
ce
466
Planchet, L. (2001). Utilisation des résidus de désencrage comme barrière capillaire et
470
évapotranspirative (ET) pour les parcs à résidus miniers producteurs de DMA Thesis,
471
Université de Sherbrooke, Sherbrooke, 114 p.
Ross, B. (1990). Diversion capacity of capillary barriers. Water Resources Research, 26(10),
473
2625-2629.
n io rs
472
ve
469
474
Steenhuis, T.S., Parlange, J.Y. and Kung, K.J.S. (1991). Comment on 'the diversion capacity of
475
capillary barriers' by Benjamin Ross (paper 91WR01366). Water Resources Research,
476
27(8), 2155.
477
Stormont, J.C. (1996). The effectiveness of two capillary barriers on a 10% slope. Geotechnical
478
and Geological Engineering Journal, 14, 243-267.
22
479
Tami, D., Rahardjo, H., Leong, E.C. and Fredlund, D.G. (2004). Design and laboratory
480
verification of a physical model of sloping capillary barrier. Canadian Geotechnical
481
Journal, 41, 814 - 830.
482
van Genuchten, M.T. (1980). A closed-form equation for predicting the hydraulic conductivity of
483
unsaturated soils. Soil Science Society of America Journal, 44, 892-898. van Genuchten, M.T., Leij, F.J. and Yates, S.R. (1991). The RETC code for quantifying the
485
hydraulic functions of unsaturated soils. In: (eds), Report EPA/600/2-91/065, U.S.
486
Department of Agriculture, Agriculture Research Service p.
Ac
484
von Der Hude, N., Melchior, S. and Möckel, S. (1999). Construction of a capillary barrier in the
488
cover of the Breinermoor landfill. In Seventh International Waste Management and
489
Landfill Symposium. Edited by T.H. Christensen, R. Cossu, and R. Stegmann. Sta
490
Margarita di Pula, Italy, CISA, 393-402.
ed pt
ce
487
Walter, M.T., Kim, J.S., Steenhuis, T.S., Parlange, J.Y., Heilig, A., Braddock, R.D., Selker, J.S.
492
and Boll, J. (2000). Funneled flow mechanisms in a sloping layered soil: Laboratory
493
investigation. Water Resources Research, 36(4), 841-849.
n io rs
ve
491
494
Wawra, B. and Holfelder, T. (2003). Development of a landfill cover with capillary barrier for
495
methane oxidation - the capillary barrier as gas distribution layer. In 9th Int. Waste Mgmt
496
and Landfill Symp. Italy. October 6-10, 2003, Paper 348.
497
Webb, S.W. (1997). Generalization of Ross Tilted Capillary Barrier Diversion Formula for
498
Different Two-Phase Characteristic Curves. Water Resources Research, 33(8), 1855-
499
1859.
500
Yanful, E.K., Mousavi, M. and De Souza, L.P. (2006). A numerical study of soil cover
501
performance. Journal of Environmental Management, 81, 72–92.
23
502
Zhan, G., Mayer, A., McMullen, J. and Aubertin, M. (2001). Slope effect study on the capillary
503
cover design for a spent leach pad. In 8th International Conference Tailings and Mine
504
Waste '01. Colorado State University, Forth Collins, Co., Balkema, 179-187.
505
Zhang, L.L., Fredlund, D.G., Zhang, L.M. and Tang, W.H. (2004). Numerical study of soil
506
conditions under which matric suction can be maintained. Canadian Geotechnical
507
Journal, 41, 569–582.
508
Zhang, Q., Werner, A., Aviyanto, R. and Hutson, J. (2009). Influence of soil moisture hysteresis on the functioning of capillary barriers. Hydrological Processes, 23, 1369-1375.
Ac
509 510
ce
511
ed pt n io rs
ve
24
Tables
Table 1: Hydraulic properties of the materials used in numerical simulations of the Saint-Titedes-Caps experimental CCBE. Parameters WRC's model n m
(3)
Sand
(1)
(2)
FX
α (3) (4) (3)
DBP
vG
Gravel vG
Waste
(2)
vG (2)
45.5
0.472
1.953
0.38
1.42
6.32
4.20
1.47
0.876
0.842
0.762
0.32
(5)
2000
n/a
n/a
n/a
θs (m3/m3)
0.77
0.33
0.35
0.30
θr (m3/m3)
n/a
0.05
0.07
0.01
ksat (m/s) (6)
1x10⁻⁸
1.5x10⁻⁴
1.5x10⁻³
1.0x10⁻⁵
ψAEV (kPa) (7)
~ 14
~ 1.4
~ 0.4
~ 2.6
~ 3.5
(9)
~ 200
Cr (kPa)
ce
Ac
---
ed pt
ψWEV (kPa)
(8)
1.7
n io rs
ve
Note: (1) FX: Fredlund and Xing (1994); (2) vG: van Genuchten (1980); (3) α, n, m are van Genuchten (1980) parameters; (4) 1/kPa for van Genuchten model, kPa for Fredlund and Xing model; (5) Cr: in Fredlund and Xing (1994) model, this parameter is a constant derived from the residual suction, i.e. the tendency to the null water content; (6) ksat is saturated hydraulic conductivity; (7) ψAEV is the suction value at air entry value; (8) ψWEV is the suction value at water entry value; (9) Rounded value.
25
Table 2: Summary of HELP simulations input. Thickness (m)
Loamy fine sand
0.6
DBP
0.6
Properties Top soil (protection layer) Barrier soil (seepage control layer)
HELP layer type
Total porosity (vol/vol)
Vertical percolation
Barrier soil liner
Field capacity (vol/vol)
Wilting point (vol/vol)
ksat (m/s)
Subsurface inflow (mm/year)
0.453
0.19
0.085
7.2 x 10⁻⁶
0
0.775
0.71
0.231
1.0 x 10⁻⁸
d te ep
c Ac
Layer
n io rs
ve
26
0
Figures
0,7
DBP: Experimental data
(a) DBP: Fredlund and Xing's (1994) model
Fredlund and Xing's (1994) extrapolation
0,6 Sand: Experimental datacolumn test
0,5
Sand: van Genuchten's (1980) model, Column test
0,4 0,3
0 1E+0
Gravel: Experimental datacolumn test
ed pt
0,1
1E-1
Gravel: van Genuchten's (1980) model, Adopted WRC
ce
0,2
Ac
Volumetric water content,θ (m3/m3)
0,8
1E+1
1E+2
1E+3
1E+4
1E+5
Waste date - GeoStudio (2004) database
n io rs
ve
Suction, Ψ (kPa)
Waste GeoStudio (2004) database: van Genuchten's (1980) model
27
1 E-02
(b) DBP
1 E-06 1 E-08
Sand
1 E-10 1 E-12 Gravel
1 E-14
Waste
ed pt
1 E-18 1E-1
ce
1 E-16
Ac
Hydraulic conductivity (m/s)
1 E-04
1E+0
1E+1
1E+2
1E+3
Suction,Ψ (kPa)
simulations.
n io rs
ve
Figure 1: a) Water retention curve (WRC); and b) k-fct of the materials used in numerical
28
ed pt
ce
Ac Caps CCBE.
n io rs
ve
Figure 2: Basic model, geometry, dimensions, and boundary conditions of the Saint-Tite-des-
29
d te ep
c Ac n io rs
ve Figure 3: Evolution of seepage flow rates reaching the top of the sand/gravel capillary barrier by lysimeters installed in the sand layer at the Saint-Tite-des-Caps experimental CCBE, for year 2006 (adapted from Abdolahzadeh et al., 2008).
30
Adopted simulated year by Visual HELP Adopted seepage flow rate (maximum value correspond to field observation, see Figure 3)
ve
Seepage flow rate, q (m/s)'
d te ep
c Ac
2.0E-08 1.9E-08 1.8E-08 1.7E-08 1.6E-08 1.5E-08 1.4E-08 1.3E-08 1.2E-08 1.1E-08 1.0E-08 9.0E-09 8.0E-09 7.0E-09 6.0E-09 5.0E-09 4.0E-09 3.0E-09 2.0E-09 1.0E-09 0.0E+00
0
60
n io rs
Saturated hydraulic conductivity of the DBP
120
180
240
300
360
Time (days) Figure
4:
Visual
layer during a typical year.
31
HELP
modeling
results
of
the
seepage
flow
rates
through
the
DBP
d te ep
c Ac n io rs
ve Figure 5: Evolution of the diversion length, as a function of the seepage flow rate (modified Visual HELP results, indicated as “adopted”; see Figure 4) and evolution of DL obtained by transient and, steady state analysis, as well as by using the Parent and Cabral (2006) and Ross (1990) models.
32