Assoc., 11, 1261â1271. 482. Bird, R.B., Stewort, W.E., and Lightfoot, E.N., Transport phenomena. ... Gordon and Breach, New York. 519. 1997) pp. 223â272. 520.
Solid Earth Discuss., doi:10.5194/se-2016-12, 2016 Manuscript under review for journal Solid Earth Published: 15 February 2016 c Author(s) 2016. CC-BY 3.0 License.
1 2
Numerical simulation of mantle convection using a temperature dependent nonlinear viscoelastic model
3
By M. Norouzi*,1, M. Sheibi2 and M. Mahmoudi3
4 5 6 7
1, 3
Mechanical Engineering Department, Shahrood University of Technology, Shahrood, Iran 2 Earth Science Faculty, Shahrood University of Technology, Shahrood, Iran
8
ABSTRACT
9
In the present article, the mantle convection is simulated numerically using a
10
temperature dependent non-linear viscoelastic model for the first time. The numerical
11
domain of problem is considered as a 4000km*2000km rectangular box and the CFD
12
simulation is performed using finite volume method. Unlike the previous works which
13
had been investigated the mantle convection using the linear viscoelastic models or
14
simple nonlinear inelastic viscous equations (such as power law or cross equations), it is
15
solved via the nonlinear Giesekus constitutive equation. Because of large-scale creeping
16
flow in geometry and time, it is shown that the results of Giesekus equation are more
17
reliable for this problem. The main innovative aspects of current study is investigation
18
of temperature dependency of rheological properties of mantle including viscosity,
19
normal stress differences and relaxation time using appropriate equations of state. The
20
variation of gravitational acceleration with depth of Earth and the effect of the work of
21
stress field (viscous dissipation) on mantle convection are also simulated for the first
22
time.
23
Keywords: Mantle convection; Giesekus model; Numerical simulation; Temperature
24
dependence rheological properties.
1
Solid Earth Discuss., doi:10.5194/se-2016-12, 2016 Manuscript under review for journal Solid Earth Published: 15 February 2016 c Author(s) 2016. CC-BY 3.0 License.
Nomenclature Parameter
Symbol
Brinkman number
Br
Heat Capacity
Cp
Elastic number
En
Units
J kg-1K-1
Gravity acceleration
g
m s-2
Depth of mantle
H
km
Thermal conductivity
k
Wm-1K-1
Nusselt number
Nu
Pressure
p
Prantdl number
Pr
Rayleigh number
Ra
Reynolds number
Re
pa
Time
t
Gyr
Temperature
T
K
Velocity vector
U
mm yr-1
Reference velocity
W0
mm yr-1
Weissenberg number
We
Greek Symbols
Mobility factor Compressibility factor
C
Mpa-1
2
Solid Earth Discuss., doi:10.5194/se-2016-12, 2016 Manuscript under review for journal Solid Earth Published: 15 February 2016 c Author(s) 2016. CC-BY 3.0 License.
Viscosity ratio
G
Thermal expansivity
T
Stress field work
Shear rate
s-1
Exponential rate
K-1
Dynamic viscosity
kg m-1 s-1
Thermal diffusivity
Relaxation time
s
Kinetic viscosity
m2 s-1
Density
kg m-3
Stress tensor
pa
K-1
Subscripts
0 Property at upper plate Newtonian
n
Viscoelastic
v
25 26
1. INTRODUCTION
27
Mantle convection is a creeping flow in the mantle of the Earth that causes some
28
convective currents in it and transfers heat between core and Earth’s surface. In fluid
29
mechanics, the free convection is a classic topic driven by the effect of temperature
30
gradient on density. This solid-state convection in mantle is an abstruse phenomenon
3
Solid Earth Discuss., doi:10.5194/se-2016-12, 2016 Manuscript under review for journal Solid Earth Published: 15 February 2016 c Author(s) 2016. CC-BY 3.0 License.
31
that carries out various tectonic activities and continental drift (Bénard (1900),
32
Batchelor (1954), Elder (1968)). This motion occurs on a large scale of space and time.
33
From fluid mechanics point of view, mantle convection is approximately a known
34
phenomenon; the only force which causes convective flow is buoyancy force while this
35
phenomenon is affected by the nature of non-Newtonian rheology (Christensen (1985))
36
and depth-and temperature-dependent viscosity. Gurnis and Davies (1986) just used a
37
depth dependent viscosity and assumed that the Rayleigh number is constant. They
38
deduced this phenomenon depend on Rayleigh number, as when Ra is increased, the
39
thermal boundary layer will be thinned and the center of circulation shifts more to the
40
narrow descending limb. Hansen et al. (1993) examined the influences of both depth-
41
dependent viscosity and depth-dependent thermal expansivity on the structure of mantle
42
convection using two-dimensional finite-element simulations. They concluded depth-
43
dependent properties encourage the formation of a stronger mean flow in the upper
44
mantle, which may be important for promoting long-term polar motions. The rheology
45
of mantle strongly depends on the temperature and hydrostatic pressure (Ranalli (1995),
46
Karato (1997)). Also, because of huge geometry of Earth’s mantle (2000km), the
47
gravity cannot be considered as a constant, and it is a function of depth.
48
Kellogg and King (1997) developed a finite element model of convection in a
49
spherical geometry with a temperature-dependent viscosity. They have focused on three
50
different viscosity laws: (1) constant viscosity, (2) weakly temperature-dependent
51
viscosity and (3) strongly temperature-dependent viscosity. Moresi and Solomatov
52
(1995) have simulated it as two-dimensional square cell with free-slip boundaries. They
4
Solid Earth Discuss., doi:10.5194/se-2016-12, 2016 Manuscript under review for journal Solid Earth Published: 15 February 2016 c Author(s) 2016. CC-BY 3.0 License.
53
reached an asymptotic regime in the limit of large viscosity contrasts and obtained
54
scaling relations that found to be agreement with theoretical predictions. Ghias and
55
Jarvis (2008) investigated the effects of temperature- and depth-dependent thermal
56
expansivity in two-dimensional mantle convection models. They found the depth and
57
temperature dependence of thermal expansivity each have a significant, but opposite,
58
effect on the mean surface heat flux and the mean surface velocity of the convective
59
system. The effect of temperature-dependent viscosity was studied in literature in two-
60
dimensional rectangular domains (Severin and Herwig (1999), Pla et al. (2009),
61
Hirayama and Takaki (1993), Fröhlich et al. (1992)). Tomohiko et al. (2004) simulated
62
a two-dimensional rectangular domain with assuming the mantle as an incompressible
63
fluid with a power-law viscosity model. They employed a simplified two-layer
64
conductivity model and studied the effects of depth-dependent thermal conductivity on
65
convection using two-dimensional Boussinesq convection model with an infinite
66
Prandtl number. Their results implied that the particular values of thermal conductivity
67
in horizontal boundaries could exert more significant influence on convection than the
68
thermal conductivity in the mantle interior. Stein et al. (2004) explored the effect of
69
different aspect ratios and a stress- and pressure-dependent viscosity on mantle
70
convection using three-dimensional numerical simulation. Ozbench et al. (2008)
71
presented a model of large-scale mantle-lithosphere dynamics with a temperature-
72
dependent viscosity. Ichikawa et al. (2013) simulated a time-dependent convection of
73
fluid under the extended Boussinesq approximation in a model of two-dimensional
74
rectangular box with a temperature- and pressure-dependent viscosity and a viscoplastic
75
property. Stien and Hansen (2008) employed a three-dimensional mantle convection
5
Solid Earth Discuss., doi:10.5194/se-2016-12, 2016 Manuscript under review for journal Solid Earth Published: 15 February 2016 c Author(s) 2016. CC-BY 3.0 License.
76
model with a strong temperature, pressure and stress dependence of viscosity and they
77
used a viscoplastic rheology. Kameyama and Ogawa (2000) solved thermal convection
78
of a Newtonian fluid with temperature-dependent viscosity in a two-dimensional
79
rectangular box. Kameyama et al. (2008) considered a thermal convection of a high
80
viscous and incompressible fluid with a variable Newtonian viscosity in a three-
81
dimensional spherical geometry. Gerya and Yuen (2007) simulated a two-dimensional
82
geometry and non-Newtonian rheology using power-law model.
83
In the present paper, the mantle convection is simulated numerically using a
84
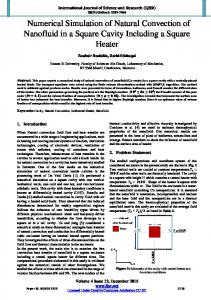
temperature dependent non-linear viscoelastic model for the first time. The geometry of
85
problem is shown in Fig. 1. Here, the calculation domain is considered as a
86
4000km×2000km rectangular box. Two hot and cold plates are considered at the bottom
87
and top of box, respectively. The isolator thermal condition is considered at the left and
88
right hand sides of domain. The problem is solved via a second order finite volume
89
method. The effect of temperature on rheological properties consist of the viscosity,
90
normal stress differences and relaxation time of mantle are modeled using appropriate
91
equations of state which are the main innovative aspects of current study. The variation
92
of gravitational acceleration with depth of Earth and the effect of the work of stress field
93
(viscous dissipation) on mantle convection are simulated for the first time. According to
94
the literature, the previous studies are restricted to the linear and quasi-linear
95
viscoelastic constitutive equations and the nonlinearity nature of mantle convection was
96
modeled as simple nonlinear constitutive equations just for apparent viscosity such as
97
the power-law and cross models. Here, the Giesekus nonlinear viscoelastic model is
6
Solid Earth Discuss., doi:10.5194/se-2016-12, 2016 Manuscript under review for journal Solid Earth Published: 15 February 2016 c Author(s) 2016. CC-BY 3.0 License.
98
used as the constitutive equation. This high order nonlinear model is used because of
99
large-scale creeping viscoelastic flow of mantle convection in domain and time. Using
100
Giesekus constitutive equation, we can calculate a more accurate solution for this
101
problem because:
102
1. In addition to the viscosity, the shear dependencies of other viscometric
103
functions (consist of the first and second normal stress differences) are also
104
modeled. It is important to remember that the linear and quasi-linear viscoelastic
105
constitutive equations that used in previous studies could not able to model the
106
completed set of shear dependent nonlinear viscometric functions which resulted
107
from anisotropic behavior of flow field.
108
2. The effect of the third invariant of shear rate tensor on stress field (especially for
109
normal stress components) is also modeled for the first time. The simple non-
110
linear viscous models such as power-law and cross equations that used in
111
previous studies depend only on generalized shear rate which is defined based
112
on the second invariant of the shear rate.
113
3. The nonlinear effect of material elasticity on large deformation of mantle is
114
modeled simultaneity with the effects of viscometric functions and elongational
115
rheological properties.
116
4. It is important to remember that the non-linear constitutive equations like as the
117
Giesekus equation could able to model the material elasticity and relaxation
118
spectra much better than linear models for large deformations of flow field.
119
7
Solid Earth Discuss., doi:10.5194/se-2016-12, 2016 Manuscript under review for journal Solid Earth Published: 15 February 2016 c Author(s) 2016. CC-BY 3.0 License.
120
2. GOVERNING EQUATIONS
121
The governing equations of an incompressible viscoelastic fluid flow consist of the
122
continuity, momentum and energy equations:
.U 0
(1a)
U U . U p .τ g t
(1b)
T U .T . kT τ : U + u t
(1c)
c
123
where U is the velocity vector, is density, c is heat capacity, p is static pressure, T
124
is temperature, k is thermal conductivity, t is time, u is power of heat source and τ is
125
the total stress tensor. The stress tensor is consisted as the summation of Newtonian τ n
126
and viscoelastic contributions τ v as follows:
τ τ n τv
(2)
127
In Newtonian law ( τ n nγ ), n and γ which respectively are the constant solvent
128
viscosity and the shear rate tensor, gives the solvent part τ n . The viscoelastic stress will
129
be obtained from a constitutive equation. The usefulness of a constitutive equation for
130
describing processing flows of viscoelastic solutions and melts rest on its ability to
131
accurately predict rheological data, as well as on its numerical tractability in several
132
flow geometries. Such equation should successfully account for shear dependent
8
Solid Earth Discuss., doi:10.5194/se-2016-12, 2016 Manuscript under review for journal Solid Earth Published: 15 February 2016 c Author(s) 2016. CC-BY 3.0 License.
133
viscosity, normal stress effects in steady shear flows, elastic effects in shear-free flows
134
and non-viscometric flow phenomena. The parameter G represents the relation of
135
viscoelastic behavior (as the additives) with pure Newtonian behavior (as the solvent):
G
v n v
(3)
136
Since the present study examines mantle convection, this parameter must be near unity.
137
In other words, the viscoelastic portion dominates to pure Newtonian portion in
138
behavior of fluid flow. Therefore, the main portion of viscosity of mantle could be
139
attributed to the v .
140
The Giesekus model is a popular choice, because of its relative success in several
141
flows, and its reduction to several well-known simpler models, which make it useful in
142
a variety of flow situations. The key characteristic of this model is that it includes non-
143
linear term in stress. Here, the Giesekus model is used as the non-linear constitutive
144
equation:
τ v τ v1
τ .τ v γ v v v
(4)
145
where v is the viscosity contribution of viscoelastic material at zero shear rate and τ v1
146
is the upper convected derivative of viscoelastic stress tensor defined by:
τ v1
D τ v U T .τ v τ v .U Dt
9
(5)
Solid Earth Discuss., doi:10.5194/se-2016-12, 2016 Manuscript under review for journal Solid Earth Published: 15 February 2016 c Author(s) 2016. CC-BY 3.0 License.
D( ) D( ) ( ) is material derivative operator given by U .( ) . The Dt Dt t
147
in which
148
Giesekus constitutive equation is derived by kinetic theory, arising naturally for
149
polymer solutions. This model contains four parameters: a relaxation time ; the solvent
150
and polymeric contributions at the zero-shear rate viscosity, n and v ; and the
151
dimensionless “mobility factor” (Bird et al. (1987)). The origin of the term involving
152
153
hydrodynamic drag on the constitutive of heavy particles.
154 155
can be associated with anisotropic Brownian motion and/or anisotropic
In this paper, the viscosity is assumed to be depended on depth and temperature as follow:
0 exp 1.535 y T T 0
(6)
156
where 0 is the total viscosity at reference temperature ( T0 ), y is the depth (per
157
1000Km), and is the exponential rate. The relaxation time ( ) is also assumed to be
158
an exponential function of temperature:
0 exp T T0
(7)
159
Because of large scale of geometry and the nature of mantle convection, the dependency
160
of density on temperature and pressure are considered as follows:
0 1 T T0 1 C p p0
10
(8)
Solid Earth Discuss., doi:10.5194/se-2016-12, 2016 Manuscript under review for journal Solid Earth Published: 15 February 2016 c Author(s) 2016. CC-BY 3.0 License.
p0 0.1MPa are reference temperature and pressure,
161
where T0 300K
162
respectively, 0 is density at reference temperature and pressure, is thermal
163
expansivity and C is compressibility coefficient.
and
164 165
3. NON-DIMENSIONALIZATION
166
According to Fig. 1, the Cartesian coordinate system is used in this study. The
167
dimensionless parameters of flow field are as follows:
x
x H
y
y H
U U /W0
τ
τH 0W0
p
pH 0W0
Re
W0 H 0
We
W0
0
En
2H
(9)
We Re
168
where x and y are indicating the coordinate directions; H is the depth of geometry, W0
169
is the reference velocity, 0 is the dynamic viscosity at zero shear rate ( 0 v n ),
170
is the fluid viscosity, is density and Re, We and En are the Reynolds, Weissenberg
171
and Elastic numbers, respectively. The ~ notation signifies that parameter has
172
dimension. The governing dimensionless parameters of heat transfer are as follows:
T
T Tmin Tmax Tmin
Br
0W02
k Tmax Tmin
11
Pr
0
(10)
Solid Earth Discuss., doi:10.5194/se-2016-12, 2016 Manuscript under review for journal Solid Earth Published: 15 February 2016 c Author(s) 2016. CC-BY 3.0 License.
Ra
g T ΔTH 3
2
Nu
Pr
hH k
173
In the above relations, T is the dimensionless temperature; Tmin and Tmax are the
174
minimum and maximum temperature of fluid, respectively; k is the conduction
175
coefficient, is thermal diffusivity, h is the convection heat transfer coefficient and
176
Br , Pr , Ra and Nu are the Brinkman, Prandtl, Rayleigh and Nusselt numbers,
177
respectively. Thus, the dimensionless form of continuity and momentum equations are
178
as follows:
.U 0
U .U
U .T
(11a)
g ΔTH 1 T 2U W02 Re
1 . T BrΦ RePr
(11b)
(11c)
179
where is the thermal expansion coefficient. In order to get closer to reality, in the
180
energy equation, we assume a viscosity dissipation term ( τ : U ). This term is the
181
effect of stress field work on fluid flow and for Newtonian fluids; it has always a
182
positive sign according to the second law of thermodynamic. Actually, this positive
183
term refer to the irreversibility of flow field work and thus in Newtonian fluid it is
184
known as viscosity dissipation. The interesting point of this term for viscoelastic fluids
185
is the local possibility of being negative. In effect, having locally negative value of this
186
term indicates that part of energy is saved in elastic constituent of fluid (Bird et al.
12
Solid Earth Discuss., doi:10.5194/se-2016-12, 2016 Manuscript under review for journal Solid Earth Published: 15 February 2016 c Author(s) 2016. CC-BY 3.0 License.
187
(2002)). In Eq. (11c), Φ is the dimensionless form of work of stress field and obtain
188
from following equation:
Φ xx
U U U1 U 2 xy 1 2 yy x y x y
(12)
189
This variation in viscosity introduces a relativity factor in the problem. Here, the non-
190
dimensionalization is performed regarding to the value of the viscosity in the upper
191
plate. Therefore, a new Rayleigh number should be defined, due to the variation of
192
viscosity: Ranew Ra exp T T0 .
193
In our numerical calculations, the values of the parameters are related to the values in
194
the mantle (Pla et al., 2010), Table 1 shows the values of parameters used in
195
calculations. Due to the nature of mantle convection the Pr number and viscosity are
196
assumed to be in order of 1026 and 1020 , respectively. Also, a Rayleigh number equal to
197
227 is used for this simulation.
198
Remember that the gravitational acceleration of the Earth is decreased by increasing
199
the depth. Because of the large scale of geometry, the variation of gravitational
200
acceleration with depth is considered in present study. For this purpose, we used the
201
data of Bullen (1939) and fitted the following six order interpolation on them with 95%
202
confidence:
g y 0.118 y 6 0.602 y 5 1.006 y 4 0.6884 y 3 0.3708 y 2 0.167 y 9.846
13
(13)
Solid Earth Discuss., doi:10.5194/se-2016-12, 2016 Manuscript under review for journal Solid Earth Published: 15 February 2016 c Author(s) 2016. CC-BY 3.0 License.
203
where y (1000Km ) is the depth from bottom plate. We used the above equation in CFD
204
simulation of mantle convection which is the other innovative aspect of present study.
205 206
3. NUMERICAL METHOD, BOUNDARY AND INITIAL CONDITIONS
207
There are totally eight solution variable parameters in the discretized domains,
208
comprising two velocities and three stress components, pressure, pressure correction
209
and temperature. All of flow parameters are discretized using central differences, except
210
for the convective terms which are approximated by the linear–upwind differencing
211
scheme (LUDS) (Patankar and Spalding (1972)). This is the generalization of the well-
212
known up-wind differencing scheme (UDS), where the value of a convected variable at
213
a cell face location is given by its value at the first upstream cell center. In the linear-
214
upwind differencing scheme, the value of that convected variable at the same cell face is
215
given by a linear extrapolation based on the values of the variable at the two upstream
216
cells. It is, in general, the second-order accurate, as compared with first-order accuracy
217
of UDS, and thus, its use reduces the problem of numerical diffusion (Oliveira et al.
218
(1998)). The Cartesian reference coordinate system is located in the bottom boundary
219
and at left corner. Boundary conditions consist of two adiabatic walls in west and east
220
and two isothermal walls at north and south. For all boundaries, a no-slip condition is
221
imposed for the fluid velocity. The rest situation is used as the initial condition. The
222
used geometry and boundary conditions in this study are shown in Fig. 1. The geometry
223
has a rectangular shape with an aspect ratio of 2. Boundary conditions consist of two
224
isolated walls with zero gradient stress tensor components. The boundary conditions for
14
Solid Earth Discuss., doi:10.5194/se-2016-12, 2016 Manuscript under review for journal Solid Earth Published: 15 February 2016 c Author(s) 2016. CC-BY 3.0 License.
225
bottom and top plates are assumed a constant temperature so that the bottom plate has a
226
higher temperature. These boundaries have a zero gradient velocity and tensor
227
components, too.
228 229
4. RESULTS AND DISCUSSION
230
4.1. Grid Study and Validation
231
We perform some CFD simulations with different number of grids to study the
232
dependency of solution to mesh size. The meshes included quadratic elements. Table 2
233
lists the mean errors between average Nusselt number on horizontal lines on different
234
meshes and the 200 100 reference mesh. These errors are calculated for a viscoelastic
235
fluid with Giesekus model at Ra 227 . The numerical error decreases with increasing
236
the number of meshes as the mean error beings less than 0.08% for mesh size greater
237
than 140 70 . This finding indicates that a grid-independent solution is obtained when
238
using a mesh sizes larger than 140 70 . To ensure that the obtained solution is grid-
239
independent, a mesh size of 150 75 was used for the CFD simulations.
240
As a benchmark comparison, simulations for free convection of Newtonian fluid
241
flow between two parallel plate have been carried out at Ra 104 , 105 , Pr 100 . This
242
problem was studied previously by Khezar et al. (2012) and Turan et al. (2011) for
243
power-law fluid. The diagrams of average Nusselt number obtained from the present
244
study and work of Khezar et al. (2012) at n=1 are shown in Fig. 2a. As an additional
245
benchmark comparison, the distribution of dimensionless vertical velocity reported by
15
Solid Earth Discuss., doi:10.5194/se-2016-12, 2016 Manuscript under review for journal Solid Earth Published: 15 February 2016 c Author(s) 2016. CC-BY 3.0 License.
246
Turan et al. (2011) and the results obtained from the present study are illustrated in Fig.
247
2b at Ra 104 106 , Pr 100 and n 1 . It is understood that in both cases, the results
248
of present CFD simulation have a suitable agreement with results of Khezar et al.
249
(2012) and Turan et al. (2011) with maximum error less than 3%.
250 251
4.2. CFD Simulation of Mantle Convection Using Giesekus Model
252
In this section, the effects of various parameters on flow regime of mantle convection
253
are studied. As observed in Eq. (4), the variation of parameters and could affect
254
the stress tensor field and this change in stresses will affect the velocity field.
255
According to the study of Pla et al. (2010), it could be inferred that with increasing
256
the exponential rate , the circulations created by natural convection are moved toward
257
the bottom plate. It is resulted from the fact that by increasing , the viscosity near
258
bottom plate would be decreased and the flow tends to circulate in this place. Also,
259
another parameter that effect on the flow and the circulation intensity is G . The results
260
of variations of these parameters will discuss in next sections. Remember that the
261
dependency of rheological and thermal properties and density on temperature and
262
pressure are considered and the variation of gravitational acceleration with depth of
263
Earth is modeled in following results.
264
16
Solid Earth Discuss., doi:10.5194/se-2016-12, 2016 Manuscript under review for journal Solid Earth Published: 15 February 2016 c Author(s) 2016. CC-BY 3.0 License.
265
Fig. 3 demonstrates a comparison between vertical velocity profiles of our
266
nonlinear viscoelastic model, power-law model (reported by Christensen (1983),
267
Cserepes (1982), Sherburn (2011), Van der Berg (1995), Yoshida (2012)) at n=3, and
268
the Newtonian model used by Pla et al. (2010). This Figure is presented in order to
269
compare the results of current CFD simulation (based on the non-linear Giesekus
270
consecutive equation, thermal-pressure dependence properties and depth dependence
271
gravitational acceleration) with previous simpler simulations that used Newtonian and
272
power-law models. As it is obvious, the velocity near upper plate for Giesekus model is
273
less than from the results of Pla et al. (2010) and power-law model. That is due to the
274
elastic force and higher value of viscosity at lower shear rates. Also, the maximum
275
vertical velocity of our simulation is smaller and the location of maximum vertical
276
velocity occurred upper than the location reported by Pla et al. (2010). That is because
277
of the viscoelastic portion of fluid behavior that we will discuss it in next sections. As it
278
is shown in Fig. 3, the depth in which the maximum velocity occurs is approximately
279
similar for power-law model and Giesekus constitutive equation. That is because of the
280
effect of apparent viscosity dependency to velocity gradient. Also noting to the velocity
281
profile, it is seen that all of models have the same results in vicinity of lower plate. But
282
for upper plate, the Figure demonstrates that the slope of vertical velocity for the
283
Giesekus model is smaller than the others. According to the Figure, there is a resistance
284
against the upward flow for Giesekus profile that two other models cannot predict it.
285
Actually, that is due to the consideration of elastic portion of fluid flow in our numerical
286
simulation. This finding indicated that the velocity and stress field have an obvious
287
deviation from Newtonian and generalized Newtonian behaviors by considering a non-
17
Solid Earth Discuss., doi:10.5194/se-2016-12, 2016 Manuscript under review for journal Solid Earth Published: 15 February 2016 c Author(s) 2016. CC-BY 3.0 License.
288
linear constitutive equation for mantle convection. In next sections, the effects of
289
material and thermal modules on mantle convection are studied based on the CFD
290
simulations that obtained using Giesekus non-linear model.
291
292
4.2.1. Investigation of the Effect of Exponential Rate of Viscosity ( Γ )
293
We studied firstly the effect of increasing from zero to 103 on mantle convection.
294
This parameter represents the dependency of viscosity on temperature variation. Fig. 4
295
shows the streamlines for different values of Γ at G 0.98 , 0.2 and
296
En 6.04 1032 . It is evident from Fig.4 that the circulations in the mantle physically
297
depend on . As the exponential rate ( Γ ) is increased, the maximum velocity in
298
geometry is enhanced and the circulations moved downward. According to Eq. (6), the
299
dependency of viscosity of mantle on temperature is more increased by enhancing the
300
exponential rate ( Γ ). In other words, by increasing the exponential rate ( Γ ), the
301
viscosity is more decreased near to the lower plate (high temperature region) and the
302
fluency of mantle is intensified. Therefore, it is expected that the velocity of mantle
303
convection is enhanced by increasing the exponential rate. The results show that an
304
increment of 1.6% in vertical velocities by increasing the exponential rate from zero to
305
105 , 17.1% growth by increasing Γ to 104 and with enhancing the from zero to
306
103 it growths up to 4.32 times. The CFD simulations indicated that the effect of
307
exponential rate on maximum value of velocity is nonlinear. The contours of axial
308
normal stress and shear stress are shown in Fig. 5. As it is obvious, the exponential rate
18
Solid Earth Discuss., doi:10.5194/se-2016-12, 2016 Manuscript under review for journal Solid Earth Published: 15 February 2016 c Author(s) 2016. CC-BY 3.0 License.
309
has a significant influence on magnitude of stress fields that is increased by enhancing
310
the exponential rate. As an example, for Γ 104 , the value of dimensionless stress
311
component xx becomes 1.1 times greater than the one with exponential rate of zero.
312
Also, with increasing the value of Γ by 103 , it growths up to 2.56 times. Actually, with
313
increasing the exponential rate, the dependency of viscosity on temperature is
314
intensified and then the right hand side of Eq. (4) increases so this change leads to
315
enhancement of stress field. Fig. 6 displays the location of maximum vertical velocity at
316
Y / H 0.5 versus the exponential rate. The dimensionless depth of points Y, where the
317
maximum of velocity is occurred, is Y 0.5 for 0 and by increasing the
318
exponential rate to 105 , this depth will be decreased to 2.4%. The amount of this
319
reduction for 104 and 103 is 10% and 24%, respectively. We obtained the
320
following relation for location of maximum vertical velocity with 95% confidence: 2
Y 10.58Γ 3 0.4933 321
The above correlation is used in plotting the Fig. 6. The downward movement of
322
location of maximum vertical velocity with increasing exponential rate could be
323
attributed to shifting the center of vortices which is shown previously in Fig. 5.
324
In Fig. 7, the temperature distribution in mantle is shown. According to this Figure,
325
heat transfer regime is almost conduction. Nevertheless, closer looking to the
326
temperature distribution, some convection behavior could be observed. The temperature
327
profile on a horizontal line is shown in Fig. 8. As it is expected, the temperature profile
328
shown in Fig. 8 has a minimum value at mid of horizontal line and the maximum values
19
Solid Earth Discuss., doi:10.5194/se-2016-12, 2016 Manuscript under review for journal Solid Earth Published: 15 February 2016 c Author(s) 2016. CC-BY 3.0 License.
329
are located at left and right hand sides of numerical domain. Fig. 9 shows the stress
330
magnitude on upper plate for different value of Γ at 0.2 and 1.5 1013 s . As
331
expected from Eq. (6), the viscosity will be more depended on temperature by
332
increasing the value of Γ . Thus, the viscosity will be decreased with increasing Γ and
333
in the other hand; the velocity field will be intensified that the participation of these
334
factors determines stresses in vicinity of upper plate. According to Fig. 9, in the case of
335
Γ 105 , with increasing G from 0.5 to 0.8, the maximum stress magnitude is
336
increased by 32.2% and by enhancing G to 0.9 and 0.98, the growing percentages are
337
32.2% and 101%, respectively. As mentioned before, there are several factors that affect
338
the flow pattern such as Γ and G . The result of this participation clearly is seen here,
339
when the viscosity ratio vary from 0.9 to 0.98, it seems that in this interval, the effect of
340
these two parameters ( Γ and G ) is neutralized each other and lead to having the same
341
stress magnitude at these points.
342
343
4.2.2. Investigation of the Effect of Viscosity Ratio ( βG )
344
The parameter G is a criterion portion for demonstration of domination of viscoelastic
345
towards pure Newtonian portions of fluid behavior. In fact, when this parameter is much
346
closer to unity, the viscoelastic behavior is dominated and when G is close to zero, the
347
pure Newtonian behavior of fluid is dominated. As it is shown in Fig. 10, by increasing
348
G from 0.8 to 0.98, the stress magnitude on upper plate has been increased, but the
20
Solid Earth Discuss., doi:10.5194/se-2016-12, 2016 Manuscript under review for journal Solid Earth Published: 15 February 2016 c Author(s) 2016. CC-BY 3.0 License.
349
vertical velocity near to the both lower and upper plates is decreased. This effect is
350
related to the higher value of viscosity of viscoelastic potion in comparison of pure
351
Newtonian behavior that causes increasing the total viscosity and decreasing the fluidity
352
of model (refer to Eq. 3). This finding is approved by the data of maximum magnitude
353
of shear stress near to the upper plate which is reported in Table 3. According to the
354
Table, max is increased by enhancing the viscosity ratio which is caused from
355
increasing the fluid viscosity.
356
Fig. 11 shows variation of normalized vertical velocity on a vertical line for
357
different values of exponential rates ( Γ ) and viscosity ratios ( G ). As it is understood
358
from Fig. 11, in constant viscosity ratio, when Γ is increased, the velocities are
359
increasing very strongly, but as viscosity ratio changes, a contrast occurred between
360
these two factors (as it is shown in Fig. 11c, the velocities are increased and in Fig. 11b,
361
the vertical velocities are decreased). In other word, at G 0.9 , the effect of exponential
362
rate is prevailed but with increasing the viscosity ratio to G 0.98 , the effect of
363
viscosity ratio is dominated.
364 365
4.2.3. Investigation of the Effect of Elasticity
366
The elastic number is generally used to study the elastic effect on the flow of
367
viscoelastic fluids. According to the Eq. 9, the elastic number is defined as the ratio of
368
Weissenberg to Reynolds numbers. This dimensionless group is independent from
369
kinematic of flow field and it is only depended on material modules for a given
21
Solid Earth Discuss., doi:10.5194/se-2016-12, 2016 Manuscript under review for journal Solid Earth Published: 15 February 2016 c Author(s) 2016. CC-BY 3.0 License.
370
geometry. Here, the elastic number is proportional with relaxation time of model and it
371
is increased by enhancing the material elasticity. Figs. 12 and 13 display velocity and
372
stress magnitude for different values of elastic number. Table 4 presents the value of
373
maximum normalized vertical velocity for different elastic numbers and various
374
viscosity ratios. According to the Fig. 12, the velocity of mantle convection is decreased
375
by increasing the elastic number from 6.04 1026 to 6.04 1032 and it is increased by
376
increasing the elastic number to 6.04 1032 . The first decreasing in the normalized
377
velocity could be attributed to increasing the normal stresses resulted from fluid
378
elasticity. In the other word, some main portion of energy of convection is stored as the
379
elastic normal stresses. In larger elastic numbers, the effective viscosity of flow is
380
decreased which is related to the nature of nonlinear dependency of viscometric
381
function of Giesekus constitutive equation on relaxation time at large enough elastic
382
numbers (Bird et al. (1987)).
383 384
4.2.4. Investigation of Mobility Factor Effect
385
Fig. 14 shows the effects of mobility factor on the vertical velocity for different values
386
of viscosity ratio. Due to the non-linear nature of our viscoelastic model and the high
387
elastic number, anticipation of effects of all factors is not easy and it is strongly affected
388
by the variation of other factors. Regarding to high viscosity of mantle, the effect of
389
mobility factor must be minimal, as it is shown in Fig. 14. The effects of mobility factor
390
are only important near both upper and lower plate. In the other word, the main
391
variation of velocity distributions with changing the mobility factor occurs in the upper
22
Solid Earth Discuss., doi:10.5194/se-2016-12, 2016 Manuscript under review for journal Solid Earth Published: 15 February 2016 c Author(s) 2016. CC-BY 3.0 License.
392
and lower plate. For 0.05 , the magnitudes of normalized velocities in vicinity of
393
upper plate are increasing by enhancing G from 0.5 to 0.9 between 20% to 50% and
394
with increasing the viscosity ratio to 0.98, the velocities are decreasing about 70%. In
395
contrast, for the lower plate, this variation is reversing, i.e., the velocities with
396
increasing G to 0.9 are decreasing. The same effect is available for 0.2 . Also, the
397
variation of velocity near upper plate for 0.1 and 0.3 are similar. In these cases, with
398
increasing G from 0.5 to 0.9, the velocities in this place are decreasing and with
399
increasing the viscosity ratio to 0.98, the magnitudes of velocities are ascending. Table
400
5 presents the maximum normalized vertical velocity for various values of elastic
401
numbers and different viscosity ratios.
402 403
4.2.5. Investigation of the Effect of Rayleigh Number
404
If we want to study natural convection and investigate the strength of convection, the
405
Rayleigh number is a suitable criterion for this aim. Since mantle convection has a low
406
Rayleigh number, thus the temperature field should have a conductive form (see Fig 7).
407
According to Eq. (10), the Rayleigh number is a function of temperature, so it is varying
408
all over the geometry because the viscosity is temperature dependent and is varying.
409
Fig.15 presents the streamlines for different Rayleigh numbers. According to Fig. 15, by
410
increasing the Rayleigh number, the velocity in geometry is increased and the
411
circulations move downward and get more intense. By increasing Ra from 22.7 to 227,
412
the velocity magnitude will vary with order of 101. If we rise the Rayleigh number to
23
Solid Earth Discuss., doi:10.5194/se-2016-12, 2016 Manuscript under review for journal Solid Earth Published: 15 February 2016 c Author(s) 2016. CC-BY 3.0 License.
413
1135, this growth in velocities is in order of 102 and when we set the Ra as 2270, the
414
velocity magnitude will be in order of 103 . It is important to remember that the
415
temperature difference between the hot and cold plates is the potential of mantle
416
convection so the velocity is increased by increasing the Rayleigh number. Fig. 16
417
shows the stress contours for various Rayleigh number. The Figure shows that with
418
increasing the Rayleigh number, the maximum stress in geometry has enhanced
419
significantly. This effect is related to increasing the shear rate of flow field which is
420
intensifying the stress field. According to the Figure, the Giesekus model predicts a
421
large shear stress in comparison of normal stress components which is related to the
422
shear flow behavior of mantle convection which has a suitable agreement with previous
423
reports that used other constitutive equations (Ghias and Jarvis (2008), Severin and
424
Herwig (1999), Pla et al. (2009), Hirayama and Takaki (1993), Fröhlich et al. (1992),
425
Tomohiko et al. (2004)).
426
427
5. CONCLUSIONS
428
Current study deals with a numerical simulation of mantle convection using a
429
temperature dependent nonlinear viscoelastic constitutive equation. The effect of
430
temperature on rheological properties consisting of the viscosity, normal stress
431
differences and relaxation time of mantle are modeled using appropriate equations of
432
state which were the main innovative aspects of current study. The variation of
433
gravitational acceleration with depth of Earth and the effect of the work of stress field
24
Solid Earth Discuss., doi:10.5194/se-2016-12, 2016 Manuscript under review for journal Solid Earth Published: 15 February 2016 c Author(s) 2016. CC-BY 3.0 License.
434
(viscous dissipation) on mantle convection were simulated for the first time. According
435
to the literature, the previous studies were restricted to the linear and quasi-linear
436
viscoelastic constitutive equations and the nonlinearity nature of mantle convection was
437
modeled using simple nonlinear constitutive equations just for apparent viscosity such
438
as the power-law and cross models. The Giesekus nonlinear viscoelastic model was
439
used as the constitutive equation in present study. This high order nonlinear model was
440
used because of large-scale creeping viscoelastic flow of mantle convection in space
441
and time. Using Giesekus constitutive equation, we present a more accurate solution for
442
this problem because of taking into account of shear-dependent nonlinear viscometric
443
functions, the effects of third invariant of shear rate tensor on stress field, and effects of
444
material elasticity for large deformations of mantle.
445
It is important to remember that the non-linear constitutive equations such as the
446
Giesekus equation could able to model the material elasticity and relaxation spectra
447
much better than linear models for large deformations of flow field. We also showed
448
that the result of this model has an obvious deviation from pure Newtonian and power-
449
law solutions that reported in literatures.
450
The effect of temperature on viscosity of the mantle is studied, firstly. The results
451
show that increasing of exponential viscosity rate led to the enhancing the maximum
452
velocity and making the circulation moving downward so that with increasing from
453
zero to 10-3, an increase of 4.32 times in vertical velocity and an increase of 2.56 times
454
in xx were obtained. A formula have presented for the position of maximum vertical
455
velocity as a function of . The effect of viscosity ratio is also investigated on the
25
Solid Earth Discuss., doi:10.5194/se-2016-12, 2016 Manuscript under review for journal Solid Earth Published: 15 February 2016 c Author(s) 2016. CC-BY 3.0 License.
456
mantle convection. These results not only show how stress magnitude on upper plate
457
increases by enhancing the viscosity ratio from 0.8 to 0.98, but also prove decreasing of
458
the vertical velocity near to the both lower and upper plates. These effects are related to
459
the higher value of viscosity of viscoelastic Gesikus model relative to the pure viscous
460
portion (Newtonian behavior) which causes decreasing of fluidity of mantle convection.
461
In constant viscosity ratio, when G increases, the velocities are rising very strongly,
462
but as viscosity ratio changes, a competition occurred between these two factors. In
463
other word, at G 0.9 , the effect of exponential rate is prevailed but with increasing
464
the viscosity ratio up to G 0.98 the effect of viscosity ratio is dominated and the
465
velocities are descended. The variation of Elastic number shows the nature of nonlinear
466
dependency of viscometric function of Giesekus constitutive equations on relaxation
467
time at large enough elastic numbers. Present study indicates decreasing of effective
468
viscosity flow for larger elastic numbers. The obtained results show how main
469
variations of velocity distributions with changing of mobility factor occur in the upper
470
and lower plates. Here, the effect of Rayleigh number on mantle convection is also
471
investigated and characterized that with increasing the Rayleigh number, the maximum
472
stress in geometry has enhanced significantly. This effect is related to increasing the
473
shear rate of flow field which is intensifying the stress field.
474
Future works could be focused on the effect of mantle convection on plate motions,
475
effect of chemical reactions occurring in the mantle, and plumes growing by
476
considering a non-linear viscoelastic consecutive equation.
477
26
Solid Earth Discuss., doi:10.5194/se-2016-12, 2016 Manuscript under review for journal Solid Earth Published: 15 February 2016 c Author(s) 2016. CC-BY 3.0 License.
478
REFERENCES
479 480
Batchelor, G.K. (1954), Heat convection and buoyancy effects in fluids, Q. J. R. Meteorol. Soc., 80, 339–358.
481 482
Bénard, H. (1900), Les tourbillons cèllulaires dans une nappe liquid, Rev. Gen. Sci. Pures Appl. Bull. Assoc., 11, 1261–1271.
483 484
Bird, R.B., Stewort, W.E., and Lightfoot, E.N., Transport phenomena. 2nd Ed. (John Wiley & Sons, Inc 2002).
485 486
Bird, R.B., Armstrong, R.C., and Hassager, O., Dynamics of polymeric liquids. Vol. 1 (John Wiley & Sons, Inc. 1987).
487 488
Bullen, K.E. (1939), The variation of gravity within the earth, Auckland University College, 188–190.
489 490
Christensen, U. (1983), Convection in a variable-viscosity fluid: Newtonian versus power-law rheology, Earth and Planetary Science Letters, 64, 153–162.
491 492
Christensen, U.R. (1985), Thermal evolution models for the Earth, J. Geophys. Res., 90, 2995–3007.
493 494
Cserepes, L. (1982), Numerical studies of non-Newtonian mantle convection, Physics of the Earth and Planetary Interiors, 30, 49–61.
495
Elder, J.W. (1968), Convection key to dynamical geology, Sci. Prog., 56, 1–33.
496 497
Fröhlich, J., Laure, P., and Peyret, R. (1992), Large departures from Boussinesq approximation in the Rayleigh Bénard problem, Phys. Fluids A 4, 1355–1372.
498 499 500
Gerya, T.V., and Yuen, D.A. (2007), Robust characteristics method for modelling multiphase visco-elasto-plastic thermo-mechanical problems, Phys. Earth Planet. Int., 163, 83–105.
501 502 503
Ghias, S.R., and Jarvis, G.T. (2008), Mantle convection models with temperature- and depth-dependent thermal expansivity, J. Geophys. Res. Solid Earth, 113, DOI: 10.1029/2007JB005355.
504 505 506
Gurnis, M., and Davies, G.F. (1986), Numerical study of high Rayleigh number convection in a medium with depth-dependent viscosity, Geophys. J. R. Astron. Soc., 85, 523–541.
507 508 509
Hansen, U., Yuen, D.A., Kroening, S.E., and Larsen, T.B. (1993), Dynamical consequences of depth-dependent thermal expansivity and viscosity on mantle circulations and thermal structure, Phys. Earth Planet. Int., 77, 205–223.
27
Solid Earth Discuss., doi:10.5194/se-2016-12, 2016 Manuscript under review for journal Solid Earth Published: 15 February 2016 c Author(s) 2016. CC-BY 3.0 License.
510 511
Hirayama, O., and Takaki, R. (1993), Thermal convection of a fluid with temperaturedependent viscosity, Fluid Dynam. Res., 12, 35–47.
512 513 514
Ichikawa, H., Kameyama, and M. Kawai, K. (2013), Mantle convection with continental drift and heat source around the mantle transition zone, Gondwana Research, DOI: 10.1016/J.GR.2013.02.001.
515 516 517
Kameyama, M., and Ogawa, M. (2000), Transitions in thermal convection with strongly temperature-dependent viscosity in a wide box, Earth Planet. Sci. Lett., 180, 355– 367.
518 519 520
Karato, S., Phase transformation and rheological properties of mantle minerals (ed. Crossley, D., Soward, A.M.) (Earth’s Deep Interior. Gordon and Breach, New York 1997) pp. 223–272.
521 522 523
Kellogg, L.H., and King, S.D. (1997), The effect of temperature dependent viscosity on the structure of new plumes in the mantle: results of a finite element model in a spherical, axymmetric shell, Earth Planet. Sci. Lett., 148, 13–26.
524 525
Khezzar, L., Siginer, D., and Vinogradov, I. (2012), Natural convection of power law fluids in inclined cavities, Int. J. Thermal Sci., 53, 8–17.
526 527 528
Kameyama, M., Kageyama, A., and Sato, T. (2008), Muligrid-based simulation code for mantle convection in spherical shell using Yin-Yang grid, Phys. Earth Planet. Int., 171, 19–32.
529 530
Moresi, L.N., and Solomatov, V.S. (1995), Numerical investigation of 2D convection with extremely large viscosity variations, Phys. Fluids, 7, 2154–2162.
531 532 533
Oliveira, P.J., Pinho, F.T., and Pinto, G.A. (1998), Numerical simulation of non-linear elastic flows with a general collocated finite-volume method, J. Non-Newton. Fluid Mech., 79, 1–43.
534 535 536 537
OzBench, M., Regenauer-lieb, K., Stegman, D.R., Morra, G., Farrington, R., Hale, A., May, D.A., Freeman, J., Bourgouin, L., Muhlhaus, H., and Moresi, L. (2008), A model comparison study of large-scale mantle-lithosphere dynamics driven by subduction, Phys. Earth Planet. Int., 171, 224–234.
538 539 540
Pla, F., Herrero, H., and Lafitte, O. (2010), Theoretical and numerical study of a thermal convection problem with temperature-dependent viscosity in an infinite layer, Physica D, 239, 1108–1119.
541 542 543
Pla, F., Mancho, A.M., and Herrero, H. (2009), Bifurcation phenomena in a convection problem with temperature dependent viscosity at low aspect ratio, Physica D, 238, 572–580.
28
Solid Earth Discuss., doi:10.5194/se-2016-12, 2016 Manuscript under review for journal Solid Earth Published: 15 February 2016 c Author(s) 2016. CC-BY 3.0 License.
544 545 546
Patankar, S.V., and Spalding, D.B. (1972), A calculation procedure for heat, mass and momentum transfer in three-dimensional Parabolic flows, Int. Heat Mass Transfer, 115, 1787–1803.
547 548
Severin, J., and Herwig, H. (1999), Onset of convection in the Rayleigh-Bénard flow with temperature dependent viscosity, Math. Phys., 50, 375–386.
549 550 551 552
Sherburn, J.A., Horstemeyer, M.F., Bammann, D.J., and Baumgardner, J.R. (2011), Two-dimensional mantle convection simulations using an internal state variable model: the role of a history dependent rheology on mantle convection, Geophys. J. Int., 186, 945–962.
553 554 555
Stein, C., Schmalzl, J., and Hansen, U. (2004), The effect of rheological parameters on plate behaviour in a self-consistent model of mantle convection, Phys. Earth Planet. Int., 142, 225–255.
556 557
Stien, C., and Hansen, U. (2008), Plate motions and viscosity structure of the mantleinsights from numerical modeling, Earth Planet. Sci. Lett., 272, 29–40.
558 559 560
Van den Berg, Arie P., Yuen, D.A., and Van Keken P.E. (1995), Rheological transition in mantle convection with a composite temperature-dependent, non-Newtonian and Newtonian rheology, Earth and Planetary Science Letters, 129, 249–260.
561 562 563
Yanagawa, T.K.B., Nakada, M., and Yuen, D.A. (2004), A simplified mantle convection model for thermal conductivity stratification, Phys. Earth Planet. Int., 146, 163–177.
564 565 566
Yoshida, M. (2012), Plume’s buoyancy and heat fluxes from the deep mantle estimated by an instantaneous mantle flow simulation based on the S40RTS global seismic tomography model, Physics of the Earth and Planetary Interiors, 210–211, 63–74.
567 568 569 570
Turan, O., Sachdeva, A., Chakraborty, N., and Poole, R.J. (2011), Laminar natural convection of power-law fluids in a square enclosure with differentially heated side walls subjected to constant temperatures, J. Non-Newton. Fluid Mech., 166, 1049– 1063.
571 572
29
Solid Earth Discuss., doi:10.5194/se-2016-12, 2016 Manuscript under review for journal Solid Earth Published: 15 February 2016 c Author(s) 2016. CC-BY 3.0 License.
573 574 575
Table 1. Parameters related to mantle convection (Pla et al. (2010)). Parameter
Value
H [m]
2.9 106
[ m 2 s 1 ]
7 107
T [ K 1 ]
105
[ m 2 s 1 ]
3.22 1020
Pr
1026
Ra
3.48 T
576 577 578 579 580 581 582 583
30
Solid Earth Discuss., doi:10.5194/se-2016-12, 2016 Manuscript under review for journal Solid Earth Published: 15 February 2016 c Author(s) 2016. CC-BY 3.0 License.
584 585
Table 2. Percentage of mean absolute errors between average velocity obtained from different meshes and the 200 100 reference mesh.
Nx N y
Ra
227
100 50
120 60
140 70
150 75
170 85
0.1858
0.1283
0.0812
0.0602
0.0314
586 587 588 589 590 591 592 593 594 595 596
31
Solid Earth Discuss., doi:10.5194/se-2016-12, 2016 Manuscript under review for journal Solid Earth Published: 15 February 2016 c Author(s) 2016. CC-BY 3.0 License.
597 598
Table 3. Maximum magnitude of stress on top plate for different values of G and Γ ( 0.2 and En 6.04 1032 ).
max
G Γ0
Γ 105
Γ 104
Γ 103
0.98
36.8
37
40.5
133.75
0.9
30.6
33.75
32.6
112.5
0.8
29.5
29.8
32.6
112.5
0.5
18.25
18.4
20.1
73
599 600 601 602 603 604 605 606
32
Solid Earth Discuss., doi:10.5194/se-2016-12, 2016 Manuscript under review for journal Solid Earth Published: 15 February 2016 c Author(s) 2016. CC-BY 3.0 License.
607 608
Table 4. Maximum magnitude of vertical velocity on a vertical line at x=1 for different values of G and En ( 0.2 and Γ 105 ).
Vmax
G
En 6.04 10
26
En 6.04 10
28
En 6.04
En 6.04
En 6.04
En 6.04
34
1036
10
10
10
30
32
0.50
0.0400
0.0410
0.0390
0.0392
0.0396
0.0395
0.80
0.0387
0.0400
0.0395
0.0439
0.0361
0.0400
0.90
0.0427
0.0380
0.0390
0.0385
0.0380
0.0410
0.98
0.0359
0.0423
0.0420
0.0341
0.0410
0.0373
609 610 611 612 613 614 615
33
Solid Earth Discuss., doi:10.5194/se-2016-12, 2016 Manuscript under review for journal Solid Earth Published: 15 February 2016 c Author(s) 2016. CC-BY 3.0 License.
616 617
Table 5. Maximum magnitude of vertical velocity on a vertical line at x=1 for different values of G and ( En 6.04 1032 and Γ 105 )
Vmax
G 0.05
0.10
0.20
0.30
0.40
0.50
0.50
0.0395
0.0397
0.0397
0.0398
0.0397
0.0395
0.80
0.0398
0.0356
0.0439
0.0407
0.0407
0.0385
0.90
0.0376
0.0390
0.0385
0.0380
0.0417
0.0424
0.98
0.0385
0.0383
0.0341
0.0385
0.0415
0.0373
618 619 620 621
34