Earthquakes and Structures, Vol. 9, No. 4 (2015) 000-000 000
DOI: http://dx.doi.org/10.12989/eas.2015.9.4.000
Numerical simulation of the experimental results of a RC frame retrofitted with RC Infill walls Nicholas Kyriakides1, Christis Z. Chrysostomou1a, Panagiotis Kotronis2b, Elpida Georgiou1c and Panayiotis Roussis4d 1
Cyprus University of Technology, Department of Civil Engineering and Geomatics, P.O.Box 50329, 3603 Lemesos, Cyprus. Tel 0035799935800 2 Ecole Centrale de Nantes 3 University of Cyprus
(Received December 18, 2014, Revised June 20, 2015, Accepted July 10, 2015) Abstract. The effectiveness of seismic retrofitting of RC-frame buildings by converting selected bays into
new walls through infilling with RC walls was studied experimentally using a full-scale four-storey model tested with the pseudo-dynamic (PsD) method. The frames were designed and detailed for gravity loads only using different connection details between the walls and the bounding frame. In order to simulate the experimental response, two numerical models were formulated differing at the level of modelling. The purpose of this paper is to illustrate the capabilities of these models to simulate the experimental nonlinear behaviour of the tested RC building strengthened with RC infill walls and comment on their effectiveness. The comparison between the capacity, in terms of peak ground acceleration, of the strengthened frame and the one of the bare frame, which was obtained numerically, has shown a five-fold increase. Keywords: retrofitting of RC buildings; RC infill walls; connection details; finite element analysis;
fibre model, pseudo-dynamic experimental results
1. Introduction The most effective and economic method for retrofitting multi-storey RC buildings is the construction of new walls, especially those with pilotis (soft-storey). Their structural and economic effectiveness increases when selected bays of an existing RC frame are fully infilled. Most of the experimental research work performed in the last decades covers sufficiently the other frequently used types of retrofitting - in particular the use of fibre-reinforced polymers (FRP) and the concrete jackets. Some of these types of retrofitting for RC buildings with openings are discussed in Hemant (2009). Some more recent work (Antonopoulos T.A and Anagnostopoulos S.A. 2012) Corresponding author, Ph.D., E-mail:
[email protected] a Associate Professor, E-mail:
[email protected] b Professor, E-mail:
[email protected] c Ph.D. candidate, E-mail:
[email protected] d Assistant Professor, E-mail:
[email protected] Copyright © 2015 Techno-Press, Ltd. http://www.techno-press.org/journals/eas&subpage=7
ISSN: 2092-7614 (Print), 2092-7622 (Online)
Nicholas Kyriakides et al.
examines numerically the effectiveness of the use of diagonal steel braces to provide stiffness and ductility in cases of open ground stories. It is shown that the application of these braces improves the demand to capacity ratios for shear and bending in all floors of the building. Alternatively, Misir (2014) proposes the use of locked brick infill walls, which have the potential to decrease the soft-story/weak-story formation in comparison to standard bricks due to their shear sliding mechanism and decreased upper-story/first-story stiffness, even in buildings that have non-infilled first stories. The use of these sliding brick walls increases the capacity of the building since it removes weaknesses due to openings but cannot provide significant stiffness and strength to the building to withstand severe earthquakes. The use of RC Infill walls for retrofitting RC buildings with openings is a relatively new retrofit method, which can be used to increase the strength, stiffness and ductility of the building. There is no adequate experimental research work on the use of RC infill walls and most research has mainly targeted on what is feasible: testing of one- to two-storey specimens due to the practical difficulties of testing large specimens with high resistance. So, data is lacking for taller full-scale specimens that reflect real applications. Regarding to code provisions, Eurocode 8 - Part 3 fully covers retrofitting with FRP or concrete jackets, while it does not refer at all to new walls created by infilling frame bays. Other guidelines, like KANEPE (2012) in Greece, refer to the design of such walls but only in terms of forces, without providing tools for calculation of their characteristic deformations (at yield and failure) and stiffness, unless the infill wall can be considered integral with the bounding frame. The inadequacy of design codes in this respect is due to our poor knowledge of the behaviour of walls created by infilling with RC a bay of an existing frame. In order to start filling the gap of knowledge regarding infilling of existing RC frames with RC walls, the effectiveness of seismic retrofitting of multi-storey multi-bay RC-frame buildings by converting selected bays into new walls through infilling with RC was studied experimentally at the Elsa Laboratory of Structural Assessment (ELSA) facility at JRC, in Ispra. The research was under the project “Seismic Engineering Research Infrastructures for European Synergies” (SERIES), financed by the Seventh Framework Programme of the European Commission. The scope of this paper is the numerical simulation of the tested frame and the comparison of the results with the experimental ones, using numerical models of different modelling sophistication. In the first part, a brief description of the design of the bare-frame specimen and the RC Infill walls is presented along with details of the testing campaign and some of the main results obtained from the experiment. Details can be found in Chrysostomou et al. (2013, 2014) and Poljansek et al. (2014). In the second part, which is the main focus of the paper, the modelling and the results a 2D finite element micro-model, simulating the behaviour of one of the two planar frames tested, and a macro-model using fibre elements for the frame members and shell elements for the walls, simulating both planar frames and the connecting beams and slab, are presented. Finally, the results of the numerical simulation of the bare frame are also provided in order to emphasise the effectiveness of this retrofitting method and conclusions are drawn.
2. Description of the specimen and test campaign The specimen was designed based on a four-storey prototype building structure consisting of four three-bay frames spaced at 6 meters, with RC infilling of the exterior frames only. The specimen was designed at full-scale to represent the two exterior frames of the prototype structure,
Numerical simulation of the experimental results of a RC frame retrofitted with RC Infill walls 3.0 m
2.5 m
3.0 m
3.0 m
3.0 m
3.0 m
3.0 m
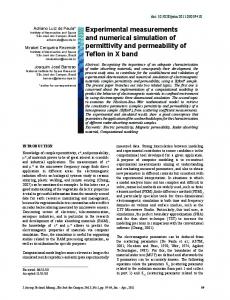
(a) Dimensions of the full-scale specimen (b) Layout of the full-scale specimen without without the RC infill the RC infill Fig. 1 Dimensions and layout of the full-scale specimen without the RC infill
spaced at 6 m and linked by 0.15 m thick RC slab and four 0.25 m by 0.50 m beams perpendicular to the plane of the two three-bay frames (Fig. 1(b)). The purpose of the experiment was to perform uni-directional pseudo-dynamic testing on these two parallel planar frames, which were infilled with RC infills reinforced with different amounts of reinforcement and connected to the frames with different connection details, as explained in the following paragraphs. These frames were named North and South as it is defined in Fig. 3. Hence, the direction towards the reaction wall (backside of Fig. 3) is East and the one in the opposite direction (front-side of Fig. 3) is West. The centre-line length dimension of the specimen was 8.5 m (central bay 2.5 m and the two exterior bays 3.0 m), the storey height 3.0 m, and the total height of the specimen (excluding the foundation) 12.0 m (Fig. 1(a)). The dimensions of the columns were 0.25 m by 0.40 m with the long dimension along the plane of the three-bay frames (that was also the direction of uni-directional loading), while those of the beams 0.25 m by 0.50 m. The proposed structure represents typical construction of the late 70’s and beginning of the 80’s in Cyprus. At that time, there were no provisions for earthquake loading, so the structures were designed for gravity loads only. There was no specific design standard and the authorities were accepting any standard that was acceptable to other countries such as CP110 (BSI 1972) and BS8110 (1983), DIN, Greek Code, US code etc. For the mock-up design, it was decided to use the provisions of BS8110, which were very close to those of CP110 with minor differences. The material properties used in the mock-up were constrained by the availability of materials in the Italian and European market. It was finally decided to use concrete C20/25 for both the frame and the walls, of unit weight 25 kN/m³ and modulus of elasticity, E=30,000 MPa. The yield strength of the ribbed bar reinforcing steel was fyk=400 MPa for both bending and shear reinforcement of the frame members and the slab, while for the RC infill and the dowels to be used for connecting the wall to the bounding frame members the yield strength was specified to fyk=450 MPa. The 400 MPa characteristic yield strength steel represents the one used in Cyprus construction practice in the 1970’s and 80’s, while the 450 MPa was the closest available in the Italian market to substitute for the 500 MPa steel that would have been used in the walls for retrofitting such a structure. The self-weight was calculated using the unit weight of concrete specified above. The imposed dead load including the load of masonry infill walls was 3 kN/m2, and the live load was 1.5 kN/m².
Nicholas Kyriakides et al.
(a) Reinforcement details for beams
(b) Reinforcement details (c) Dowels and starter (d) Dowels, starter bars for columns bars and web reinforcement Fig. 2
These loads were combined using partial factors of safety of 1.4 for self-weight and imposed deadload, and 1.6 for the live load. The material partial factors used were 1.5 for concrete and 1.15 for steel. The reinforcement details of the beams, the columns and the slabs are given in Chrysostomou et al. (2013, 2014), Poljansek et al. (2014). Herein, it is important to emphasise the fact that a compression lap was used for columns, in line with a design for gravity loads only, and was expected to fail when subjected to tension. Connection details at the joints, laps and between the infill-walls and the bounding frame are given in Fig. 2. The walls in the two frames, which had a thickness of 0.25 m equal to the width of the beams and columns of the bounding frame, were reinforced with different amounts of reinforcement, with the north one being the stronger of the two, in order to facilitate the study of the effect of as many parameters as possible. Two parameters were examined: a) the amount of web reinforcement in the walls and b) the connection detail between the wall and the bounding frame. Regarding the connection detail, two distinct connection details were used. In the first detail, the web bas were connected to the surrounding frame through lap splicing with the same diameter starter bars epoxy grouted into the fame members. Short dowels were then used in order to transfer the shear at the interface between the wall and the frame member. This detail was used to connect the wall at the bottom beam and right column at the 1st and 2nd floors of the North frame (Fig. 2(c), starter bars are shown here only for the bottom beam), while for the South frame it was used to connect the wall at the bottom beam of the 1st and 2nd floors, and the west and east columns of the 1st and 2nd floors, respectively. In the second detail, longer dowels were used to act both as dowels and as starter bars of the web reinforcement, which is placed at the two faces of the wall. Thus, these dowels are considered as lap-spliced with the nearest - smaller diameter - web bars. However, in this case, the clear distance between the dowel and the nearest web bar, violates the maximum clear distance of 50 mm or 4Φ between lapped bars, specified in Eurocode 2 (CEN 2004). This detail was used to connect the wall at the top beam and west column at the 1st and 2nd floors of the North frame (Fig. 2(c)), while for the South frame it was used to connect the wall at the top beam of the 1 st and 2nd floors, and the east and west columns of the 1st and 2nd floors, respectively. In the 3rd floor of both the North and South frames, only the second detail was used, while for the 4th floor only two dowels per wall interface were used to provide safety against falling of the wall out of plane. The completed wall reinforcement (including web, starter bars and dowels) for the 1 st floor of the North wall is shown in Fig. 2(d). In all cases, the dowels were positioned along the centreline of the elements (i.e., at 0.125 m from the face of the wall). Detailed guidelines for the design of such walls can be found in Fardis (2013).
Numerical simulation of the experimental results of a RC frame retrofitted with RC Infill walls
Fig. 3 Elevation of the specimen in the lab. The wall shown on the right is the South wall (frame) and the one on the left is the North wall (frame)
Since the lapping of the column reinforcement could take only compression, then it was obvious that there would be lap splice failure at the ground floor columns next to the RC Infill wall, which could be detrimental to the whole experiment. Therefore, in order to safeguard against this type of failure and allow the experiment to be performed without any premature failure, it was decided to reinforce the edges of the wall at the 1st floor with three-sided CFRP for the height of 0.60 m (lapping stopped at 0.55 m) from the base of the column. Based on the performance of the ground floor RC Infill wall during the experiments, this additional retrofit of the lap length region is crucial and constitutes part of the proposed retrofit strategy. Within the testing campaign two PsD tests and one cyclic test were run. The accelerogram was scaled to a maximum acceleration of 0.10 g and 0.25 g for the first and second PsD tests, respectively. For the final cyclic test, a history of displacements was imposed at the fourth floor, while maintaining a triangular distribution of loads along the height of the North frame and zero rotation at each of the four floors (unidirectional test). The aim of this final test was to explore the final capacity of the specimen up to a 20 % drop of peak strength of the structure. In a PsD test, it is assumed that the response of a structure can be determined by a discrete model with a limited number of degrees of freedom (DoF). In this test campaign, four DoFs were selected: the horizontal displacements of each storey with the assumption that all the mass is concentrated at the selected DoFs (i.e., the floor slabs). Horizontal displacements of the controlled DoFs were solved for a prototype time step using the explicit Newmark time integration method. These displacements were then computed and applied on the structure by horizontal actuators at each storey with a laboratory time step of 0.002 s corresponding to the sampling of the controllers. The forces measured by the load cells in the actuators, following the application of the controlled
Nicholas Kyriakides et al.
displacements, represent the restoring forces that are fed back to the computer and that are used in the next time step of the calculation. Restoring forces are thus obtained from the specimen’s response and reflect its state of damage. Since the inertial and viscous damping forces are modelled in the computer, the test does not have to run in real time scale. Hysteretic damping is automatically accounted for through inelastic deformation and damage progression of the test structure; consequently no viscous damping matrix was used (Molina et al. 2011). During the PsD test campaign the equation of motion was solved for restoring forces coming from the North frame only (calculated from static equilibrium of the load cell force measurements at each floor) and multiplied by a factor of two (the South frame is considered equal to the North frame in the numerical model). Equal displacements were applied to the two frames, in order to maintain zero rotation along the horizontal plane of the floor.
3. Experimental results and short discussion Displacement transducers were installed to measure local displacements in critical areas. In particular, transducers were placed to monitor slip and crack opening between all walls and their bounding beams and columns, the displacements between the ground floor walls and the foundation beams, and the shear deformations of the two ground floor walls. Displacement transducers were also installed to measure at all storeys the vertical elongation of the bounding columns. Inclinometers were used to measure the rotation of beams and columns at the first floor. They were placed at the centre joints and on beams and columns 30 cm away from the joints. Inclinometers were also placed at selected columns 30 cm above the foundation beam. Heidenhain linear encoders were installed on two reference frames to measure the horizontal displacement of the two frames at each of the four floors in the direction of testing. For the low-level acceleration, the structure behaved very well. There were no visible cracks on either the columns or the walls. Some hairline cracks that appeared on the surface of the wall closed down when the experiment was finished. The maximum top storey displacement was 24 mm and the displacement in the opposite direction was 26 mm. These displacements were the same for both the north and south frames, since the forces in the south frame were imposed in such a way so as to keep the displacements of the two frames equal, and hence avoid any torsional effects on the specimen. It was considered that both walls have reached their cracking moment, and this was the purpose of this experiment. The 0.25 g test was performed the day after the first test, and it was designed to bring the specimen at its ultimate capacity. The maximum top storey displacement was 109 mm and the displacement in the opposite direction was -93 mm. Some difference was observed in the base shear between the two frames. The maximum base shear in the positive direction (specimen was moving towards the East, i.e., towards the reaction wall) was 1074 kN for the south frame and 1036 kN for the north, which are about the same, while a negative base shear of -843 kN was recorded for the south frame and -1011 kN for the north one in the negative direction (specimen was moving towards the West, i.e., away from the reaction wall). This was an indication that the south frame has suffered some damage and it could not take further load. The only visual indication of this was a crack that opened in the ground beam at the base of the wall and the lapsplice failure due to tensile forces of the outer column on the east side of the south frame. It should be noted that the presence of the CFRP on the bounding columns of the wall, have prevented a
Numerical simulation of the experimental results of a RC frame retrofitted with RC Infill walls 800 600
Base Shear (kN)
400 200 0 -200 -400 -600 -800
South frame North frame
-1000 -1200 -150
-100
-50
0
50
100
150
Top storey displacement (mm)
Fig. 4 Base shear versus top storey displacement for the south and north wall for the cyclic test
similar failure and it allowed the completion of the experiment. Regarding general behaviour of the specimen, it can be said that it withstood the loading imposed on it very well. There were no visible diagonal cracks on the walls, which behaved in a flexural mode. In nearly all the columns, a horizontal crack appeared at a height of 0.55 m where the lap-splice stopped, and in some cases, there was spalling of the concrete cover. Some vertical cracks appeared at the connection between the beams and the columns, but there was no severe damage, despite the fact that there were no ductile connections in the structure. In general, the stronger north frame had an overall better behaviour compared to the south one, but the differences were minor. Finally, in the “funeral” cyclic test a displacement-history was imposed at the top storey (92, 92, 89, -125, 37, 0 mm) and a triangular distribution of forces was imposed. The objective of the test was to obtain a 20% reduction of the peak strength of the infill, in order to establish the strength envelope of the specimen. The base shear versus the top storey displacement is shown in Fig. 4. As it can be observed in the first cycle, the structure could reach 92 mm in both directions. In the second cycle, the attempt was to reach 125 mm, but in the positive direction only 89 mm was possible to be reached, while in the negative direction 125 mm was reached. This though had as a result a sudden drop of the strength of the south frame from 838 kN at -110 mm to 553 kN at a displacement of -125 mm. This amounts to a drop in strength of 34%. After that, the displacement was reduced to 37 mm in the positive direction and from there to zero. Detailed presentation of the experimental model and testing campaign, as well as discussion of the results are given in Chrysostomou et al. (2013, 2014), Poljansek et al. (2014).
4. 2D Finite element model As already mentioned, during the experiments equal displacements were applied to the two frames in order to maintain a zero rotation along the horizontal plane of the floor. The loading being unidirectional, a 2D finite element model was first chosen. All the calculations presented in this section have been performed before the experiments (“blind” calculations). Only one of the two frames was considered of width 0.25 m, with 75000 kg per floor and a total weight of 1211 kN at its base. The finite element code Cast3M developed at CEA in France was used for the
Nicholas Kyriakides et al.
(a) concrete mesh Fig. 5 2D finite element discretisation
(b) steel mesh
Table 1 2D finite element model: distribution of reinforcement bars Beam (long.) Beam (transv.) Column (transv.) Column (transv.) Wall (long.) Wall (transv.)
4 Φ12 (up), 4 Φ12 (down) Φ8/200 2 Φ20 (left), 2 Φ20 (right) Φ8/200 Φ12/200 (2 layers) Φ12/200 (2 layers)
(a) f1=2.85 Hz (b) f2=11.35 Hz (c) f3=13.6 Hz (d) f1=15.3 Hz Fig. 6 2D finite element model: the first four eigenmodes and the corresponding eigenfrequencies
calculations (Millard 1993). Concrete was modelled using classical quadrilateral finite elements (Fig. 5(a)) and horizontal and vertical reinforcement bars with truss elements (Fig. 5(b)). Perfect bonding was assumed between concrete and steel, the existing structure and the RC infilling. Table 1 provides the distribution of the reinforcement bars in the finite element model. The FRP’s were not considered. Results of the modal analysis are provided in Fig. 6. The first mode, corresponding to in- plane flexure and dominates the behaviour of the structure. Advanced constitutive laws, suitable for cyclic loading were used for the materials. Concrete behaviour was reproduced using a damage mechanics law that takes into account the difference in tension and compression and the unilateral effect (opening and closing of cracks, Faria et al. 1998). Steel was modelled using a classical plasticity law able to reproduce the Bauschinger effect (cinematic hardening, Menegoto M., and Pinto P., 1973). The material parameters are shown in Table 2.
Numerical simulation of the experimental results of a RC frame retrofitted with RC Infill walls Table 2 2D finite element model: material parameters Concrete Young’s modulus Poisson coefficient Tension stress limit Tension deformation limit Compression stress limit Compression deformation limit
(a) First storey
Parameters 20E+09 Pa 0.2 3.6 MPa 1.8E-04 33.8 MPa -3.0E-03
Steel Young’s modulus Poisson coefficient Stress limit Deformation limit Stress ultimate limit Deformation ultimate limit
Parameters 200E+09 Pa 0.3 460 MPa 0.0023 515 MPa ~0.25
(b) Second storey
(c) Third storey (d) Forth storey Fig. 7 2D finite element model (0.25 g): displacements time history, experimental vs. numerical results
Nonlinear calculations were performed considering a very low level of viscous Rayleigh damping (0.25%), so as to be compatible with the PsD testing (see section 2). The implicit Newmark numerical algorithm was adopted for the time integration of the equation of motion and the classical Newton-Raphson algorithm for the nonlinear material behaviour. Results are presented hereafter for 0.25 g (and for an earthquake signal of about 12 sec). Fig. 7 compares the numerical and the experimental results considering the displacements time histories at all floors. The performance of the “blind” numerical model is satisfactory in terms of maximum values and frequency content especially for the upper floors. Figs. 8 and 9 show the performance of the model in terms of base shear-top displacement and storey shear-interstorey drift at each floor. Results are particularly good for the upper floors. It can be noticed, however, that the model does not reproduce accurately the interstorey drift at the base.
Nicholas Kyriakides et al.
Fig. 8 2D finite element model (0.25 g): Base shear - top displacement, experimental vs. numerical results
(a) First storey (b) Second storey (c) Third storey (d) Forth storey Fig. 9 2D finite element model (0.25 g): Storey shear and interstorey drift, experimental vs. numerical results
(a) Damage variable due to tension (b) Damage variable due to compression Fig. 10 2D finite element model (0.25 g)
The advantage when using continuum mechanics constitutive laws is that we have access to local results in terms of damage indices, strains in the reinforcement bars etc. Fig. 10 shows the
Numerical simulation of the experimental results of a RC frame retrofitted with RC Infill walls
damage index due to tension (a) and to compression (b) for a loading of 0.25 g. This damage index varies between zero and one (from undamaged to completely damaged cross-section). Therefore, a zero damage index corresponds to no tension or compression, whereas when the variable reaches the value of one it corresponds to the attainment of the tension or compression capacity of the members. It is clear from Fig. 10 that the structure has exhibited good behaviour in terms of the strong column-weak beam mechanism. However, the existence of damage due to compression at the bottom (Fig. 10(b)) indicates that this level of loading is important and that for a higher level of PGA the structure maybe at risk due to possible compression failure of the columns bounding the wall.
5. Simple numerical model The analysis of the building was also conducted using a simple numerical model based on line and shell elements. The purpose of this model was to simulate the response of the specimen as it was tested in the lab, unlike the 2D micro-model presented in the previous section by which only one of the two frames was modelled, observe the correlation of the numerical to the experimental results, and examine the effect of modelling in increasing the accuracy of simulation. The simplicity in modelling results in computational-time reduction and thus provides the opportunity to study the 3D behaviour of the building. It should be repeated here that the PsD test was unidirectional and care was taken so no rotation was introduced in the two frames. Therefore, by 3D behaviour it is meant the contribution of the connecting slabs and beams to the response of the two planar frames. The numerical model was created in SAP2000 (2010), which is widely used both for commercial and academic purposes (unlike the sophisticated software needed for micromodelling), offers a friendly graphical interface, and includes non-linear models both for line and shell elements. A view of the model is shown in Fig. 11. The modelling of the building was assembled using line fibre elements for the columns, which are expected to behave nonlinearly as it was observed during the experiment. The column crosssection was discretised in eight concrete fibres and four steel ones as shown in Fig. 12. The fibre element properties were distributed along the length of the column elements. The Takeda (1970) model was used to describe the nonlinear properties of concrete including cracking. The Mander (1984) unconfined concrete model was used to describe the monotonic stress-strain relationship. In the case of the steel reinforcement, kinematic hysteretic type was assumed. The monotonic laws for both materials are shown in Fig. 13.
Fig. 11 3D view of the numerical model in SAP2000
Nicholas Kyriakides et al.
Fig. 12 Characteristics of fibres of column cross-section
(a) Concrete
(b) Steel reinforcement Fig. 13 Monotonic laws
Both longitudinal and crossbeams were modelled using elastic properties since they did not show nonlinear behaviour during the experiments. In order to account for the reduction in stiffness due to cracking at the 0.25 g test, a 10% reduced elastic stiffness was used for the longitudinal beams. The slabs were modelled with linear shell elements. RC infill walls in the middle bay of the building were modelled using a nonlinear fibre shell element. The discretization of the wall cross-section was created automatically and accounting for the in-plane properties of the wall. The steel mesh reinforcement of each wall was modelled based on the corresponding detail as described in Chrysostomou (2014) in order to account for the strength reduction in higher floors. The discretization for the first floor wall is shown in Fig. 14. The same material constitutive laws were applied as for the column line elements. A single shell element was used to model the wall in each floor. The walls were assumed to be rigidly connected to the four corners of the bounding frame elements in each floor therefore no relative movement between the walls and the bounding frame was allowed, which is one of the shortcomings of the model.
Numerical simulation of the experimental results of a RC frame retrofitted with RC Infill walls
Fig. 14 Discretization of shell RC wall cross-section for the 1st floor wall
Fig. 15 Evolution of frequency of the tested building during the 0.25 g test
Based on the correlation of the results, it will be concluded whether such a movement took place or if the connection of the wall to the bounding frame using closely spaced dowels was close to rigid. The full mass of the original building (600 Tonnes) was applied on the model as lumped masses on all the nodes. The floor loading included floor finishes and distributed masonry walls. The numerical period at the beginning of the 0.25 g test was equal to 0.48 sec., which was very close to the experimentally recorded one at the beginning of the test that was approximately equal to 0.50 sec. The evolution of the first mode frequency during the 0.25 g test is shown in Fig. 15. Similar to the 2D finite element model, a 0.25% viscous damping was used in the model to account for the limited viscous damping activated in the structural elements during the slow process of the pseudo-dynamic testing. The hysteretic damping introduced by the nonlinear
Nicholas Kyriakides et al.
behaviour of the elements was modelled by the nonlinear hysteretic models used for concrete and steel. The comparison of experimental to the numerical history of top storey displacements is shown in Fig. 16. It can be easily concluded that the numerical model captures with high accuracy the behaviour of the tested building. Both the evolution in period and strength during the experiment are very well simulated in the model and so is the nonlinear behaviour of the building. To examine the correlation of the base shear force, energy dissipation and stiffness between the experimental and numerical model, the base shear versus top displacement hysteretic curves were plotted as shown in Fig. 17. From the comparison in Fig. 18, it appears that the base shear in the numerical model simulates closely the experimental one. In addition, the stiffness of the numerical model defined by the slope of the hysteretic loop is close to the experimental one. Regarding the energy dissipation, based on the width of the hysteretic loops it appears that the numerical model absorbs slightly higher levels of energy (probably more damage).
0.15 0.10
Experimental
Top Displacement (m)
Numerical 0.05 0.00 0
1
2
3
4
5
6
7
8
9
10
11
12
13
14
15
-0.05 -0.10 Time (sec.) -0.15
Fig. 16 Comparison of top storey displacement history for the 0.25 g test Base Shear force (kN)
2500 2000 1500 1000 500
-0.12
-0.10
-0.08
-0.06
-0.04
-0.02
0 0.00 -500
0.02
0.04
0.06
0.08
0.10
0.12
Top displacement (m)
-1000 -1500 -2000
Numerical Experimental
-2500
Fig. 17 Comparison of base shear vs. top storey displacement history for the 0.25 g test
Numerical simulation of the experimental results of a RC frame retrofitted with RC Infill walls
6. Bare frame In order to assess the seismic capacity of the original bare frame, and appreciate the efficiency of the proposed retrofit technique in enhancing its seismic capacity, the numerical analysis was repeated after removing the RC infill walls from all the floors in the simple numerical model. The good correlation of the global results of this model to the corresponding finite element ones allowed us to avoid using complicated and time-consuming finite element analysis for the bare frame. The capacity of the bare frame was determined by performing a number of non-linear timehistory analyses. In each one of those analyses the selected acceleration record was scaled to increasing PGA levels and the response of the column ends was monitored. A concentrated plasticity (plastic hinge) model was used at both ends of each column to model their nonlinear moment-curvature hysteretic behaviour. A fibre section was used to compute the momentcurvature relationship through cross-section analysis. The discretisation of the cross-section in fibres is shown in Fig. 12. Strength and stiffness degradation were not included in the behaviour. Since strength degradation was not accounted for, the ultimate capacity of the frame was linked to the attainment of the yield moment in columns and thus the propagation of damage to columns and joints was recorded through the analyses. The number of plastic hinges defined the amount of damage to the building. Therefore, the attainment of the plastic capacity at the ends of all groundfloor columns was regarded as evidence of reaching the capacity of the building. Using this procedure and by examining the hysteretic behaviour of the ground floor columns, it was observed that at an acceleration of 0.05 g, yielding took place in most of the ground floor columns, which can be used to signal the attainment of the capacity of the frame. The hinge results for two of the corner columns are shown in Fig. 18, whereas the corresponding results for inside columns are shown in Fig. 19. It is obvious from Figs. 18 and 19 that the yield moment was marginally reached and that hysteretic behaviour with some energy dissipation at the hinges took place. An attempt to increase the PGA of the record to 0.06g was conducted that showed significant plastic rotations in most of the ground floor columns. It is believed that since the building was not designed for seismic loading, these plastic rotations cannot be accommodated by the design and detailing of the crosssection.
(a)
(b) Fig. 18 Hinge results for corner columns
Nicholas Kyriakides et al.
(a)
(b) Fig. 19 Hinge results for inside columns
This analysis demonstrates the efficiency of this retrofitting method, since by introducing the RC infill walls in the central span of the three-span bare frame, which was designed for gravity loads only, there was a five-fold increase in its capacity to withstand horizontal loads (from 0.05 g to 0.25 g). Therefore, this method can be considered as a viable methodology for the seismic retrofitting of existing structures designed for gravity loads only.
7. Conclusions The purpose of this paper was to examine the capabilities of a 2D finite element micro-model and a simple fibre macro-model to simulate the experimental nonlinear behaviour of a 4-storey RC building strengthened with RC infill walls. The numerical results from the two models were compared in the paper with the experimental results from a full-scale pseudo-dynamic test on a retrofitted RC building. The comparison was conducted using the floor displacement and baseshear time-histories. The elastic characteristics of the building were also well simulated as it is shown from the comparison of the fundamental frequency values. Both models managed to simulate the experimental behaviour of the tested retrofitted building with very good levels of accuracy in all the response parameters mentioned above. Since no relative movement was allowed in the interface between the RC Infill walls and the bounding frame in the numerical models, it was concluded that using the specific connection details leads to monolithic behaviour. The procedure followed for the design of the connections is described in Fardis (2013). It should be stressed out though that if less dowels were used at the connection interface, relative movement might have taken place, which would require modelling of the interface between the infill and the bounding frame in order to capture this behaviour, hence more complicated models would have been required. A comparison was also made between the capacity of the bare and the infilled frame using the macro-model and it was concluded that the latter one managed to withstand an earthquake with a PGA, which was five times larger than the one that the bare frame could resist. This shows that this retrofitting method is promising and further refinements will be made in the models in order to test various connection details and earthquake loads that will make it possible to
Numerical simulation of the experimental results of a RC frame retrofitted with RC Infill walls
propose a design methodology for such structures. Acknowledgments This project ΔΙΑΚΡΑΤΙΚΕΣ/ΚΥ-ΓΑ/0512/02 is funded under DESMI 2009-10 of the Research Promotion Foundation of Cyprus and by the Cyprus Government and the European Regional Development Fund.
References Antonopoulos, T.A. and Anagnostopoulos, S.A. (2012), “Seismic evaluation and upgrading of RC buildings with weak open ground stories”, Earthq. Struct., 3(3-4), 611-628. BS8110 (1983), Structural use of concrete, Code of Practice for Design and Construction, Part 1, The Council for Codes of Practice, British Standard Institution, London. BSI (1972), CP110-The structural use of concrete, Part 1, The Council for Codes of Practice, British Standards Institution, London. Cast3M, Site web of the finite element code Cast3M, http://www-cast3m.cea.fr. CEN (2004), Eurocode 2: Design of concrete structures-Part 1: General rules and rules for buildings (EN1992-1-1), Comité Européen De Normalisation. Chrysostomou, C.Z., Poljansek, M., Kyriakides, N., Molina, J. and Taucer, F. (2013), “Pseudo-dynamic tests on a full-scale 4-storey RC frame seismically retrofitted with RC infilling”, Struct. Eng. Int. J. IABSE, 23(2), 159-166. Chrysostomou, C.Z., Kyriakides, N.C., Poljansek, M., Molina, J. and Taucer, F. (2014), Seismic Evaluation and Rehabilitation of Structures, Chapter 17: RC Infilling of existing RC structures for seismic retrofitting, Geotechnical, Geological and Earthquake Engineering 26, Springer International Publishing, DOI 10.1007/978-3-319-00458-7_17. Fardis, M.N., Schetakis, A. and Strepelias, E. (2013), “RC buildings retrofitted by converting frame bays into RC walls”, Bull. Earthq. Eng., 11(5), 1541-1561. Faria, R., Oliver, J. and Cervera, M. (1998), “A strain-based plastic viscous-damage model for massive concrete structures”, Int. J. Solid. Struct., 35(14), 1533-1558. Hemant, K.B., Durgesh, R.C. and Sudhir, J.K. (2009), “Effectiveness of some strengthening options for masonry infilled RC frames with open first story”, J. Struct. Eng., ASCE, 135(8), 925-937. KANEPE (2012), Code for Intervention in Reinforced Concrete Buildings, Earthquake Planning and Protection Organization (OASP), Athens. Mander, J.B., Priestley, M.J.N. and Park, R. (1984), “Theoretical stress-strain model for confined concrete”, J. Struct. Eng., ASCE, 114(3), 1804-1826. Menegoto, M. and Pinto, P. (1973), “Method of analysis of cyclically loaded reinforced concrete plane frames including changes in geometry and non-elastic behaviour of elements under combined normal force and bending”, IABSE Symposium on Resistance and Ultimate Deformability of Structures Acted on by Well-Defined Repeated Loads, final report, Lisbon. Millard, A. (1993), Castem 2000 User Manual, Technical report No. Rapport CEA-LAMBS No 93/007, Commissariat Francais Energie Atomique, Saclay, France. Misir, I. (2014), “Potential use of locked brick infill walls to decrease soft-story formation in Frame buildings”, J Perform. Constr. Facil., http://dx.doi.org/10.1061/(ASCE)CF.1943-5509.0000633. Molina, F.J., Magonette, G., Pegon, P. and Zapico, B. (2011), “Monitoring damping in pseudo-dynamic tests”, J. Earthq. Eng., 15(6), 877-900. Poljansek, M., Taucer, F., Molina, J., Chrysostomou, C.Z., Kyriakides, N., Onoufriou, T., Roussis, P., Kotronis P., Panagiotakos, T. and Kosmopoulos, A. (2014), Seismic Retrofitting of RC Frames with RC
Nicholas Kyriakides et al. Infilling (SERFIN Project), JRC Scientific and Policy Report, Publications Office of the European Union, Luxembourg, doi:10.2788/630. SAP2000 (2010), Computers and Structures, v.14.2.3 Takeda, T., Sozen, M. and Nielsen, N. (1970), “Reinforced concrete response to simulated earthquakes”, J. Struct. Div., ASCE, 96(12), 2557-2573.
SA